A few months ago, I had a conversation with one of our users at Venngage. They own a small commercial lease review company called Lease Ref. They told me that one of the biggest problems they faced was making information engaging for their clients.
After all, while renting and buying is exciting, the more technical side of it–mortgages, loans, bidding, negotiation—isn’t as fun.
But by creating infographics that communicated real estate concepts, they were able to increase traffic to their blog, impress their clients, and position themselves as thought leaders in their niche.
The right real estate CRM tool, custom surveys, or case studies can help enlighten you on the type of questions your audience has. Then you need to communicate that information to your audience clearly. If you’re looking to emerge as a thought leader in the real estate niche, you can set an example by providing clear and engaging communications.
Infographics are a versatile type of visual. You can use an infographic to summarize processes, to simplify complex topics, compare information and to show trends over time.
NEW! Introducing: Marketing Statistics Report 2022
It’s 2022 already. Marketers, are you still using data from pre-COVID times?
Don’t make decisions based on outdated data that no longer applies. It’s time you keep yourself informed of the latest marketing statistics and trends during the past two years, and learn how COVID-19 has affected marketing efforts in different industries — with this FREE marketing statistics report put together by Venngage and HubSpot.
The report uses data gathered from over 100,000 customers of HubSpot CRM. In addition to that, you’ll also know about the trends in using visuals in content marketing and the impacts of the pandemic on visual content, from 200+ marketers all over the world interviewed by Venngage.
Grab your copy now — it’s not like any other marketing reports out there, plus it’s 100% free!

You can create your own real estate infographics by starting with a template. To create your own real estate infographics, follow these 5 steps:
- Plan what the goal of your infographic will be—to explain a process? To motivate your peers? To compare prices?
- Create a simple outline for your infographic.
- Pick an infographic template that fits the type of information you want to visualize.
- Adjust the charts, pictograms and icons to fit your information.
- Customize the color scheme, fonts, and visuals to fit your branding.
Here are 12 real estate infographics templates and tips to get you started on creating your own engaging real estate infographics.
1. Summarize key metrics and deliverables with a real estate infographic report
To create a report that engages your audience, visuals are key. Reports are packed with useful sets of data, but they can also be dry. Designing a real estate report as an infographic lets you convey the same insights while making them accessible and appealing to a wider audience.
It’s great to keep things simple, but don’t be repetitive. Repeating visuals in an infographic can sometimes make your viewers lose interest. This template is a great example of how to keep things simple but engaging at the same time.
The real estate infographic below divides the information into bite-sized sections, using icons to emphasize each data point. This makes it easy to scan the infographic and pull key information.
2. Organize your real estate infographic into a simple flow chart to highlight industry best practices
A flow chart is a great way to break down lengthy processes and make information memorable. A flow chart is also much easier to refer back to than a long article or video with the same content.
In the real estate infographic below, a clear title leads you to the content. Each illustrated icons indicates a topic; each header conveys a specific set of points and so on.
Also, note that each section has a maximum of two sentences. Even with more in-depth topics, the text in your infographic should be concise.
3. Highlight the benefits of one type of property with an informational infographic
To help your clients make the best decision for their lifestyles, it’s good to provide them with options.
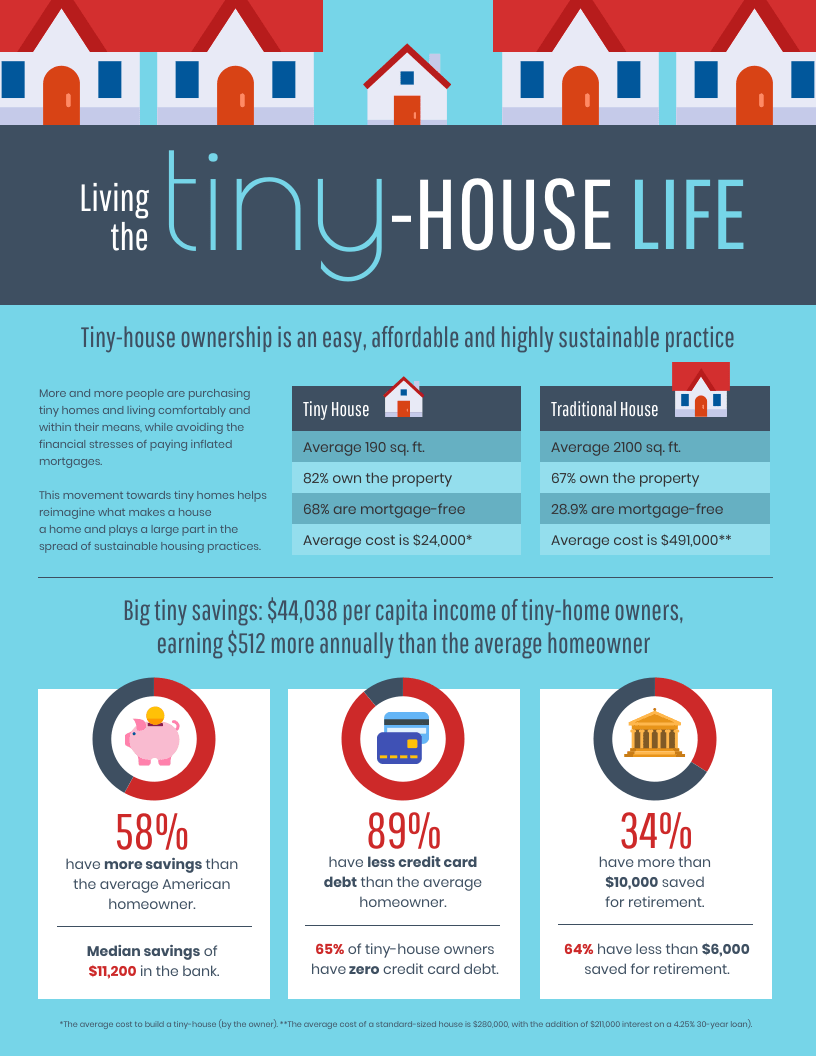
This infographic breaks down one particularly niche type of home: the tiny home. Illustrative icons and quirky font in the title help to emphasize the “quaint” quality of this type of home.
Rather than just listing information, incorporating thematic design element can help readers visualize the information.
4. Create a real estate presentation to impress your clients
Having presentations at the ready makese you look prepared, demonstrates professionalism and builds trust with your clients.
But to stand out from everyone else, you’ll want a visually-captivating and unique presentation. It may require some creativity, but we’ve got the right real estate infographic templates to inspire you.
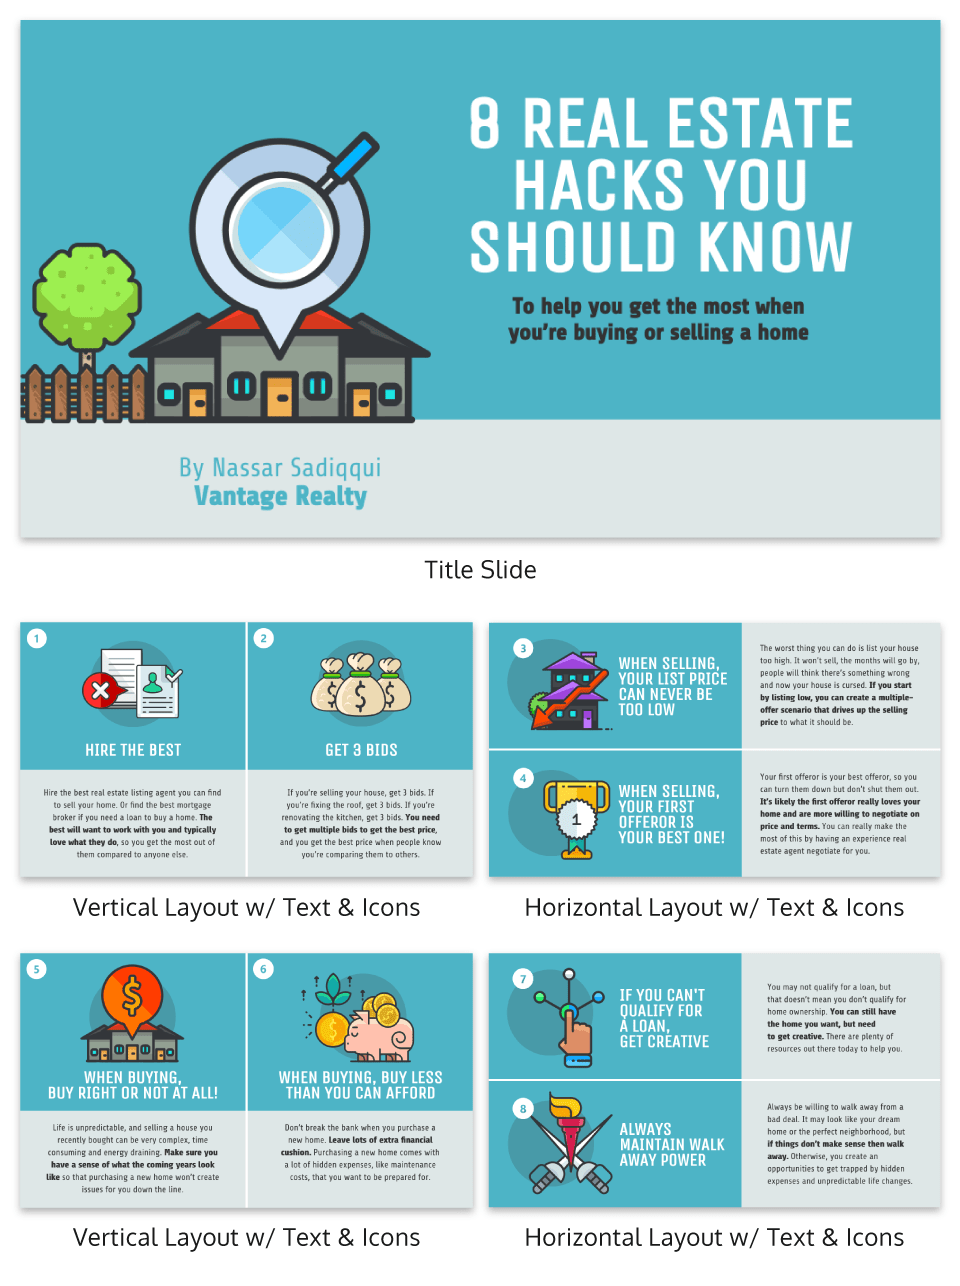
This presentation deck is colorful and quirky, using soft tones and illustrated icons to share insights. It includes a title slide, plus two different sets of layouts. As you design your own presentation, you can incorporate both layouts, stick with just one or create your own by switching things around.
A handy design hack is to combine icons to create your own custom illustrations. For example, take a look at how icons are combined in these slides:
5. Demystify the mortgage process with an informative infographic
Many of the steps to owning or selling a home can be complicated. Explaining confusing concepts in a clear and visual way can make a great impression on clients and your peers.
This real estate infographic template uses a combination of numbered points, a chart, and bold text to present information in a clear-cut and varied way:
6. Engage your social media audience with an eye-catching infographic
Odds are, a lot of your clients are going to look you up on social media. To create a strong online presence, share informative and visually-engaging posts.
For example, you can use a social media graphic like this one to educate and inspire your audience. Summarize key real estate processes, share some motivational tips for productivity, or share resources like the best real estate websites for agents. This is also a great way to help grow your brand as a thought leader in you niche.
The key is to keep your social media graphic designs relatively simple. Save more complex designs for blog posts and reports.
7. Compare pricing and show trends over time with a multi-chart infographic template
Charts are a great communication tool. Visualizing data can help your clients understand it much more clearly.
This real estate infographic template incorporates multiple charts to depict a variety of data in a varied way. Different types of charts and graphs will make different types of data easier to understand. Variety also helps keep your readers engaged.
For example, if you compare the best box office hits of 2017, a bar graph lets you quickly compare the average price for different types of homes. Meanwhile, a timeline can highlight pricing trends over time.
8. Help your clients make smart decisions with a quick reference sheet infographic
Good advice goes a long way, especially when it comes to building trust and rapport with clients. People are also more likely to remember the agents who’ve gone out of their way to be helpful.
A simple list infographic can help you share tips, best practices and real estate tools in a straightforward and easy to scan page. For example, you could list the best real estate investments. Or, like in this infographic, use a simple numbered list format to share useful real estate hacks:
9. Break down important home ownership concepts with an infographic
Part of what makes infographics an effective communication tool is that you can show information in a variety of ways. If you want to visualize a more complex concept or process–like household energy–an infographic can make it easier to present the information clearly.
Organize your information in labelled sections. Then, looks for different types of data visualization like charts and pictograms. Take a look at how this real estate infographic uses different visuals to break down household energy usage:
10. Position yourself as a thought leader with a real estate infographic geared at your peers
Being a thought leader is great for building your brand, but also your bottom line. People will trust agents who can dive into a variety of topics in depth, explain complex things very simply, or demonstrate how they stay informed.
A thought leader helps industry members reflect on their processes and clients feel reassured. For example, this infographic can help real estate agents reflect on their own daily habits, and areas where they can improve:
11. Attract new clients and recruit top talent with an infographic about your real estate company
Sometimes it’s not about what’s happening in the real estate market, but at your very own firm.
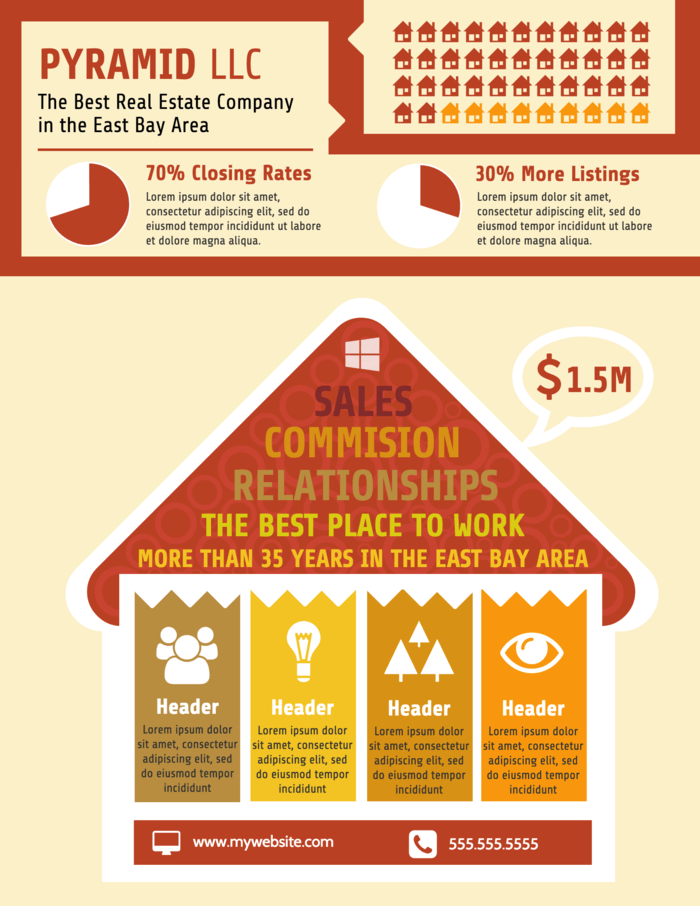
Numbers talk and using an infographic to demonstrate the metrics of your team’s success goes a long way. You can reassure your clients that you’re open and honest, while encouraging equally-driven individuals to consider joining your team.
This real estate infographic template incorporates icons, pictographs and charts to share a variety of information:
12. Create an informative real estate flyer to excite home buyers
Flyers are a staple marketing material. Whether you’re handing out printed flyers or posting them onto your social media pages, a flyer is a great way to showcase a property and really intrigue potential home-buyers. For instance, a well-designed flyer showcasing a tiny house for sale in Massachusetts can attract a lot of attention and interest.
Upload high-quality photos of your properties to use in your real estate flyer. You can place an image as the background and add an overlay; share specifications and then provide an enticing description.
For example, take a look at this home for sale flyer:
Make information accessible
Infographics are a helpful type of content to have in your real estate tool belt. Help grow your brand and strengthen your professional relationships by communicating effectively. If you need some more help getting starting creating infographics, check out more infographic design guides on our blog.
You’ll also want to check out these additional real estate marketing ideas.
More infographic design guides:
8 Social Media Graphic Design Tips
How to Pick Colors to Captivate Readers and Communicate Effectively


