


The Simple Design Platform for Visualizing Financial Data
Transform your financial information and insights into impressive visuals that engage audiences and help your organization achieve its business goals.

“This is an industry that’s conservative and old-fashioned. We used Venngage to create marketing materials that looked clean, modern and fresh, and that really attracted attention. It made us stand out from our competitors.”
Pete Dziedzic, General Counsel and COO at Life Insurance Strategies Group

Visualize (and modernize) financial data
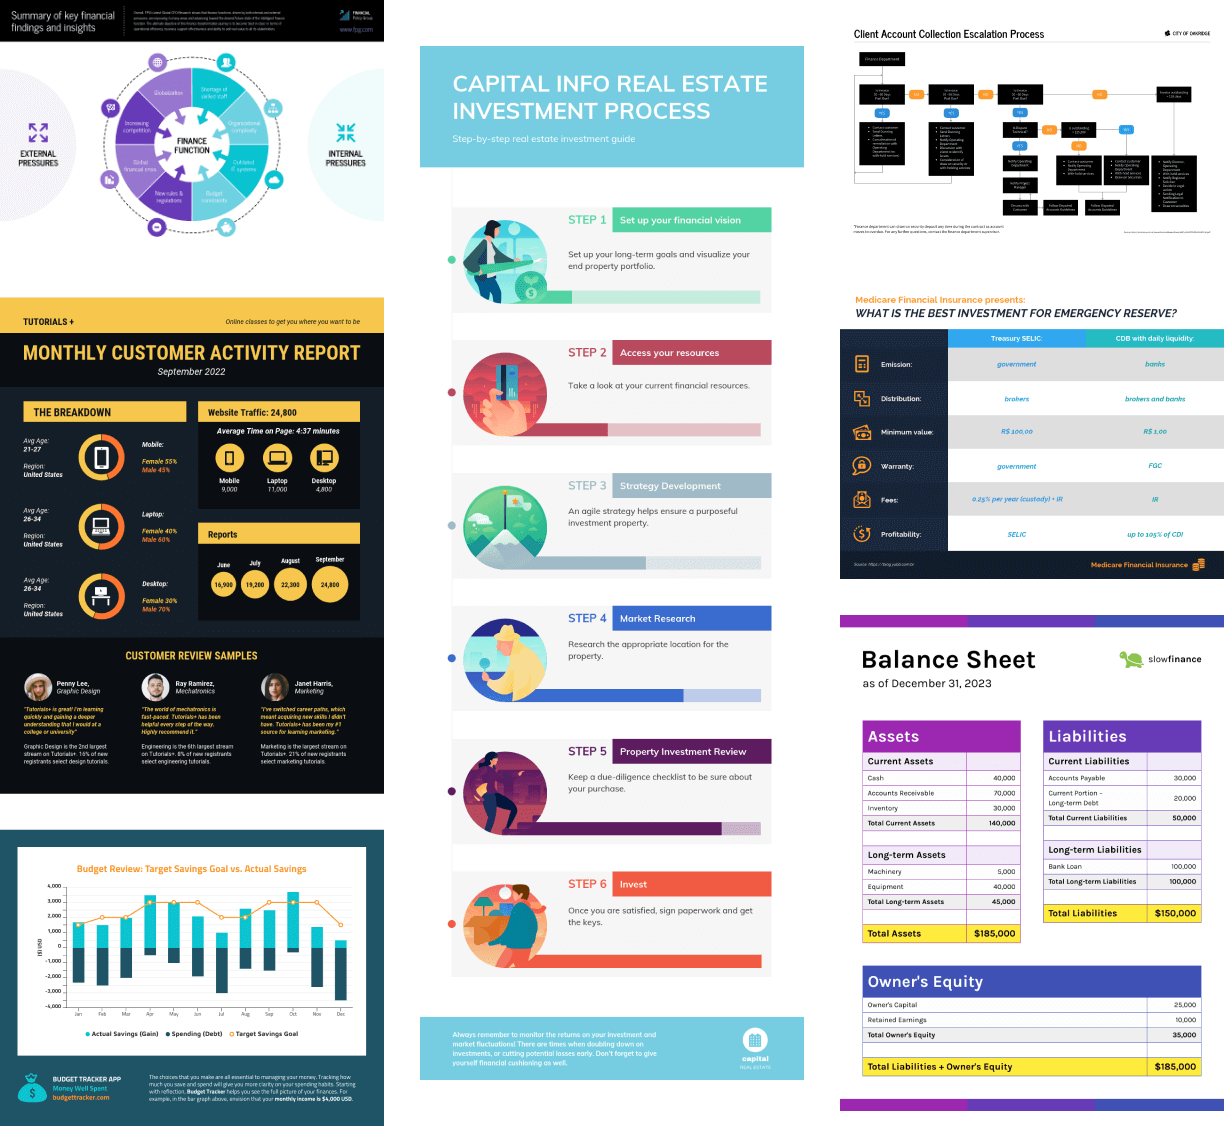
Boring spreadsheets and dull charts fail to engage audiences, and crucial insights fail to stand out. Visualize your financial information with professionally-designed infographic templates, customizable charts and graphs, and a simple online editor made for non-designers.
Digital marketing for financial services

Create engaging content marketing materials that make your financial services and products really stand out. Showcase your expertise with stunning infographics, data-driven social media graphics, impressive presentation decks, professional white paper designs and more.

Professional branding that elevates your company
Establish and grow a trustworthy, recognizable brand with Venngage’s brand-focused features. Upload company logos, brand colors, and fonts to My Brand Kit and apply your brand elements to any design with a click. Customize existing templates and save them as your own branded templates that the entire organization can share to create their own assets.
Financial communication solution for finance teams

Level up your finance team’s data analysis and reporting with Venngage’s powerful data visualization and collaboration tools. Transform uninspiring spreadsheets into highly insightful visuals that speak loud and clear. Collaborate on reports with team members to get more done in less time.
Click to get started with one of our easy-to-use financial data templates


FAQ
Why is financial data important?
Financial data are sets of financial information related to the financial health of a business. The sets of data are used by leadership and management teams to assess business performance and decide whether tactics and strategies need to be altered or replaced in order to achieve business goals. Without a clear picture of what the financial health of a business is, making strategic decisions around its performance and growth is impossible.
Externally, people and organizations outside of a business will also use financial information reported by the business to determine whether to invest in it, or if it is complying with government regulations. Making sure your financial data is well presented and visualized is key.
Where can I find financial data?
If you’re looking for financial data on businesses, there are many sources online that provide real-time information. You can use these sources to guide investment decisions with access to historical data, RSS feeds, and Twitter and Facebook updates to keep you informed.
The most popular sites for financial data on businesses today include Google, Yahoo!, Bloomberg, Morningstar and Microsoft Money. Less popular sites like Kitco, XE, and the SEC also have plenty of valuable data worth checking out too. It’s important to note, no one site or source of financial information for businesses is the best across the board--different sites will be more reliable for different businesses.
What is the best way to present financial data?
The best way to present financial data is by using customizable infographic templates and chart templates from Venngage. Spreadsheets and formulas to generate charts can be time consuming and boring to look at. Using visuals and infographics can help improve data comprehension and retention.
Infographic and chart templates give you plenty of engaging design options even with no design experience. With Venngage you save time on design, your data is engaging, and you can effectively communicate your expertise and insights.
How can I do digital marketing for financial services?
There are many strategies you can use to effectively market your financial services and products. However, the tactics you can put to use typically revolve around branding, building trust and demonstrating thought leadership.
Attractive finance infographics are a great way to present your brand, appear as a thought leader, and build that trust with your target audience. Marketing in finance has not evolved very much over the years, and infographics give you an edge over the competition. The engaging design of a finance infographic helps you stand out in an industry that can often be dry, technical and complicated. A finance infographic also provides value to your audience because it can be educational and highly memorable, making it a very helpful and practical piece of content.
Over time, with consistent design, tone of voice and publishing frequency, you will have developed a brand that inspires trust and showcases expertise.
Find out what other professionals think about Venngage

“I discovered Venngage when I was in need of custom infographics. The editor is simple and very user friendly. Definitely the enormous amount of templates available to build on is helpful. My team has already used over 150+ designs in a short period of time. The branding kit is also a fantastic addition - my company color palette is one click away - this allows for my team to use templates and brand them with our company colors to create continuity and consistency throughout all our designs the design process.”
“For a non-designer that needs easy design solutions, this is the top product! It helps with easy customization options, branding toolkits, and great options for sharing designs. Easy interface, pretty intuitive design and user experience. Love features available and responsiveness of customer service.”
Venngage for Financial Data
Create financial data reports
See more financial data reportsProvide a direct line of sight into the financial health and performance of your business. Visualize financial data clearly and effectively to communicate important insights to the rest of the organization. Choose from thousands of templates to design your own financial reports and dashboards. Customize different charts and graphs in order to highlight critical insights that should inform decision making. Look like the expert that you are by making complex financial information easy to understand and act on.
Get started with these financial data reports:


Create marketing assets for finance services
See more financial marketing assetsEasily make your finance business stand out with impressive and memorable marketing content. Design an entire suite of marketing assets from social media graphics to engaging industry reports and more. Choose from thousands of customizable templates, apply your branding with My Brand Kit, create your own branded templates, save on design costs and save time on design work.
Get started with these financial marketing assets:


Create financial presentations
See more financial presentationsElevate your financial communication skills with impressive financial presentation decks. Get started with an engaging presentation template, automate your slide designs with DesignAI, apply a variety of different chart styles throughout your presentation design, and communicate your insights easily and effectively. Ditch the spreadsheets and dull templates from boring presentation software. Present your deck directly from Venngage or export to PowerPoint if necessary.
Get started with these financial presentations:


Create financial white papers
See more financial white papersPresent your business as a true thought leader by designing professional finance white papers. Choose from hundreds of engaging, modern white paper template designs. Access thousands of high quality stock photos, illustrations and icons to add the touch of a professional graphic designer. Incorporate your choice charts, tables and graphs to visualize financial data, trends and statistics. Download your completed designs as an interactive PDF and publish online.
Get started with these financial white papers:


Venngage Financial Data Resources

Visualize and communicate financial data like a true professional. Boring spreadsheets and complicated software can be time consuming and fail to produce the impact you’re looking for. Instead, use engaging finance templates and a simple online editor to create captivating and insightful content. Create anything from financial data reports to steer your business in the right direction, to impressive finance marketing content that helps you stand out from competitors.
Check out our top resources for finance teams:
See All Posts![14+ Finance Infographics to Simplify Financial Information [Templates and Examples]](https://cdn.venngage.com/assets/img/finance/finance-infographic.png "14+ Finance Infographics to Simplify Financial Information [Templates and Examples]")
DATA VISUALIZATION
14+ Finance Infographics to Simplify Financial Information [Templates and Examples]Finance infographics are one of the best ways to elevate financial communication. They help simplify information, are far more engaging than plain text, are much easier to retain and are very likely to be shared on social media. Finance infographics are also surprisingly easy to design, a perfect visual asset for non-designers. Check out these impressive finance infographic templates and examples to get you started.
Read more
DATA VISUALIZATION
How to Use Data Visualization in Your InfographicsData visualization in infographics can be a very powerful way to present financial information. This guide written by our in-house, information design expert, Lydia Hooper, helps you understand what data visualization is and how it can be incorporated into infographic designs. You can also find helpful infographic templates and design tips throughout the post. Take your financial data visualizations to a new level today.
Read more
CASE STUDY
How a Financial Consultancy 2x Their Revenue Using VenngagePete Dziedzic, COO and General Counsel at Life Insurance Strategies Group (LISG), has managed to establish a recognizable, trustworthy brand in the high-networth life insurance space. He’s done it by establishing a consistent visual brand identity, and creating impressive visual assets that showcase thought leadership and expertise in ways that are sharp, engaging and accessible for anyone. As the team began to produce more visual content, they saw a significant growth in revenue and client referrals. Check out his journey and the designs that have won LISG more and more clients.
Read more