


Have you ever tried to summarize a complex process, or break one down into clear, concise steps for others to follow? It’s not always easy, but visuals can help. Specifically, designing a process infographic.
In this guide, we’ll share 28 customizable process infographic templates and design tips to help you get started, even if you’re a total beginner.
What is a process infographic?
Process infographics are a specific type of infographic, designed to visualize, summarize and simplify processes. They’re perfect for visualizing marketing strategies, new employee onboarding, customer journey maps, product guides, recipes and more.
Keep reading for our 28 process infographic templates you can customize right now using Venngage’s intuitive online tool.
Process infographic examples & design tips
- Follow a simple step-by-step layout for straightforward processes
- Visualize steps with icons and illustrations
- Use a circle layout to show a cyclical process
- Save space in your process infographic template by using an S-shaped layout
- Incorporate images to visualize your process
- Create a mind map for processes that don’t follow a specific order
- Color code phases of your process
- Pick fonts that reflect the theme of your process infographic
- Use arrows to give your process infographic template flow
- Use a flow chart to visualize a workflow or a process with multiple paths
- Create an infographic that lists the tools needed for a process
1. Follow a simple step-by-step layout for straightforward processes
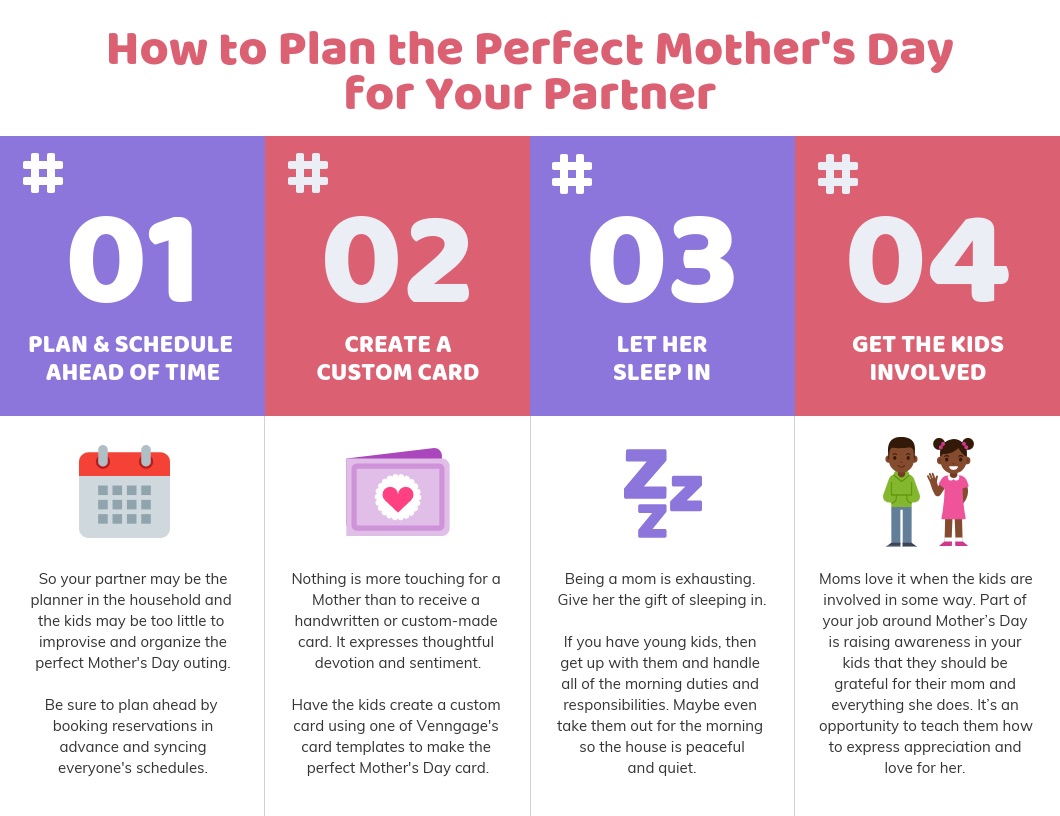
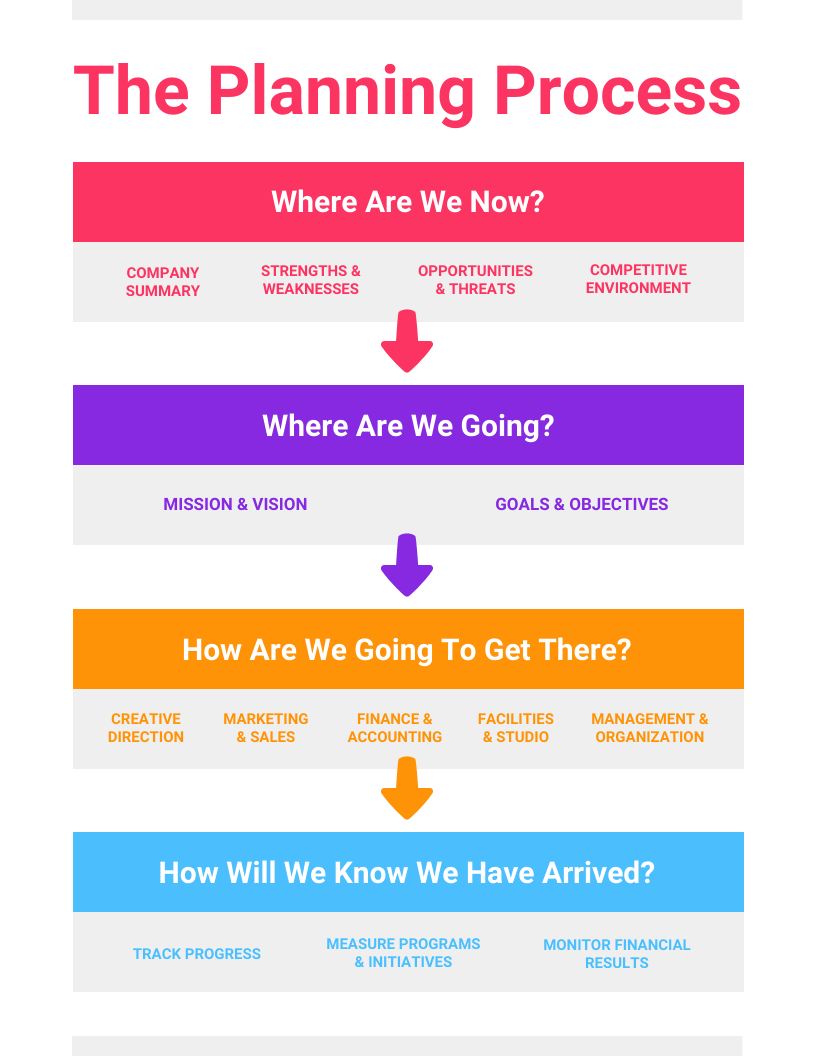
Sometimes, it’s best to not overcomplicate your design. If you want to visualize a straightforward process, then a simple infographic with numbered steps can be very effective.
Use a clear, bold header for your infographic. Then, clearly number your steps. To emphasize each step, you may want to use a different color for the numbers. Take a look at how the orange numbers stand out against the blue background in this process infographic template:
Brand your infographic using Venngage’s in-editor My Brand Kit tool–just click any of our templates to access this feature. Add your brand colors with one click or import your business or consulting logo.

Or take a look at how this writing process infographic template uses a simple color gradient to visualize progress. Color should be used strategically in your infographic to make the information easier to understand:
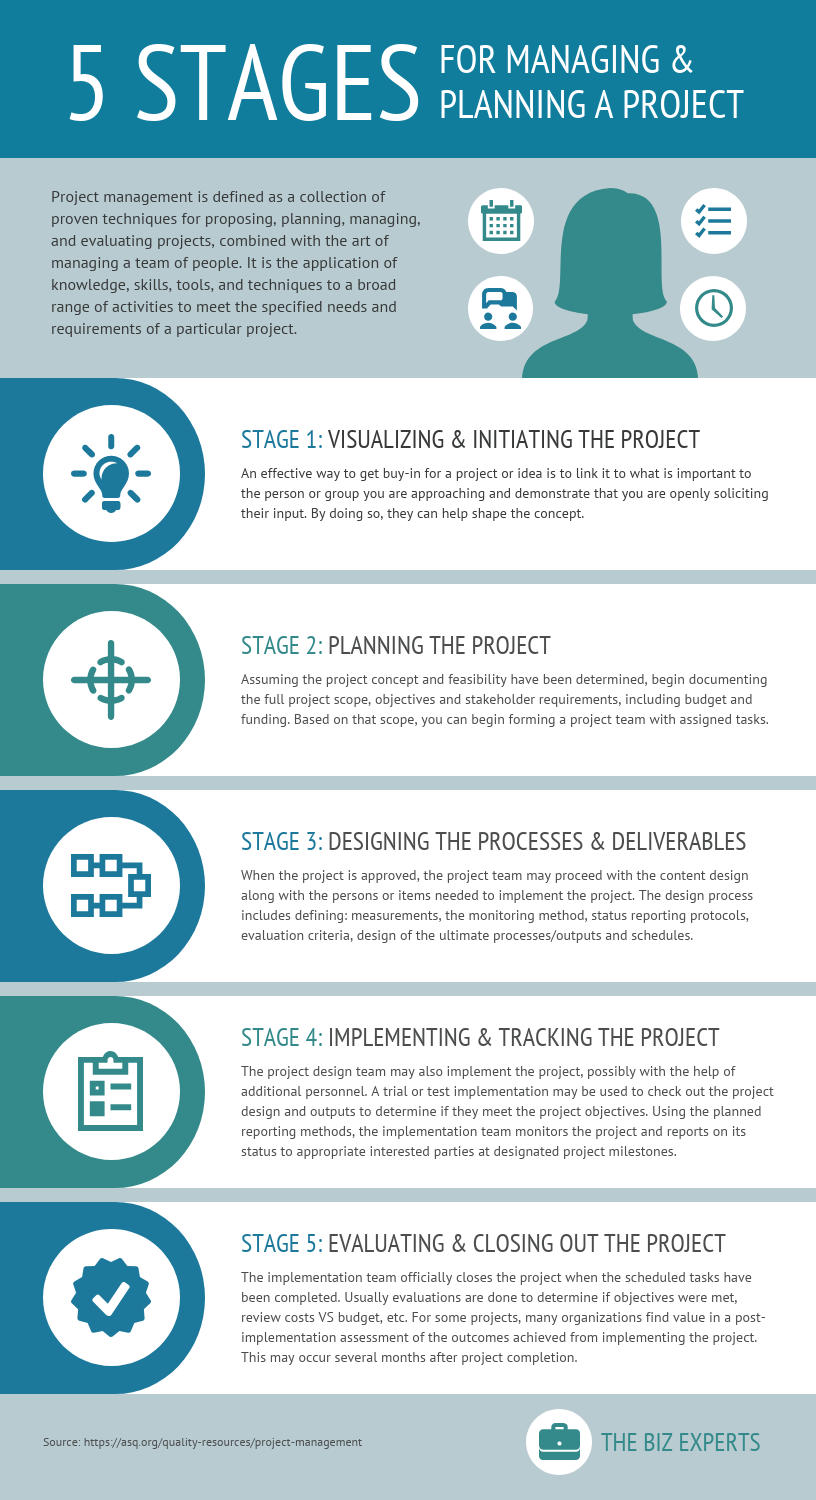
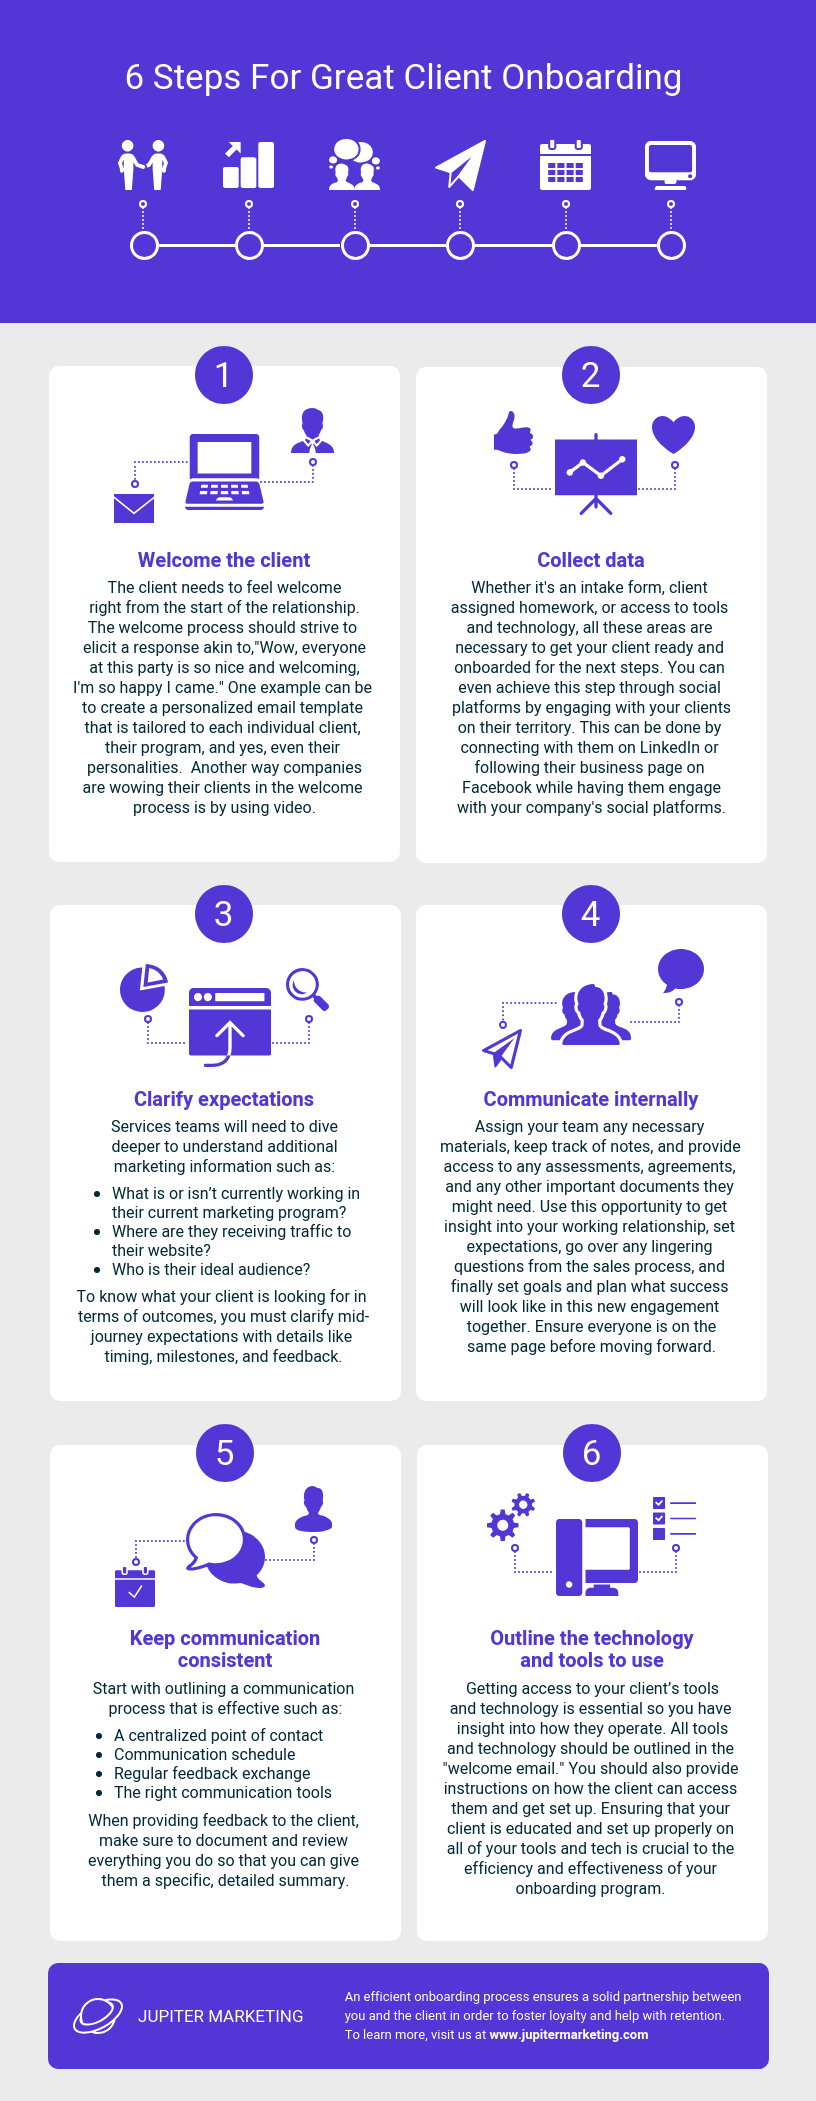
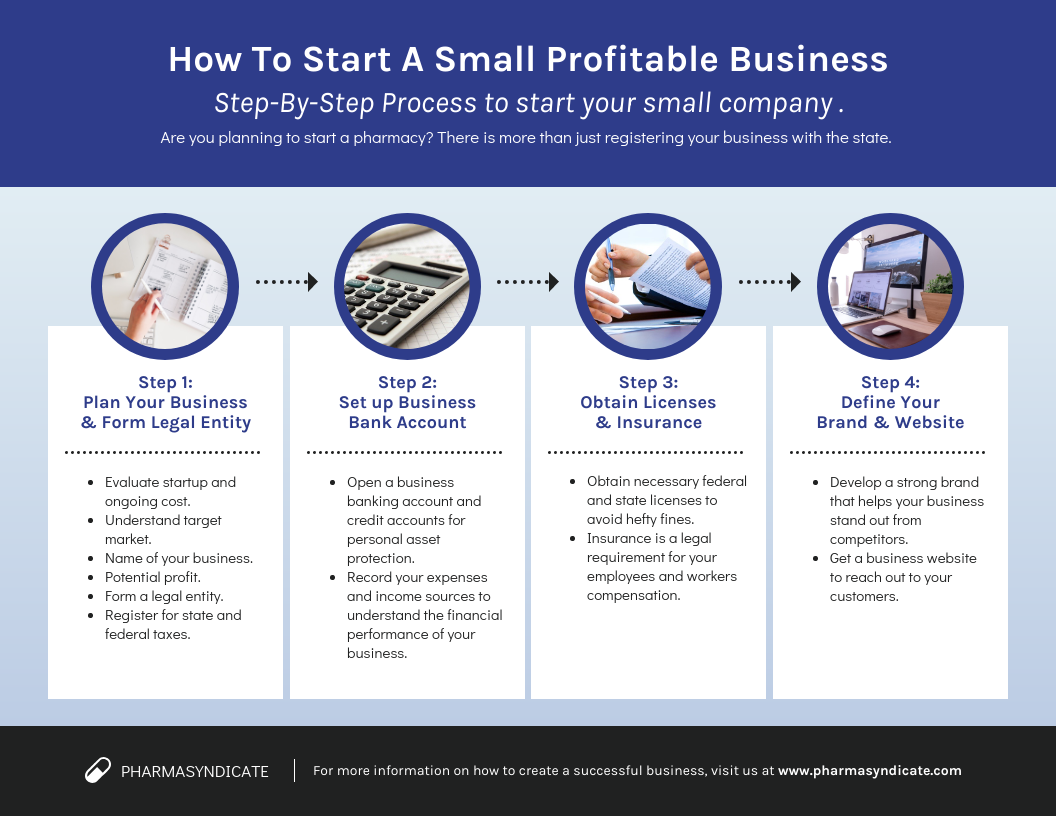
At times, your infographic may have a lot of information. The easiest way to simplify the information so that it’s not overwhelming is to add clear steps. This infographic uses colors, sections, and numbered steps to create a seamless infographic:
Another example is using color shades to flip between each step of the infographic. This keeps the infographic more engaging and easy to follow:
If you’re working with data-heavy content, a research infographic might be a better fit. It’s designed to present research findings in a clear, digestible format.
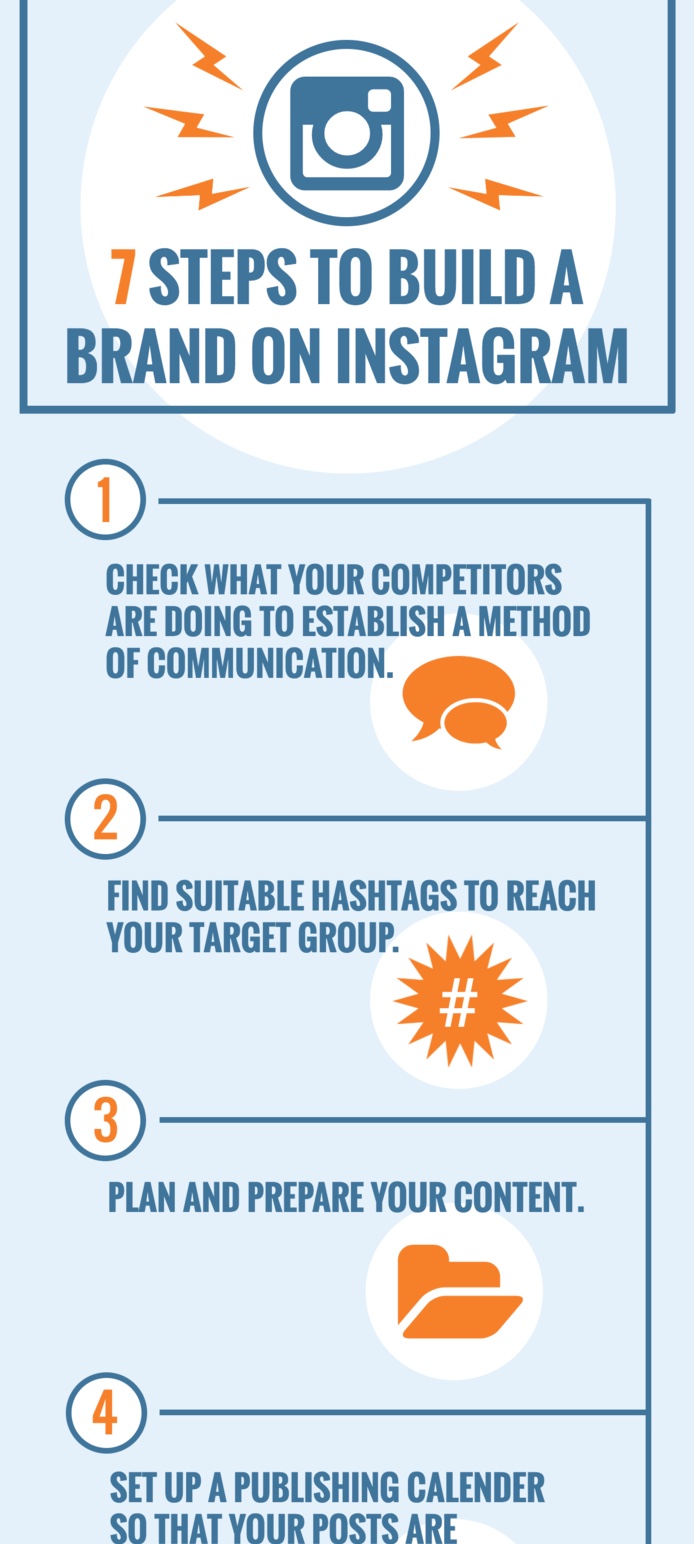
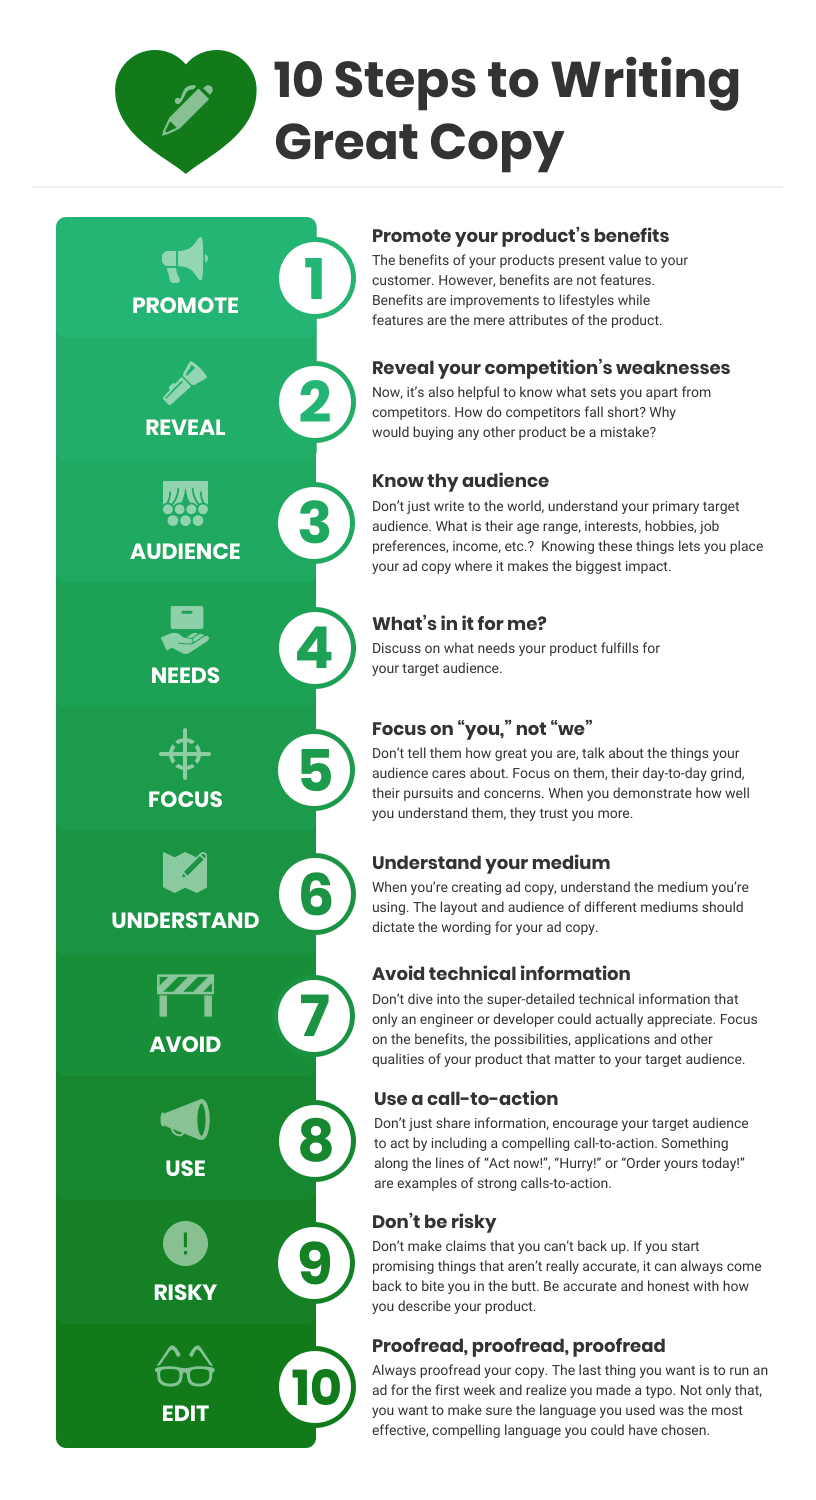
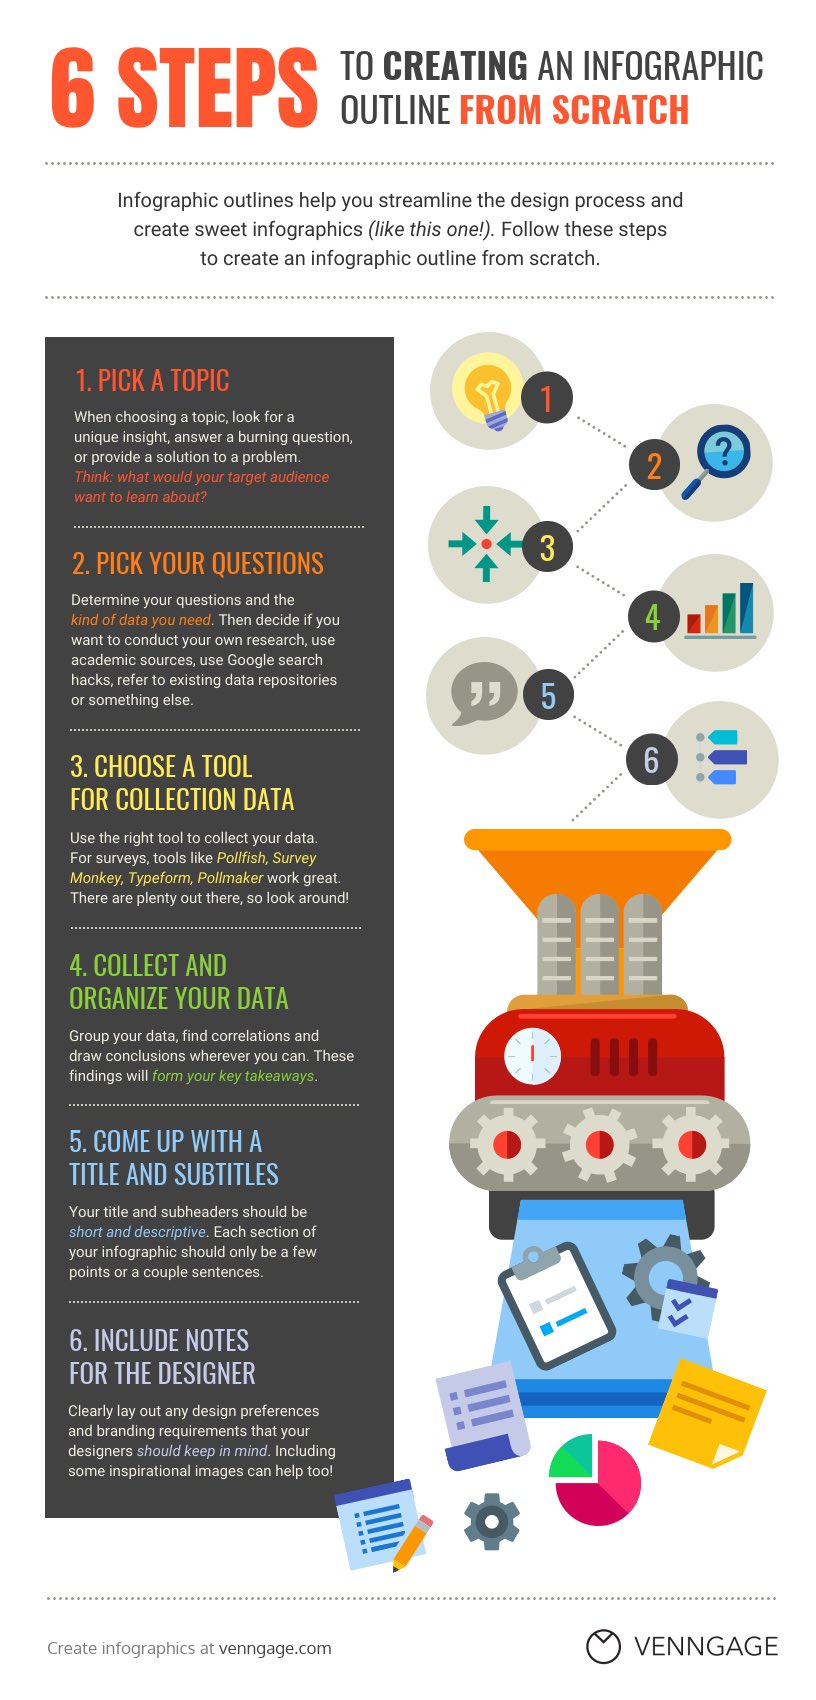
2. Visualize steps with icons and illustrations
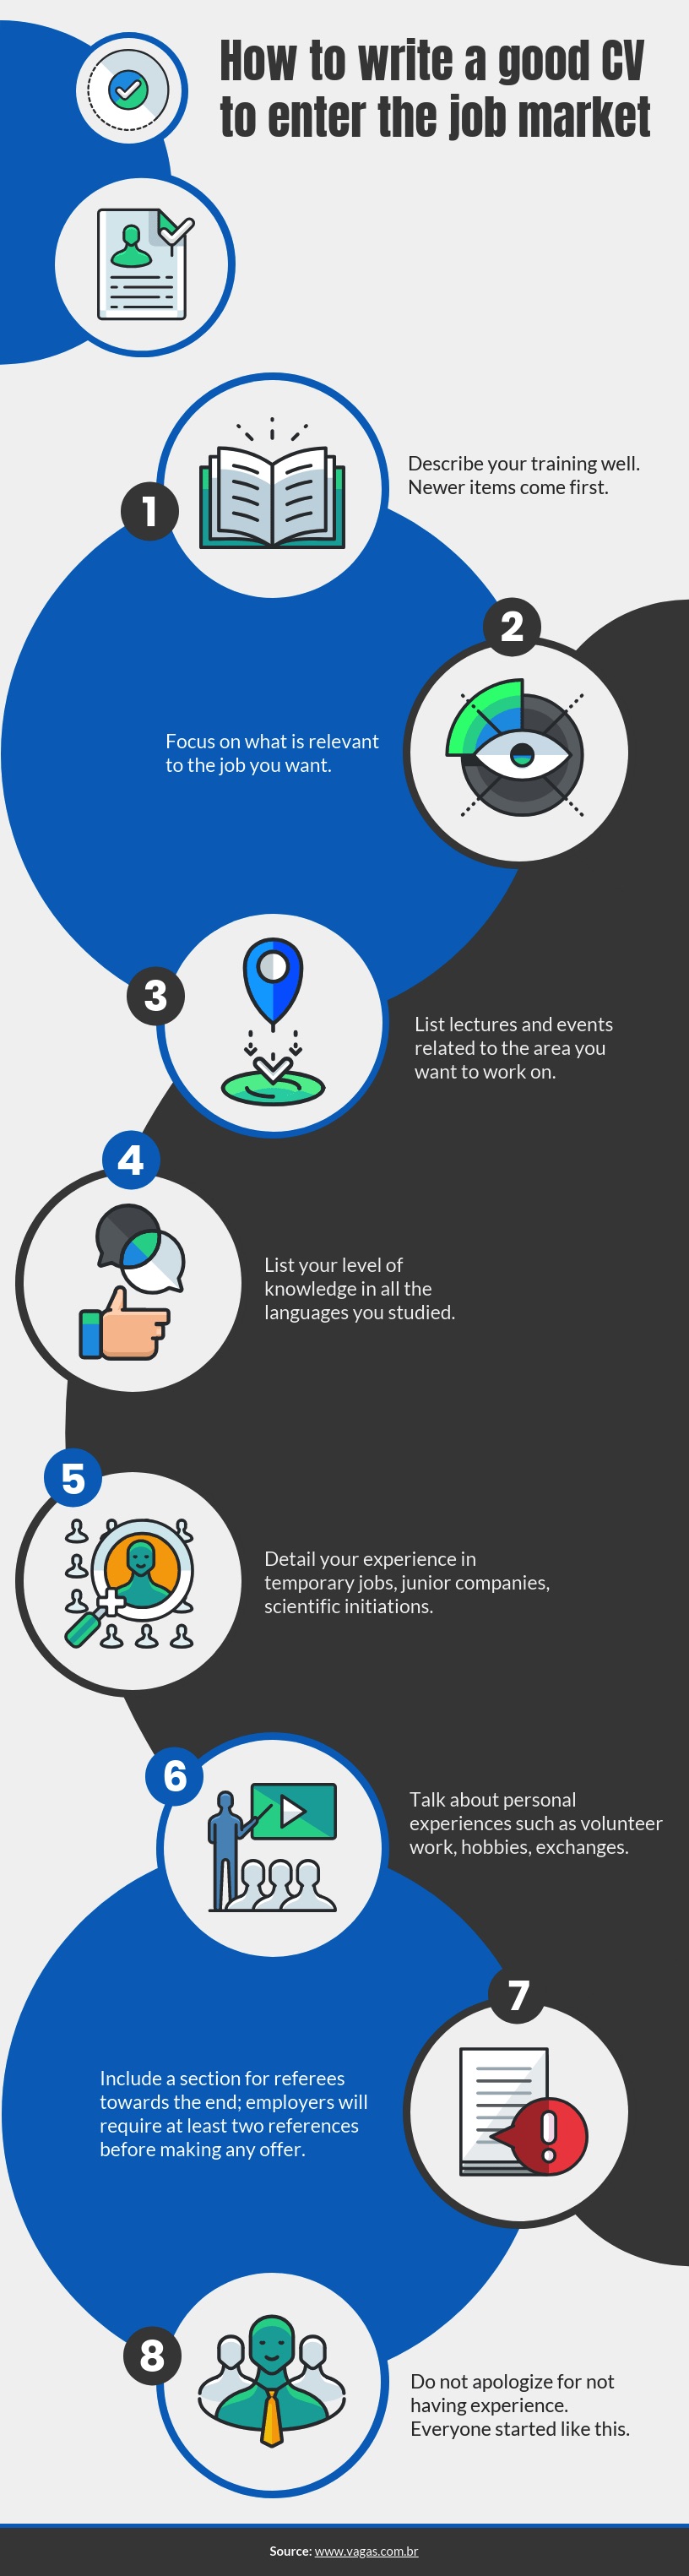
At Venngage, we’re big fans of icons. In fact, we have a library of over 40,000 icons which you can use in your infographics. In the process infographic template below, icons are used to illustrate each step of a lengthy process. This not only adds visual interest, it prevents the design from becoming too text heavy.
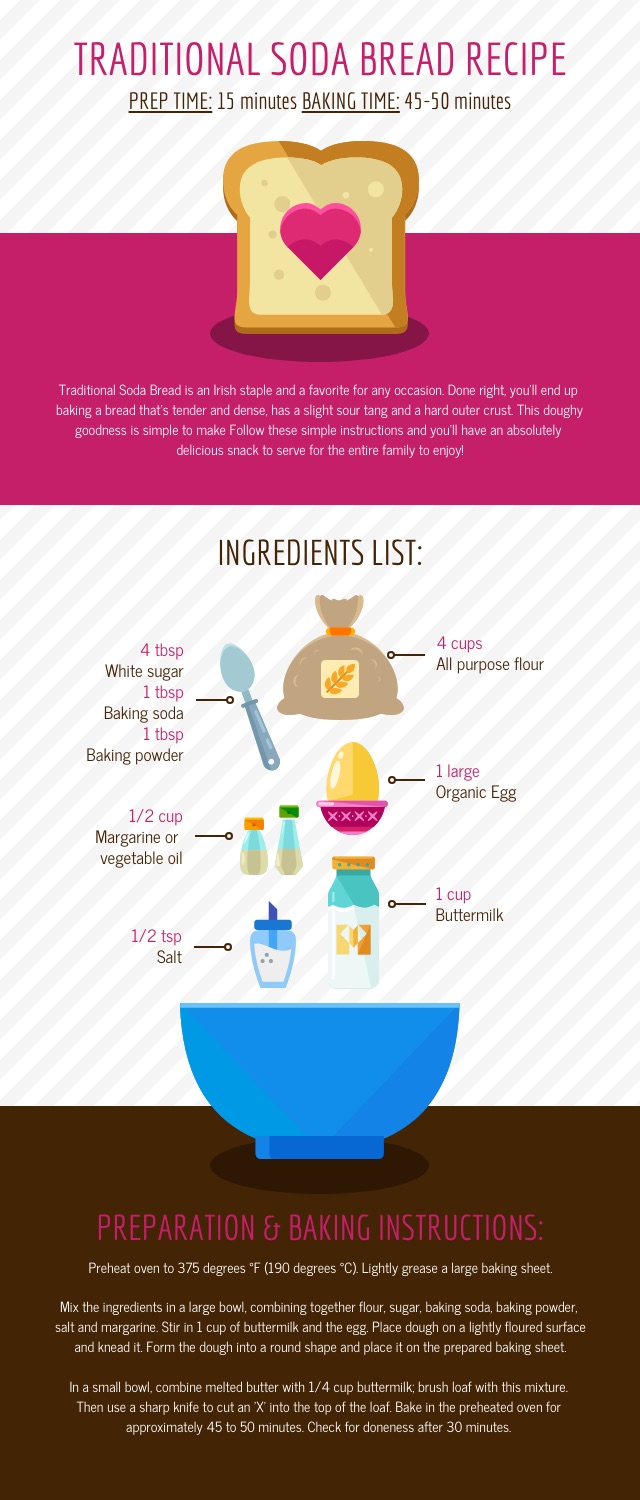
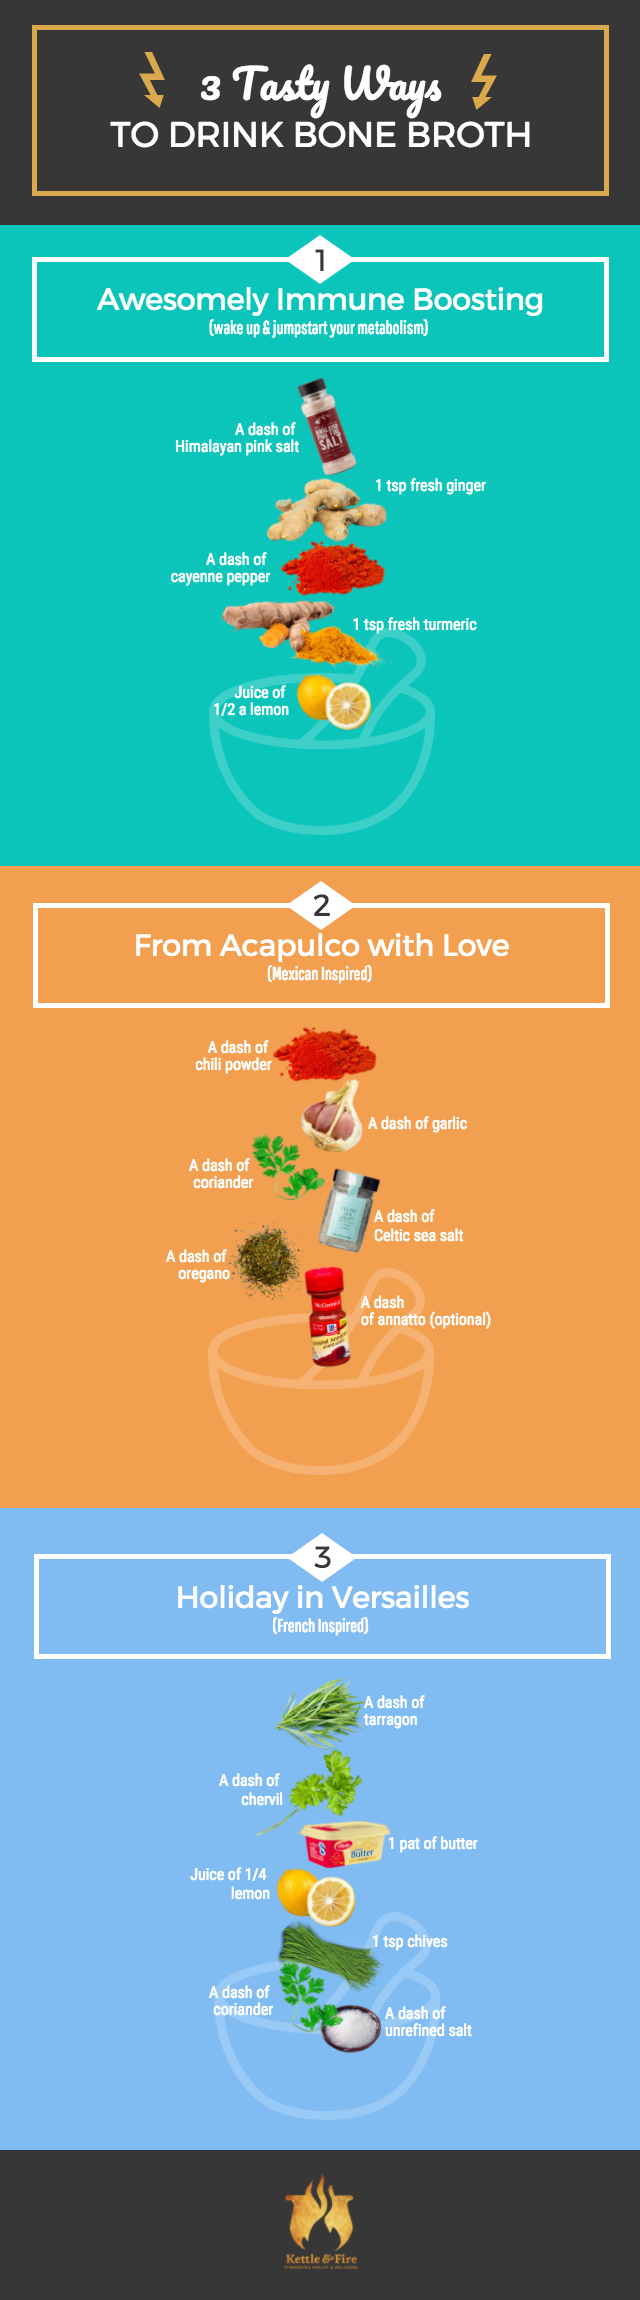
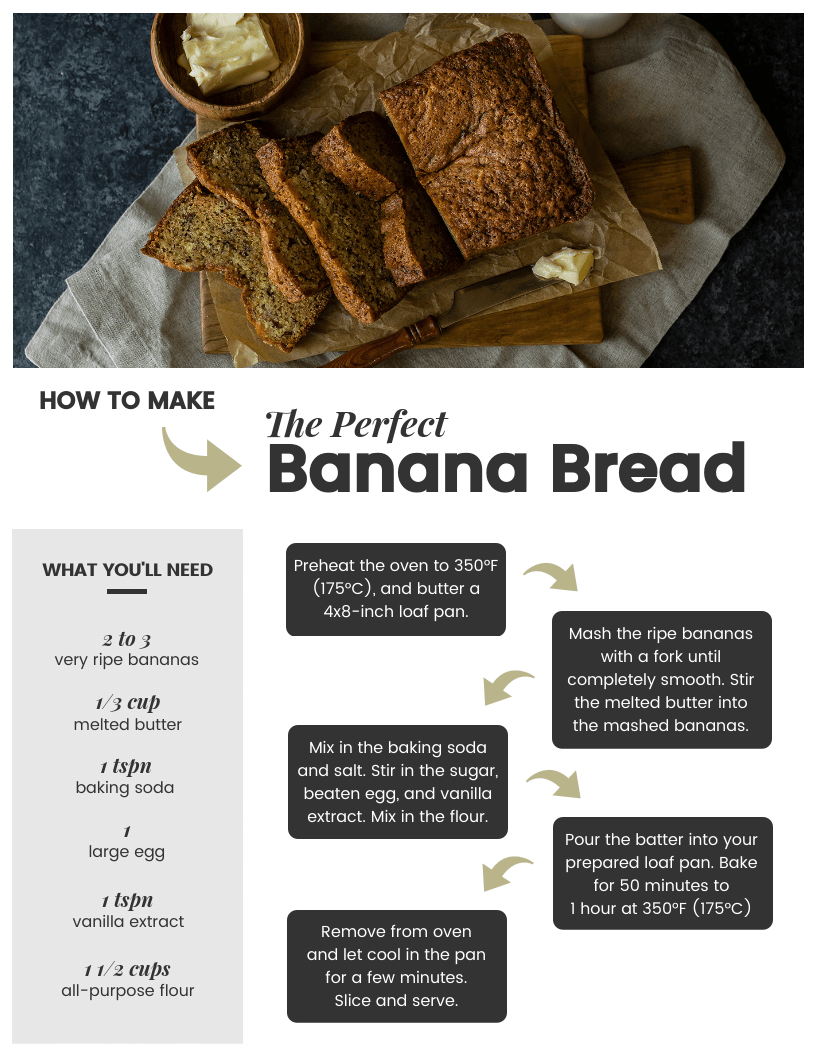
The recipe infographic below similarly showcases its ingredients with illustrated icons:
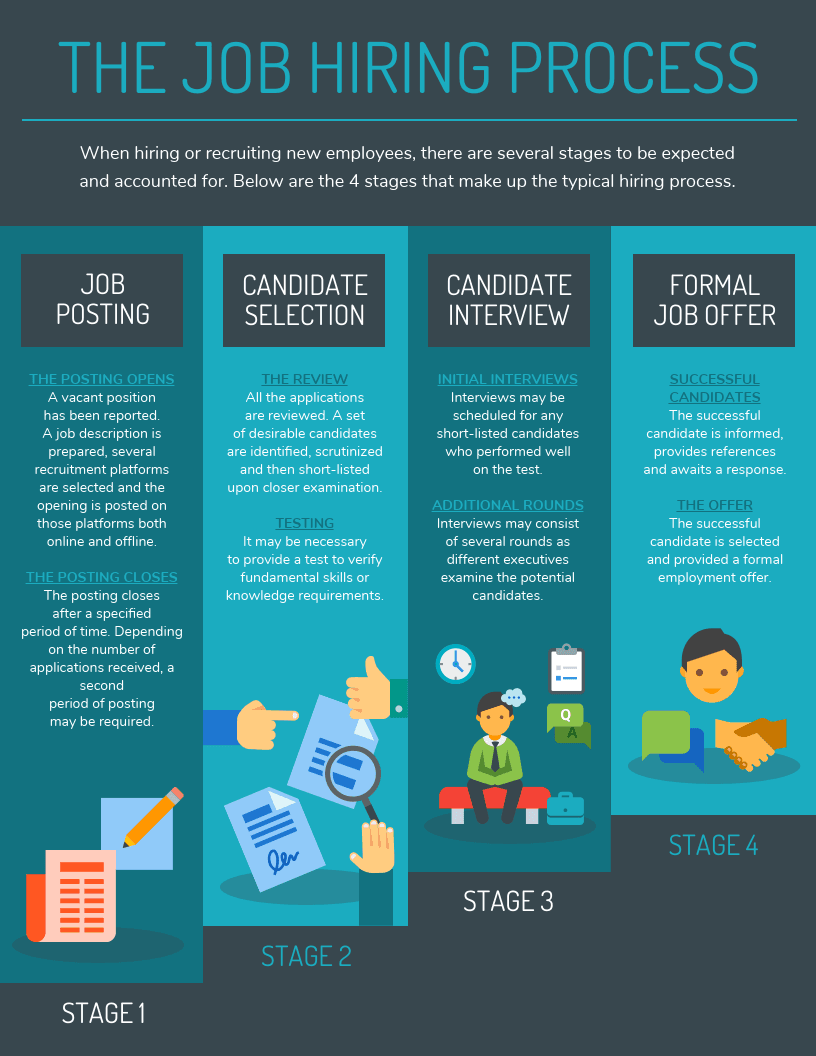
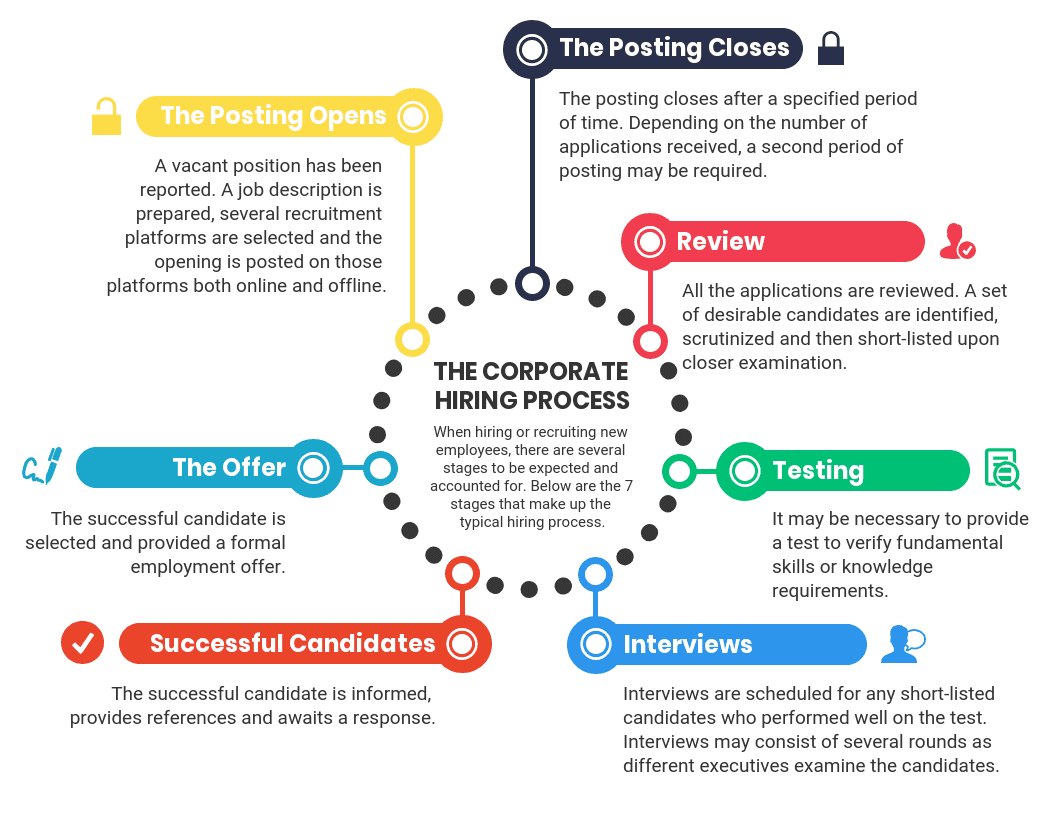
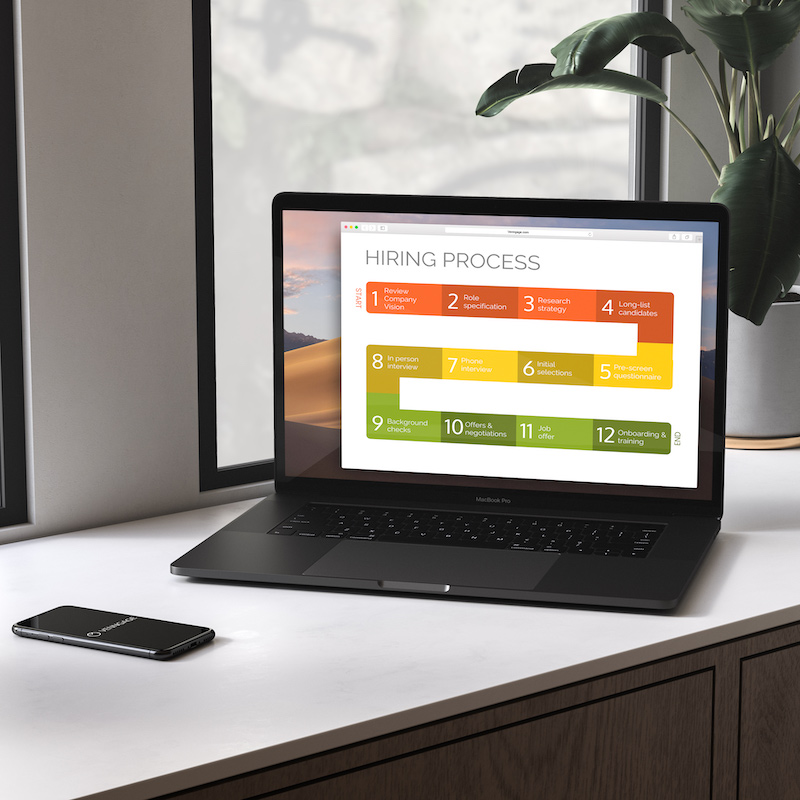
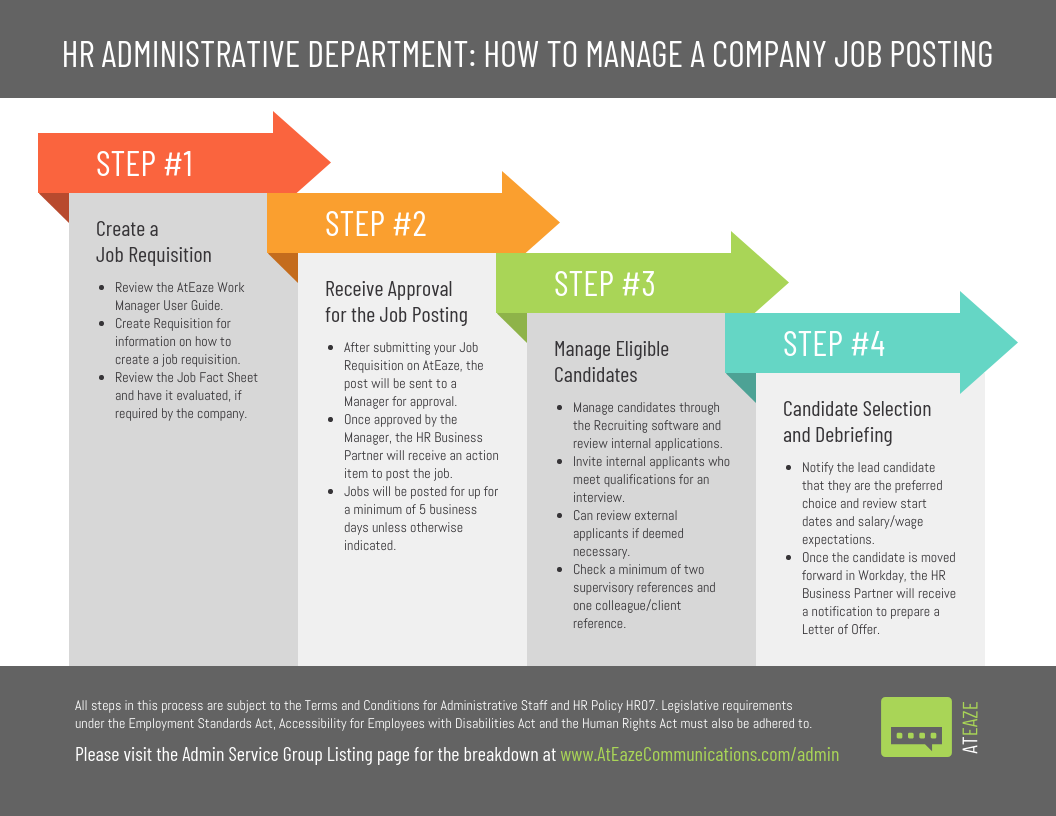
In addition to using icons on their own, you can also combine icons to create your own custom illustrations. Take this job hiring process infographic template, for example, which uses icon illustrations to visualize what each phase of the process entails:
If you don’t have to resources to hire a graphic designer, you might be at a loss for how you can create your own illustrations.
That’s where icons can be a lifesaver. Simply search for icons depicting the different pieces of the scene you have in mind. Then, arrange them into a scene the way you would arrange pieces of a collage.
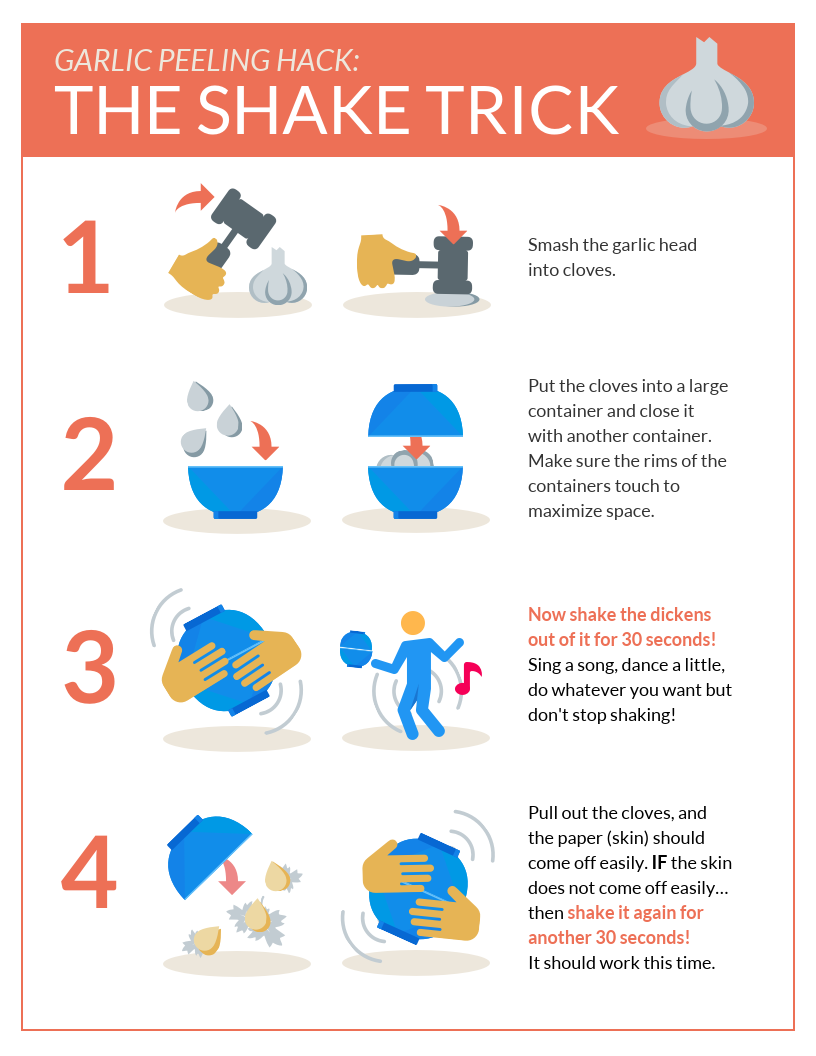
For example, look at how convincing the illustrations are in this hack infographic:
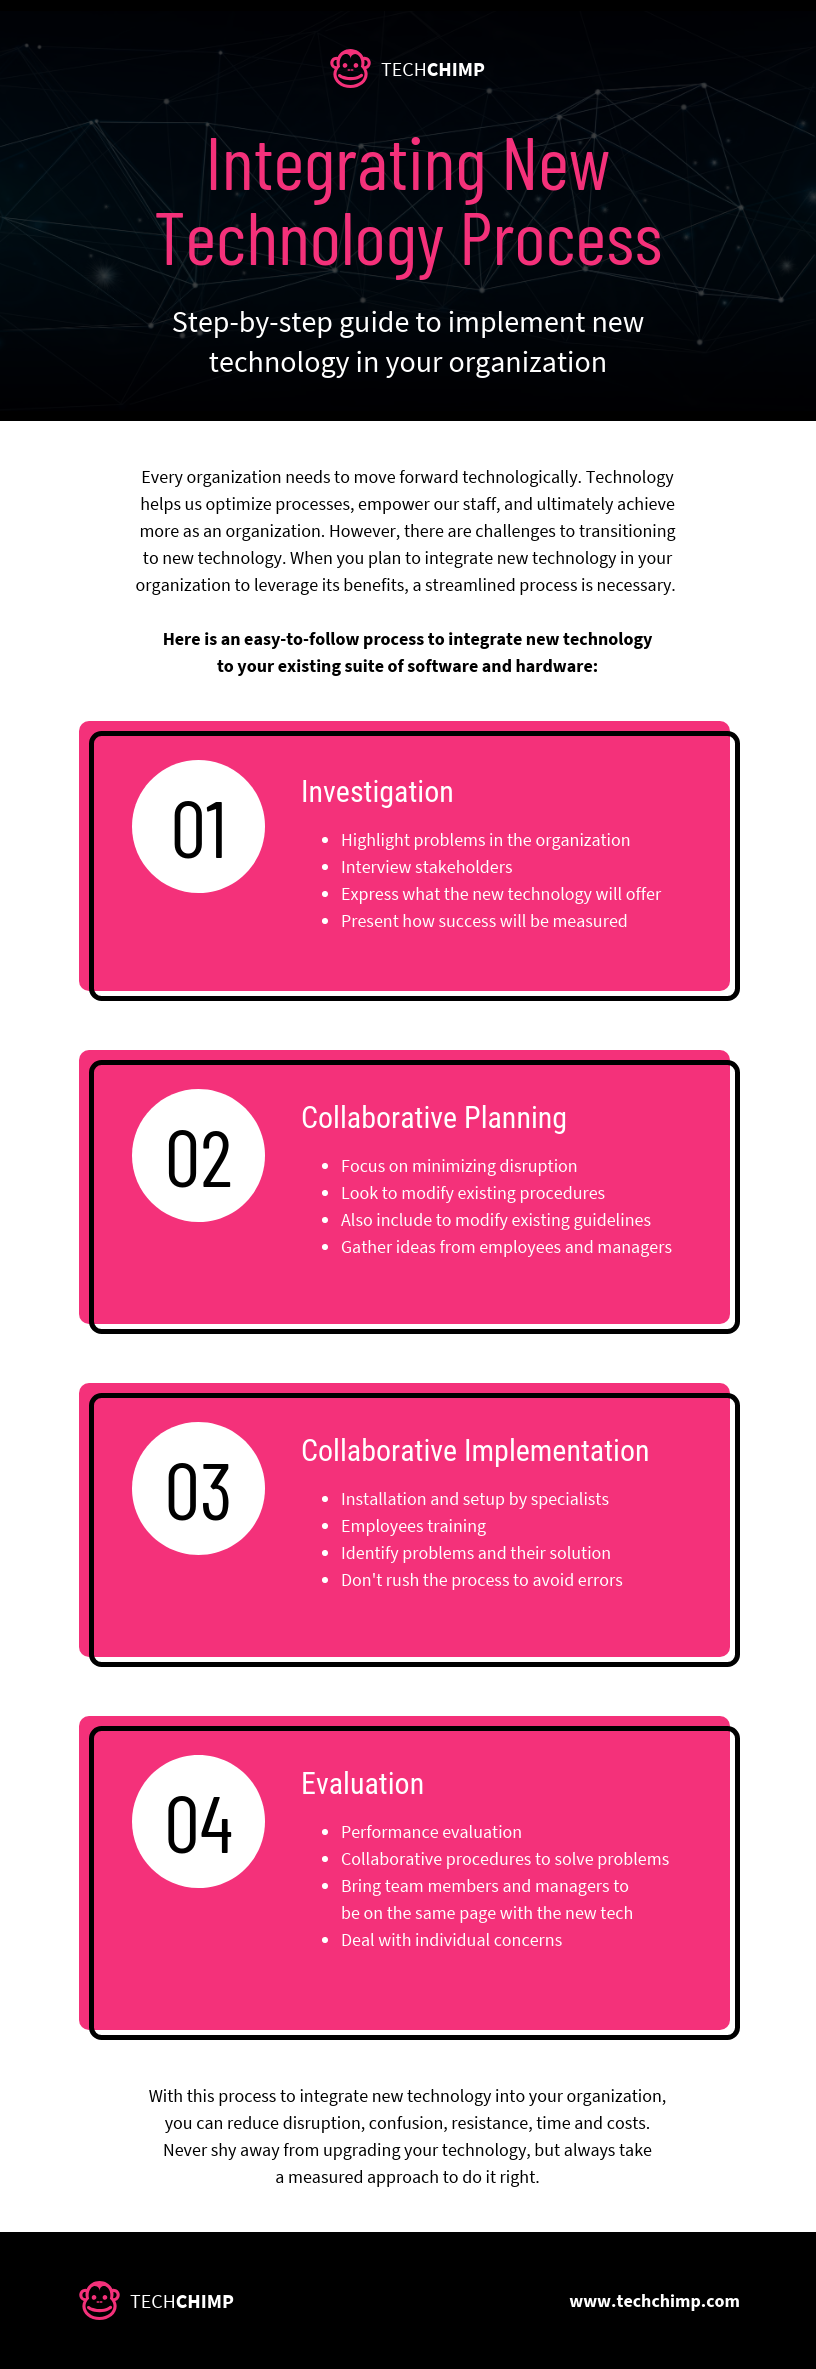
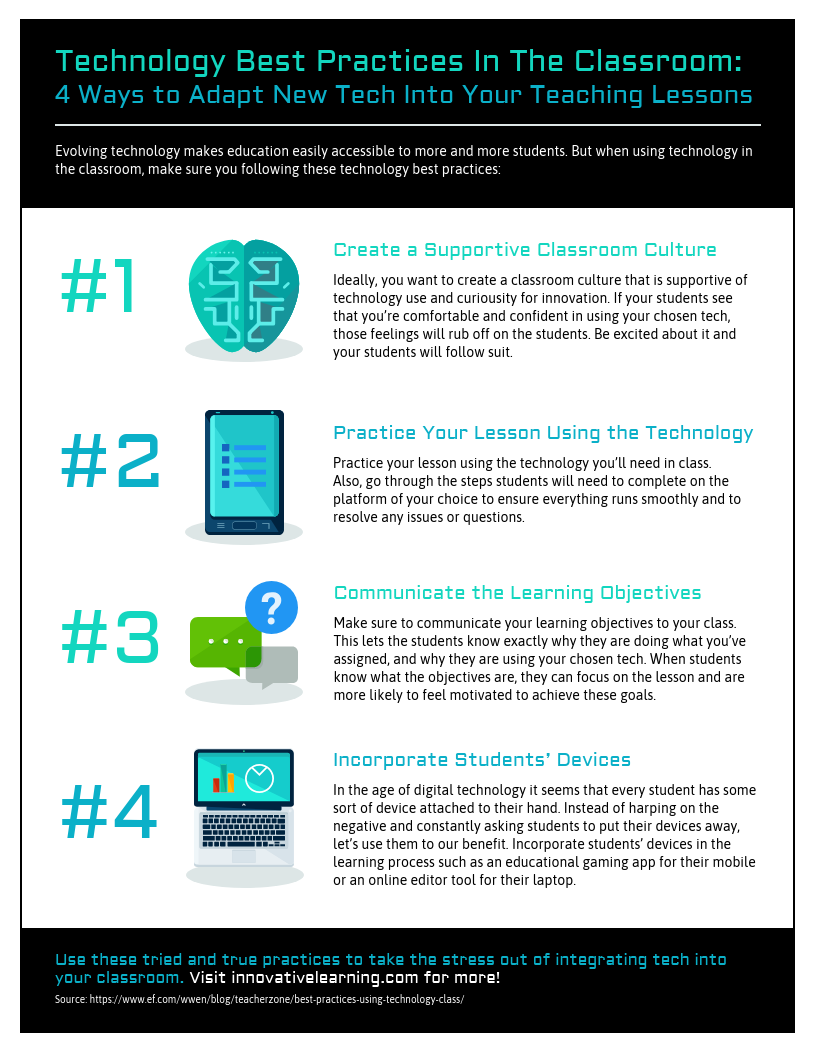
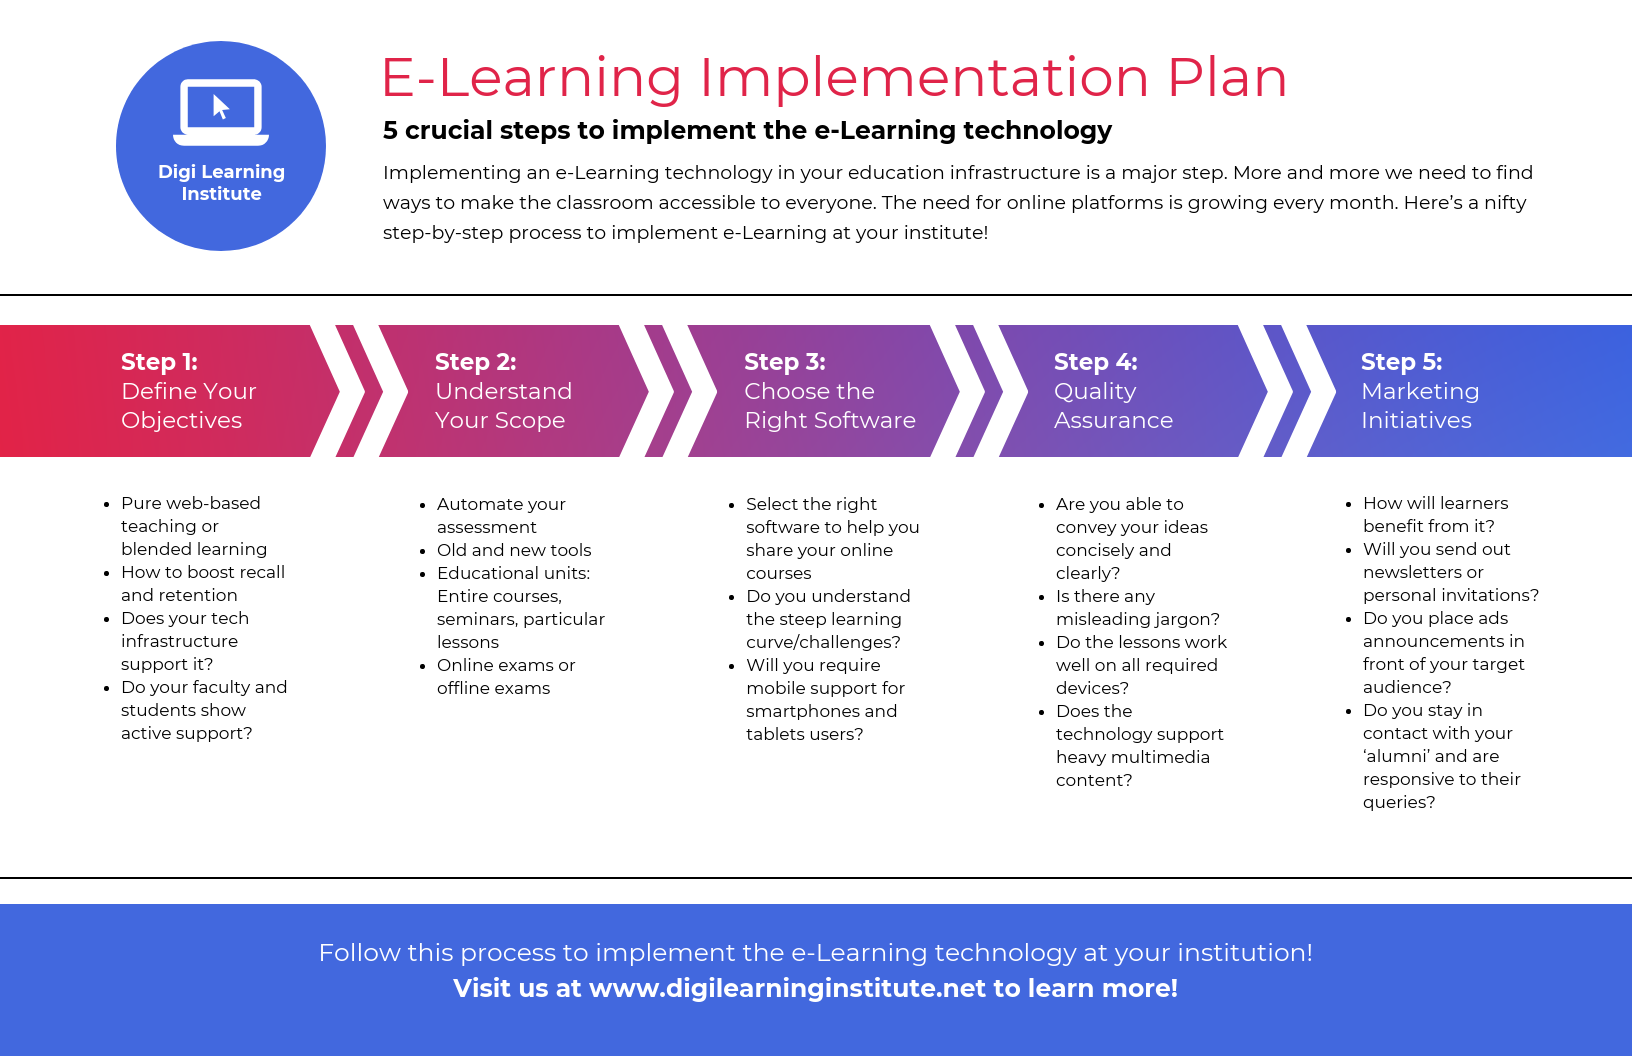
This process infographic highlights the best technology practices in the classroom. The 3D looking icons jump off the infographic and grab your attention before anything else:
Looking to visualize your sales strategy or pipeline? Check out these sales infographic examples to see how teams turn complex sales processes into clear, engaging visuals.
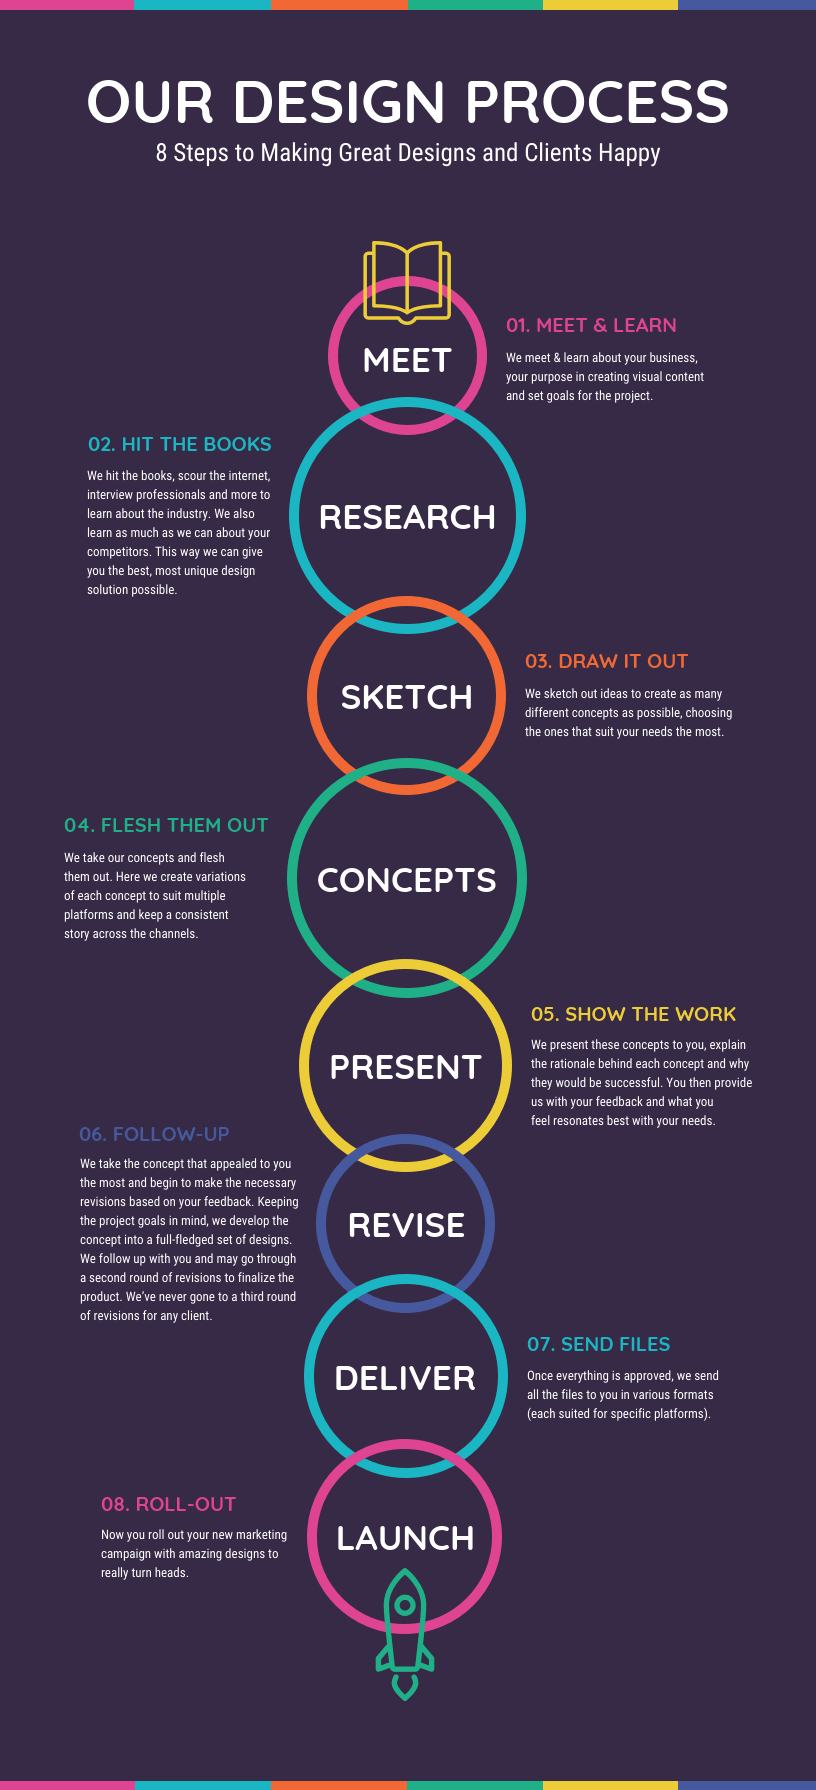
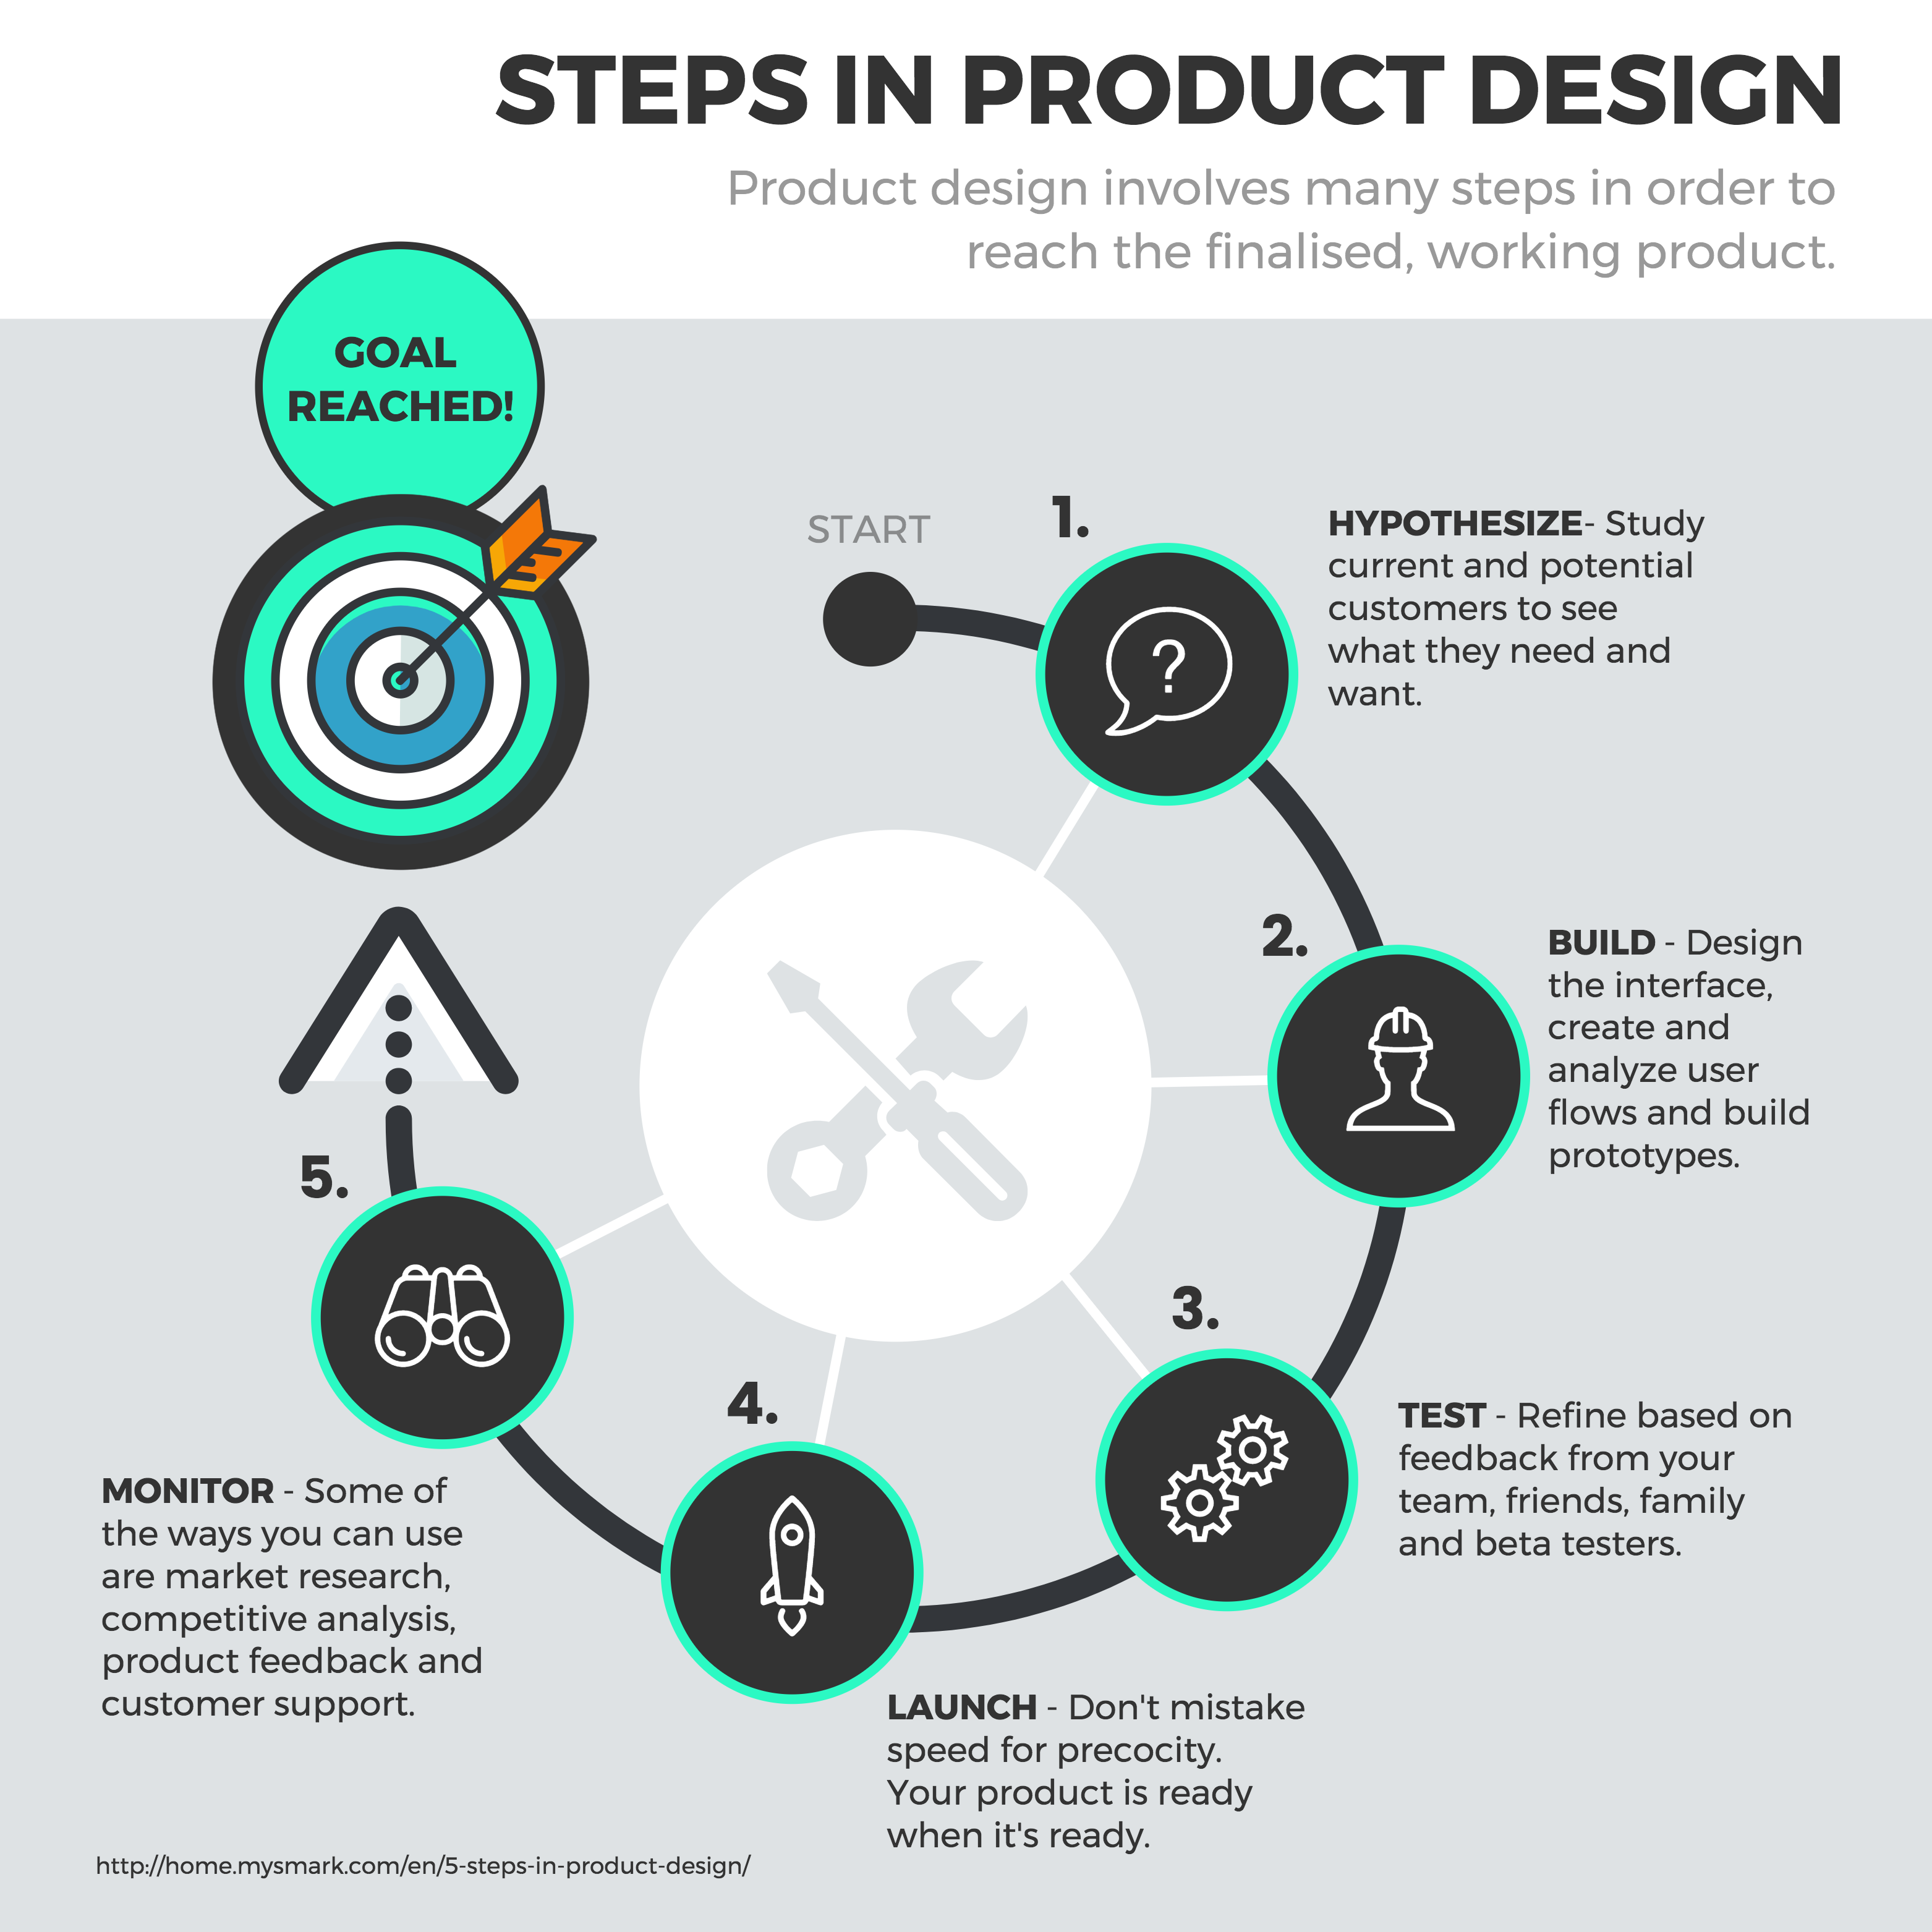
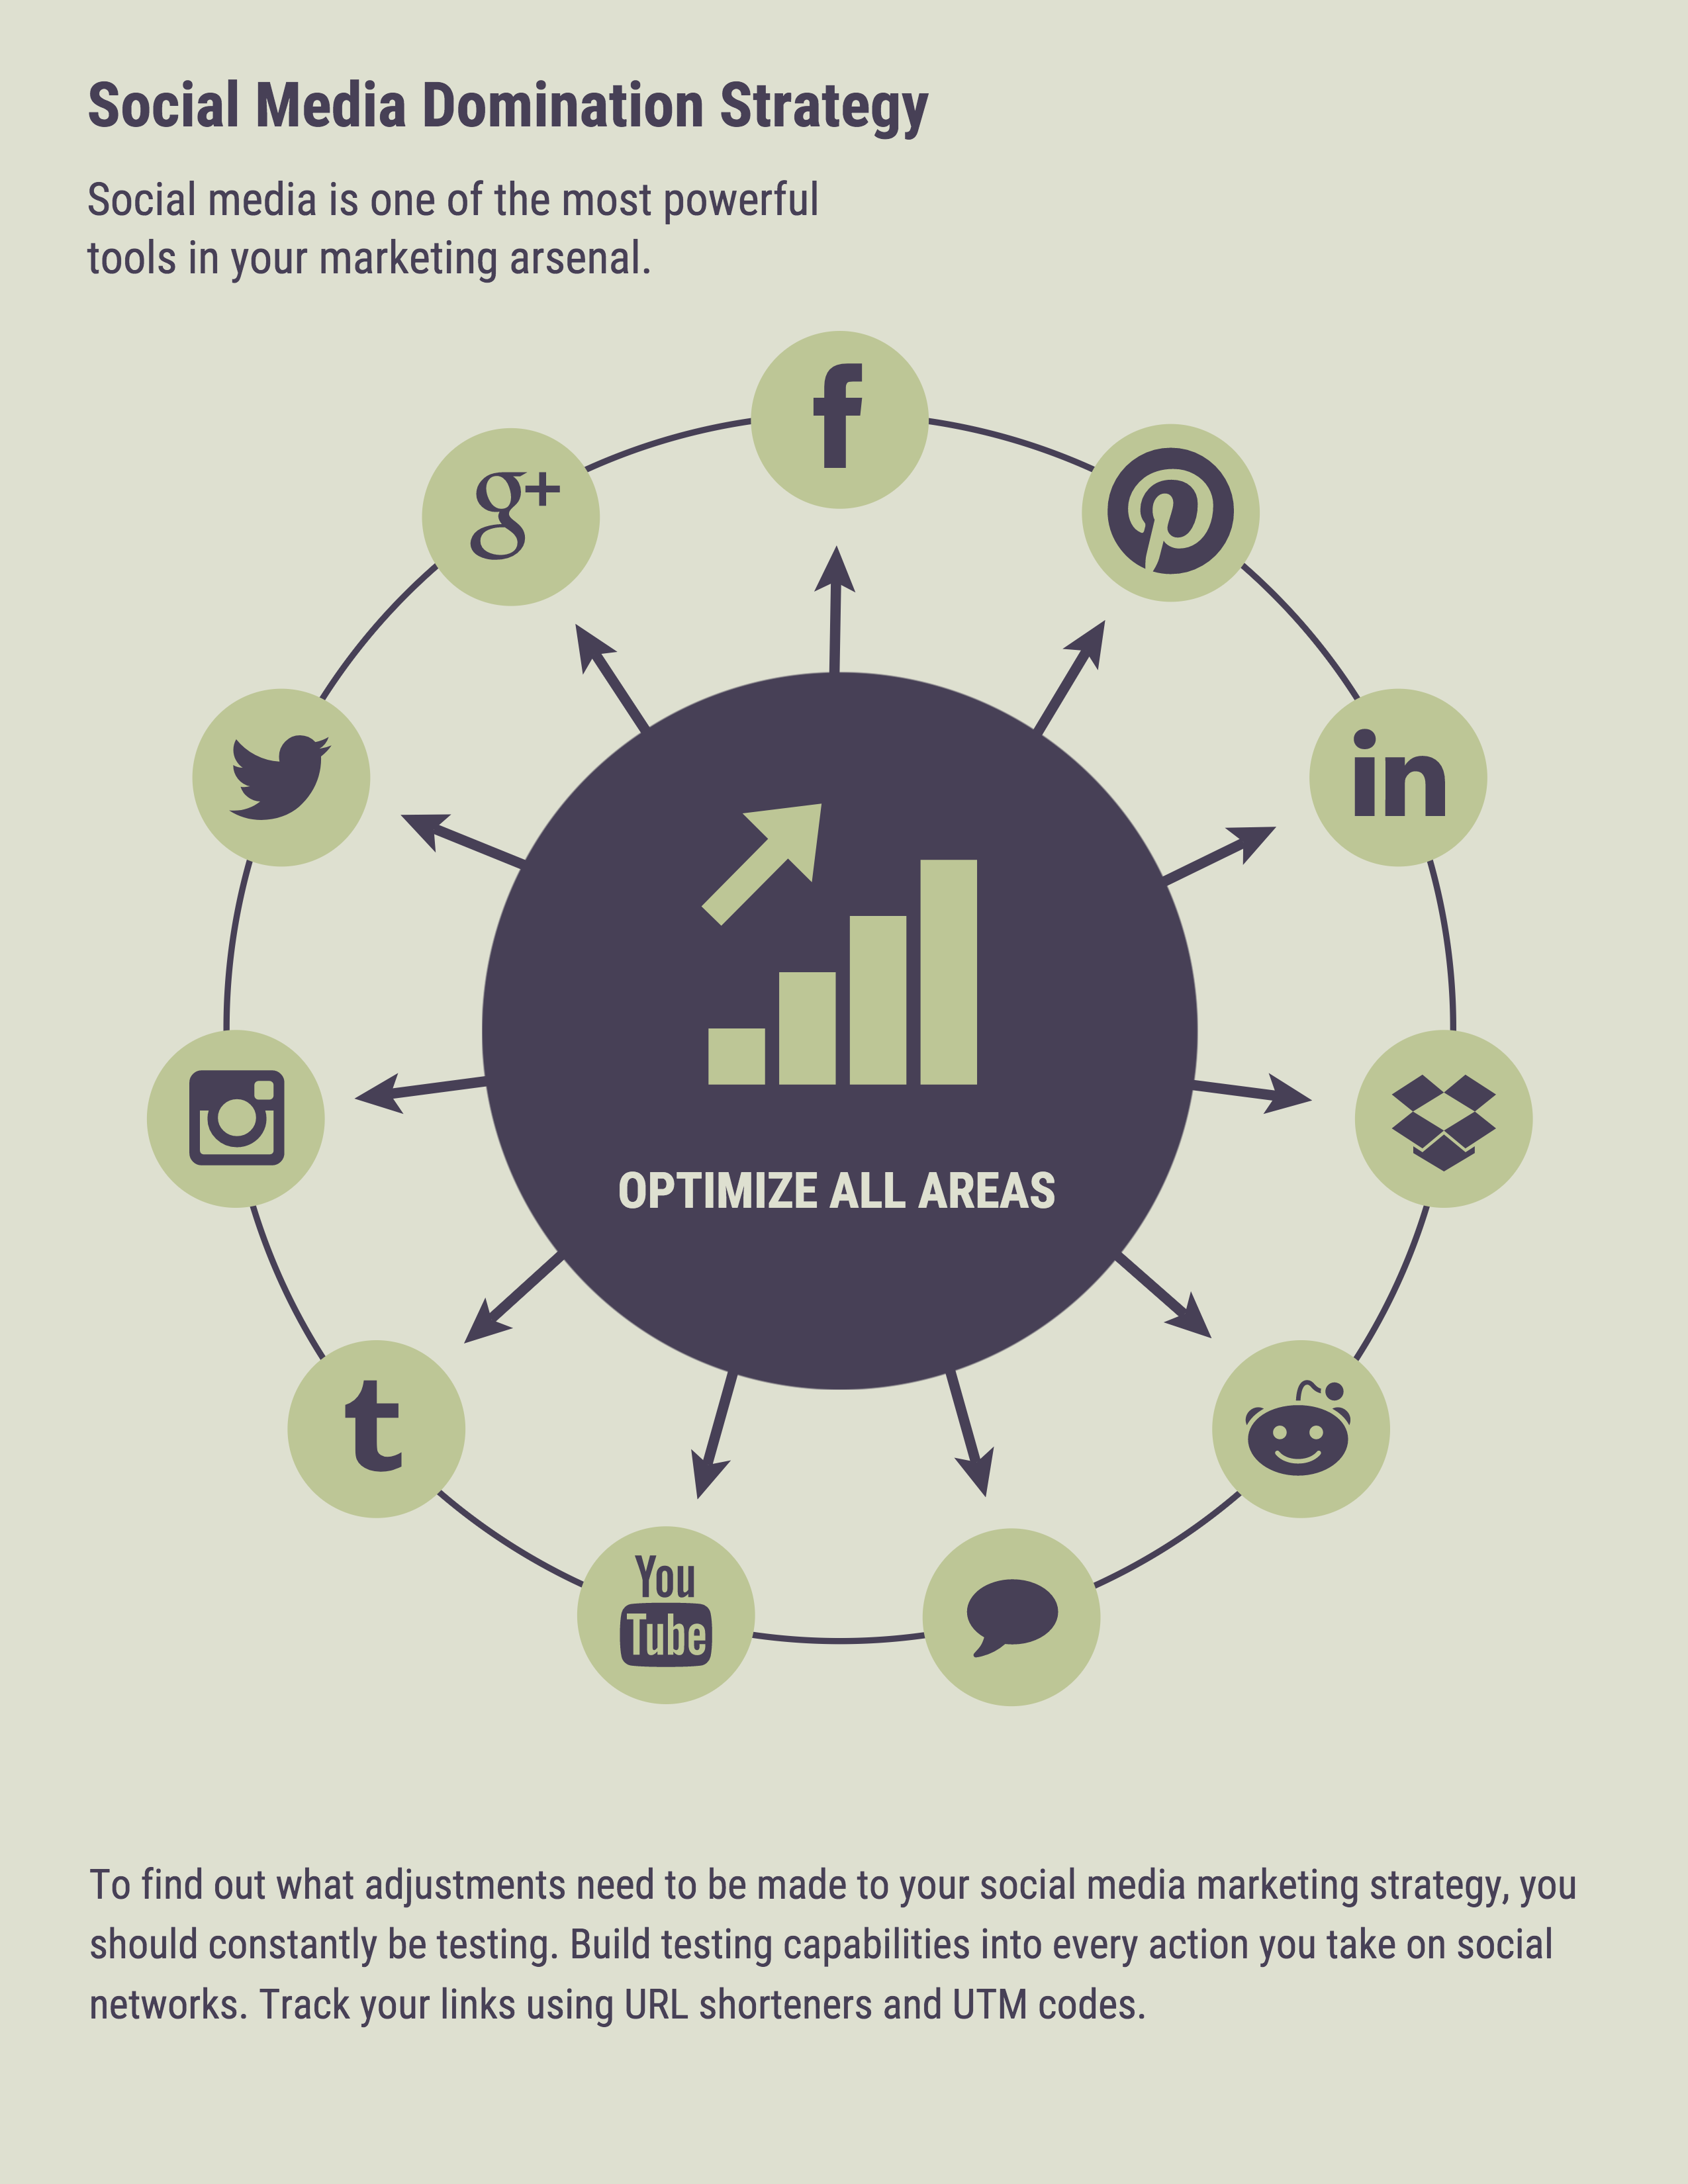
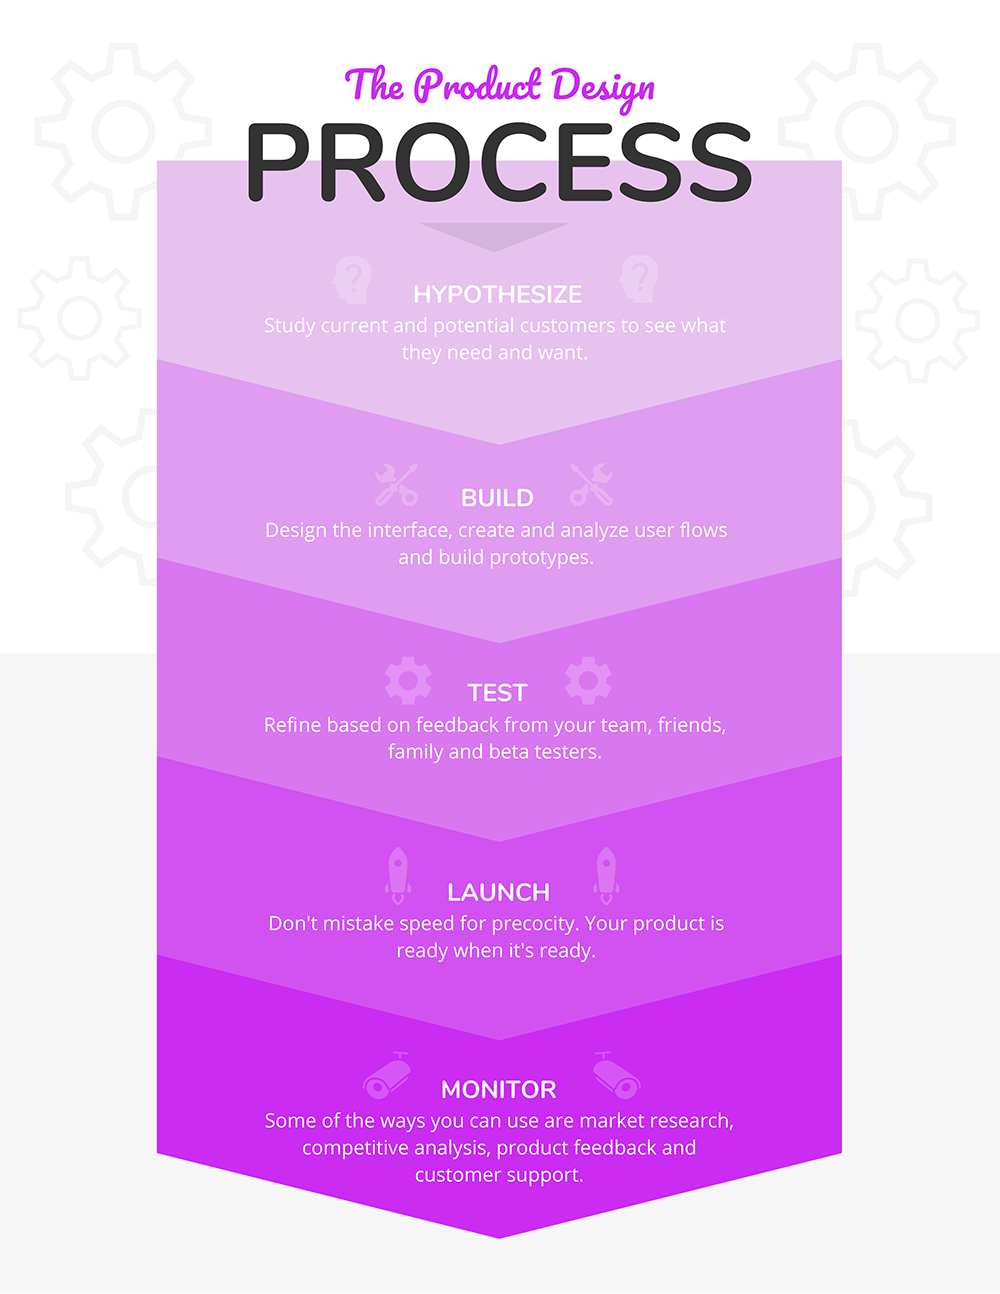
3. Use a circle layout to show a cyclical process
If you have a process that repeats, or one that involves regular iteration and improvement, then a circle infographic layout can work well. Clearly indicate where the “starting” point it and use numbered steps or arrows to indicate that direction the process follows.
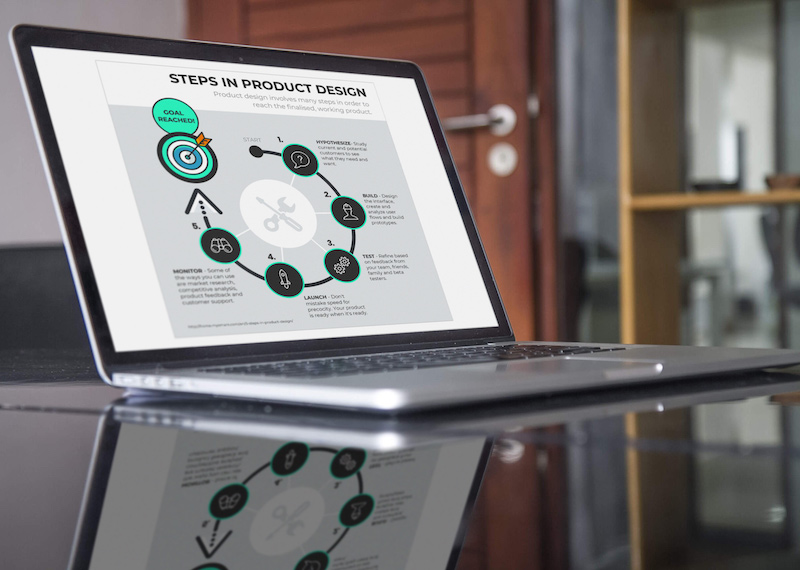
For example, take a look at this circular process infographic template for product design:
If your process is more of a chicken-and-egg situation, then a circle with no break makes more sense. Take a look at how this cyclical process infographic template uses different colors to help each step stand out on its own:
This process infographic template is another example of using circles as a guide for your clients:
4. Save space in your process infographic template by using an S-shaped layout
You only have so much space on your page. A hack for fitting more steps into one infographic is to use an S-shaped layout (you could also call this a road layout or a snake layout).
The S layout in this process infographic template looks like a winding road. Perfect for visualizing a customer journey:
Click the template above to enter our online customer journey map maker. Customize the template to your liking–no design experience required.
5. Incorporate images to visualize your process
While icons are awesome visuals to include in your infographics, sometimes they aren’t quite realistic enough. That’s why you may want to include more realistic images to illustrate important information.
To incorporate images into your design, look for images that have a transparent background. That way, the background of the image won’t stick out from the background of your infographic.
If an image you want to use doesn’t have a transparent background, you can incorporate it into you design by using a border around the image or an image frame.
For example, this recipe infographic uses images to illustrate what each of the ingredients are:
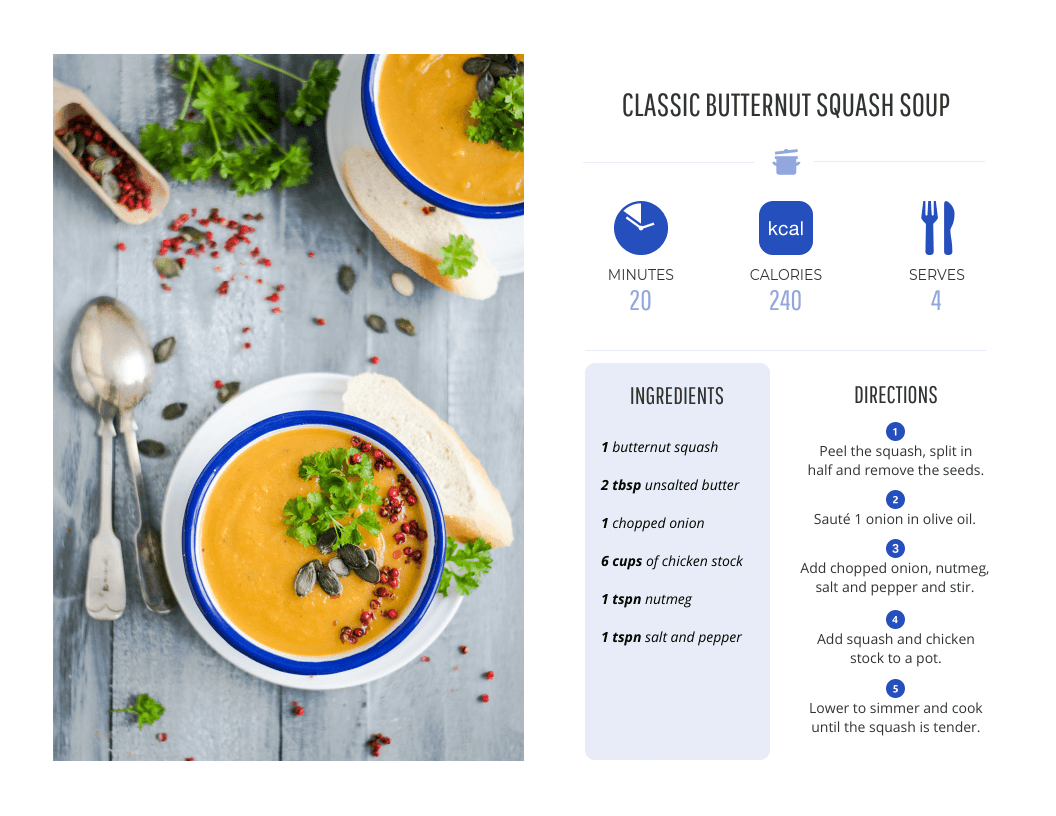
It’s also useful to include a picture of the results of your process. Here’s another example of a recipe infographic, this time with a shot of the finished dish:
But this tip doesn’t just have to apply to a recipe. You could include a a mock-up of a finished product or an image of a picture depicting your goals being hit.
This process infographic uses stock photos to help stress its points:
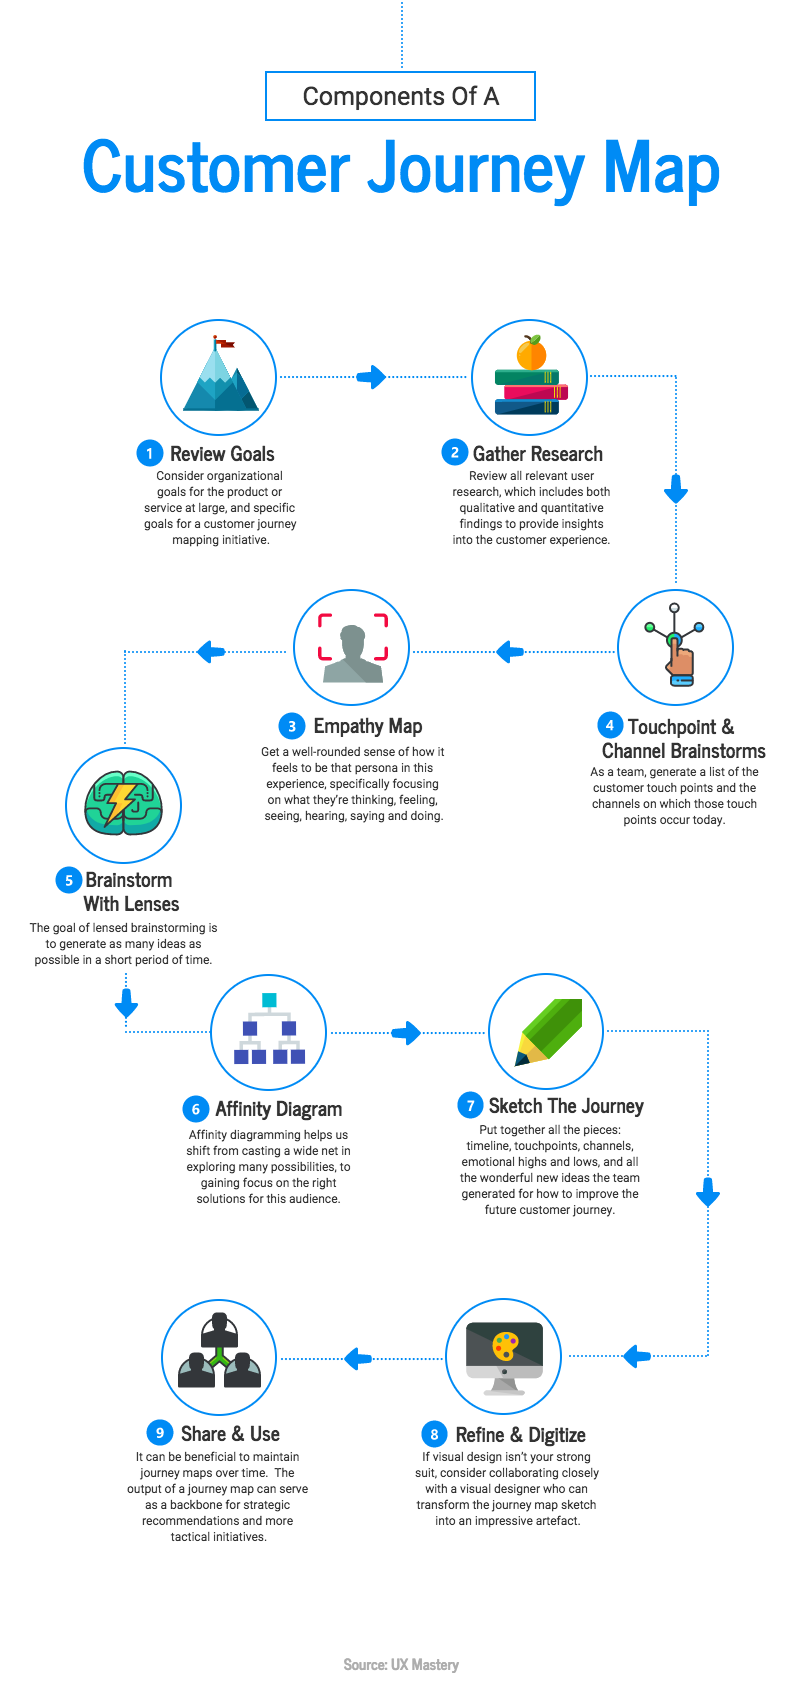
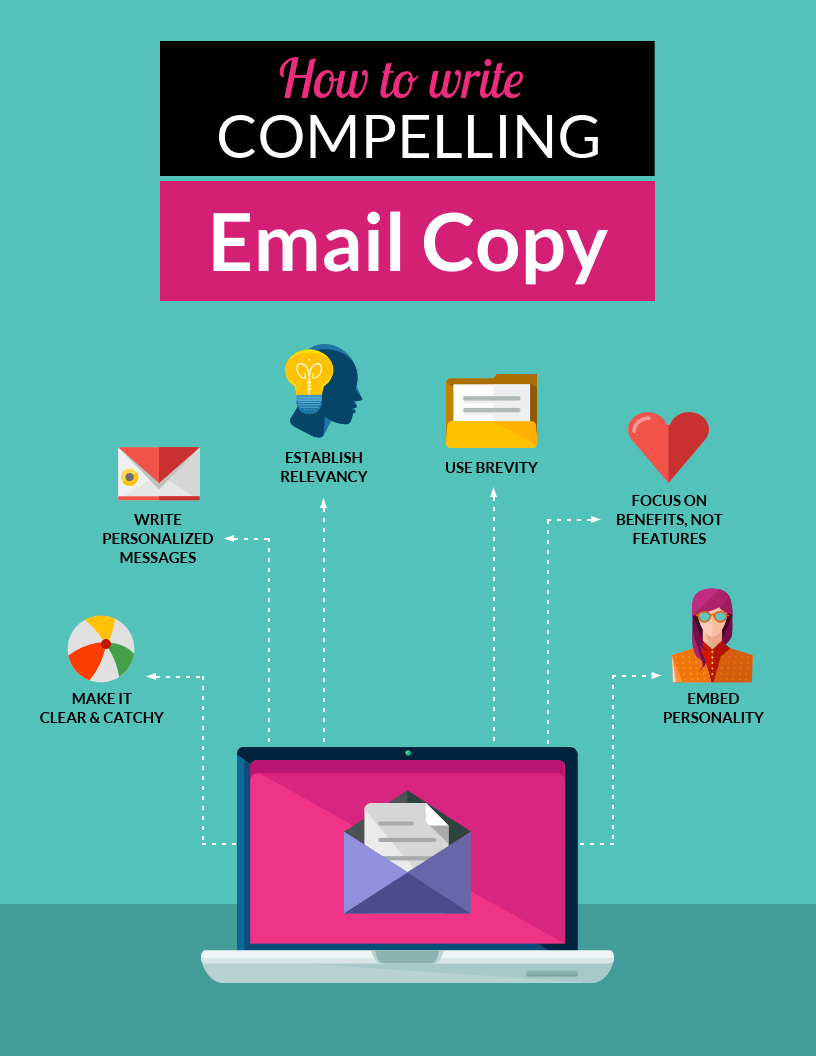
6. Create a mind map for processes that don’t follow a specific order
A mind map connects ideas and shows where different ideas branch out.
Maybe you want to show a broad overview of a process. Or maybe the process you’re visualizing doesn’t follow a specific order. In both cases, a mind map can show readers options for steps they can take. (Plus, Venngage makes it easy to create a mind map in a pinch).
For example, this social media marketing infographic template shows multiple options you could tackle first. A brief description under the mind map offers some important contextual information:
A mind map infographic is also a great way to share key information that readers should keep top-of-mind as they carry out a process. For example, this infographic visualizes six important tips for writing compelling emails:
If you’re looking to break down a more linear or sequential process, you might also find a step infographic helpful. It’s a great way to visualize workflows or instructions that follow a clear order from start to finish.
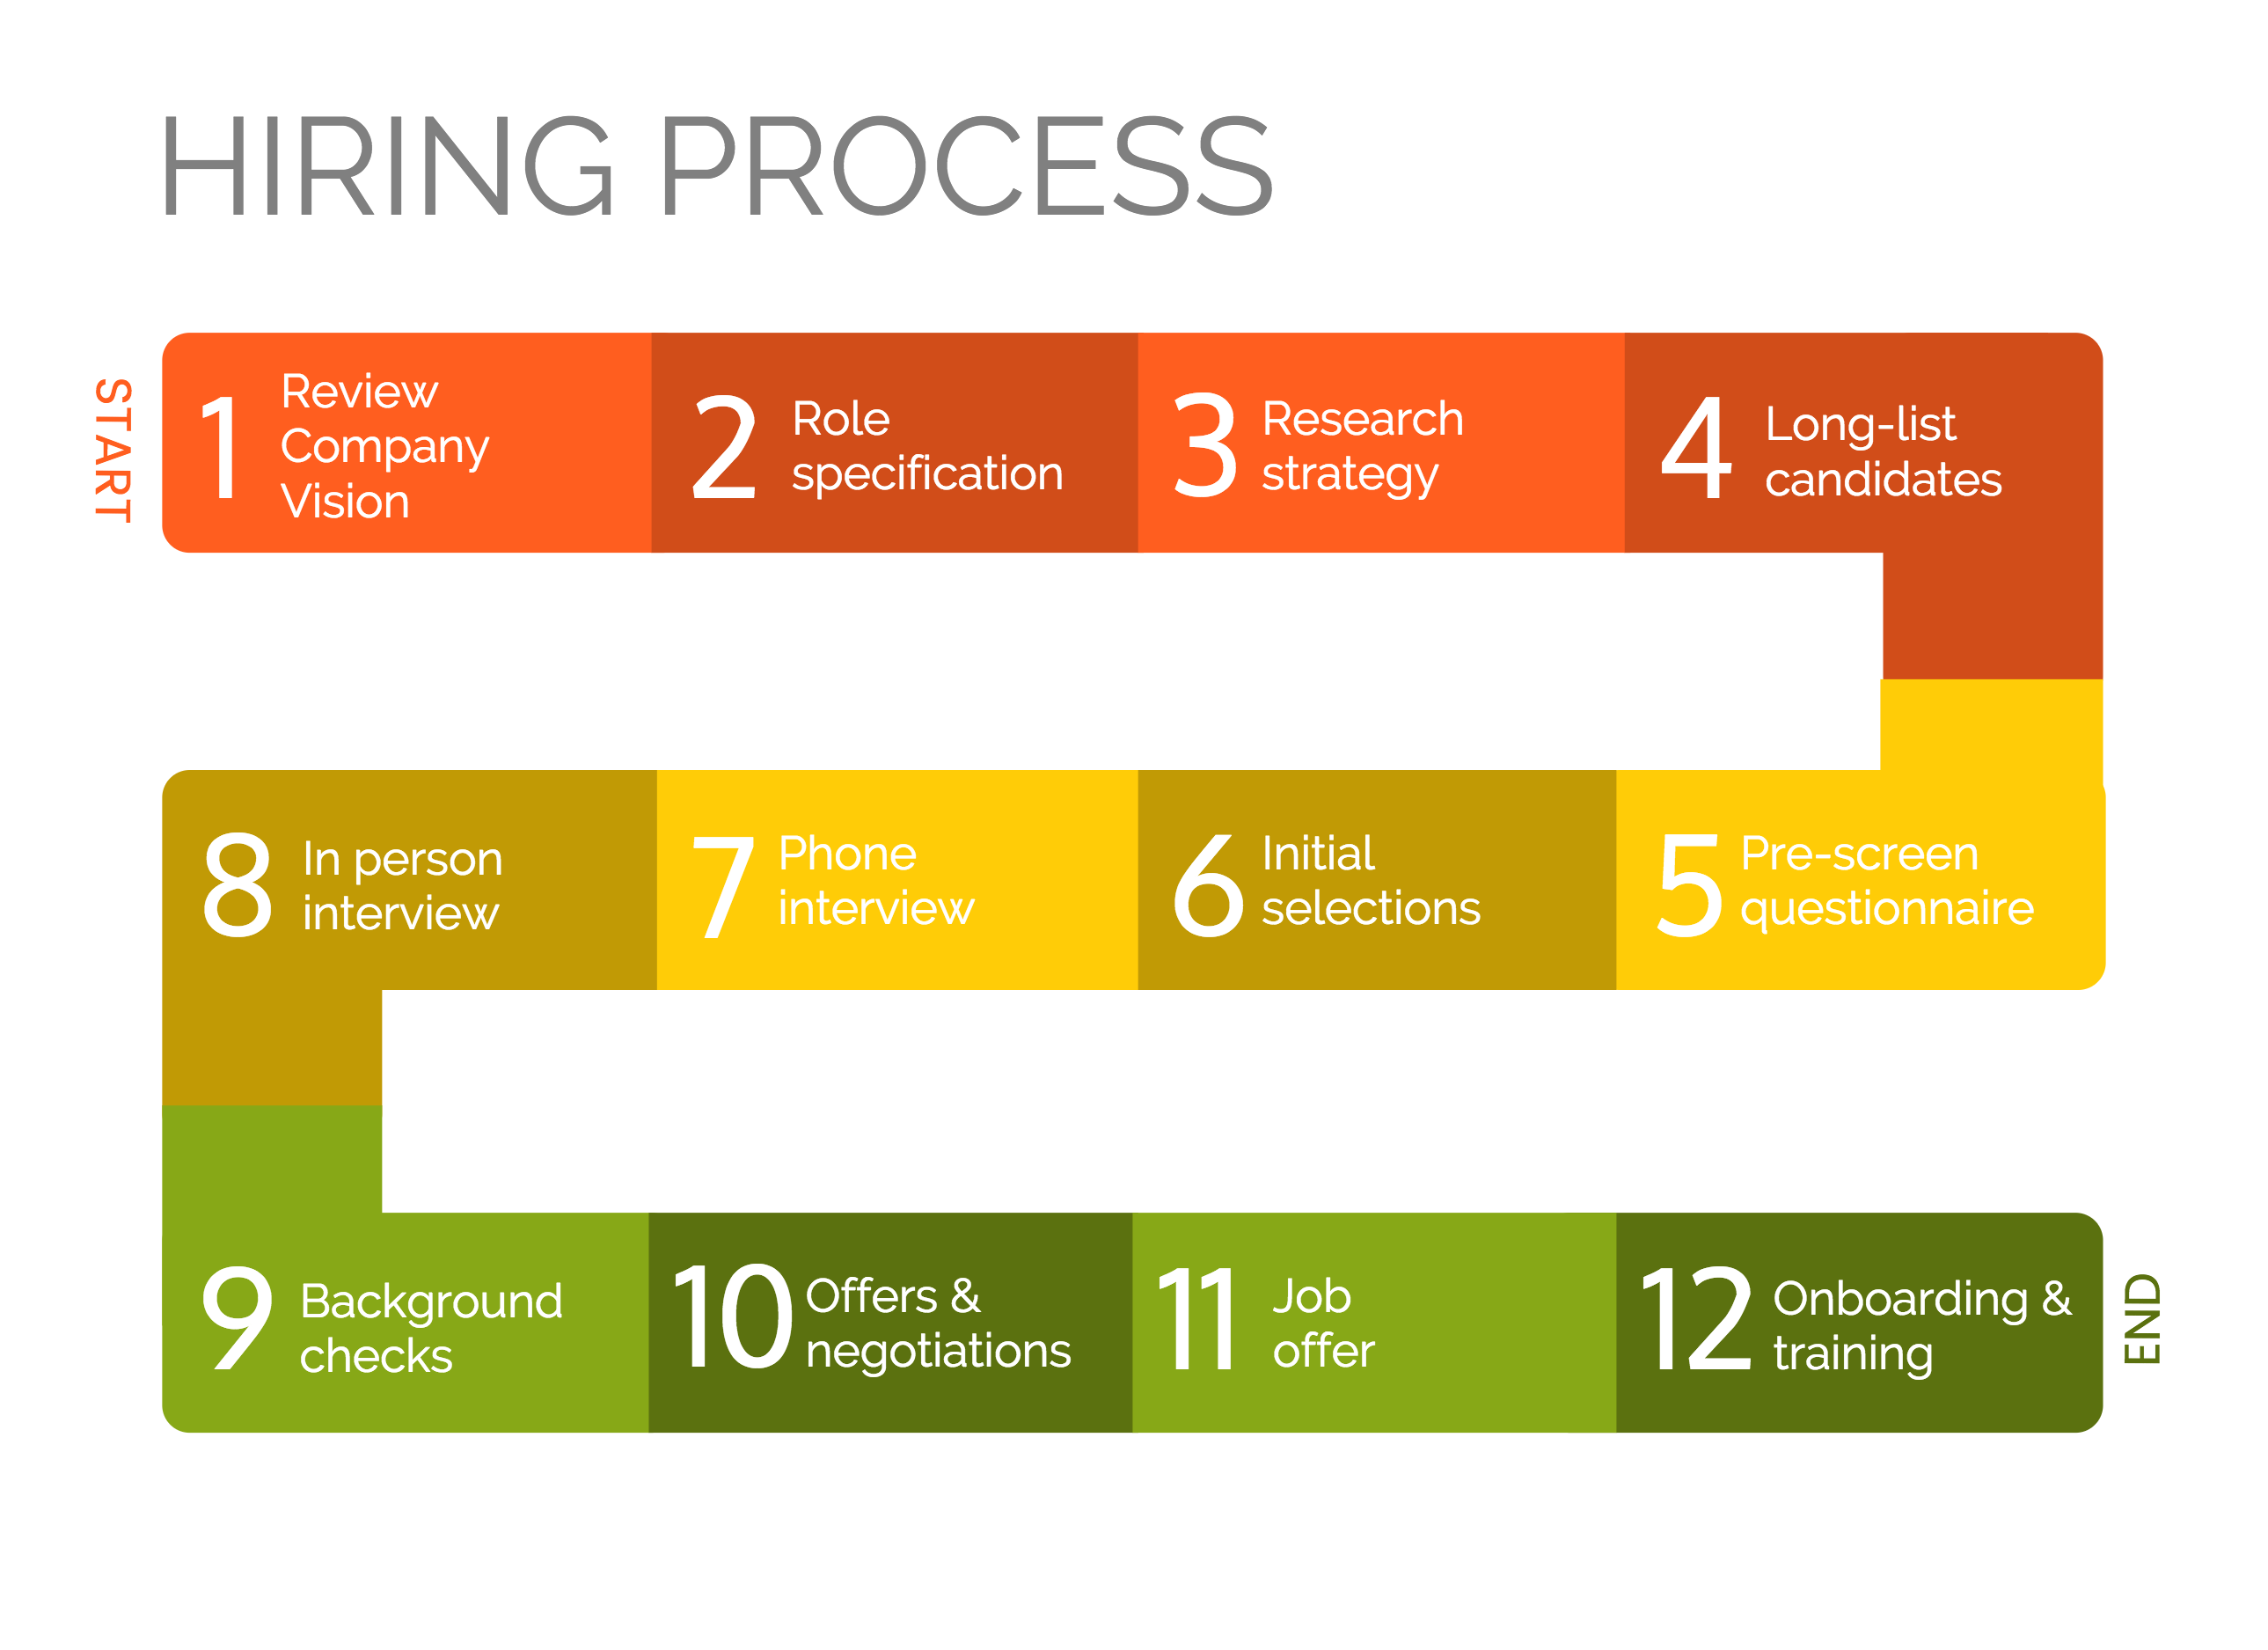
7. Color code phases of your process
When it comes to visualizing information, your color choices should be about more than just looking nice. You should think about how colors can make information easier to understand.
For example, you can color code different phases or steps in your process. This will help make your process easier to follow, and will show how particular steps are grouped together.
For example, this hiring process infographic template uses different colors to sort the process into three sections:
You could also customize the above template to visualize your company’s employee onboarding process.
Using bright colors to brighten an otherwise boring process is a good way to highlight each step of a process. This hiring process infographic is grey but uses color to bring out each step to draw your attention:
Here’s another example of color coding steps in a process:
8. Pick fonts that reflect the theme of your process infographic
The fonts you choose can affect how the information in your infographic is perceived. Certain fonts look more old fashioned, like serif fonts or script fonts. Meanwhile, certain fonts look more modern and forward-thinking.
Think about who the audience of your infographic will be, and what mood you want your infographic to convey.
For example, are you visualizing a process for your customers? In that case, you may want to use a font that looks friendly and approachable. Or perhaps you want to use a more traditional font to show that your company is reliable.
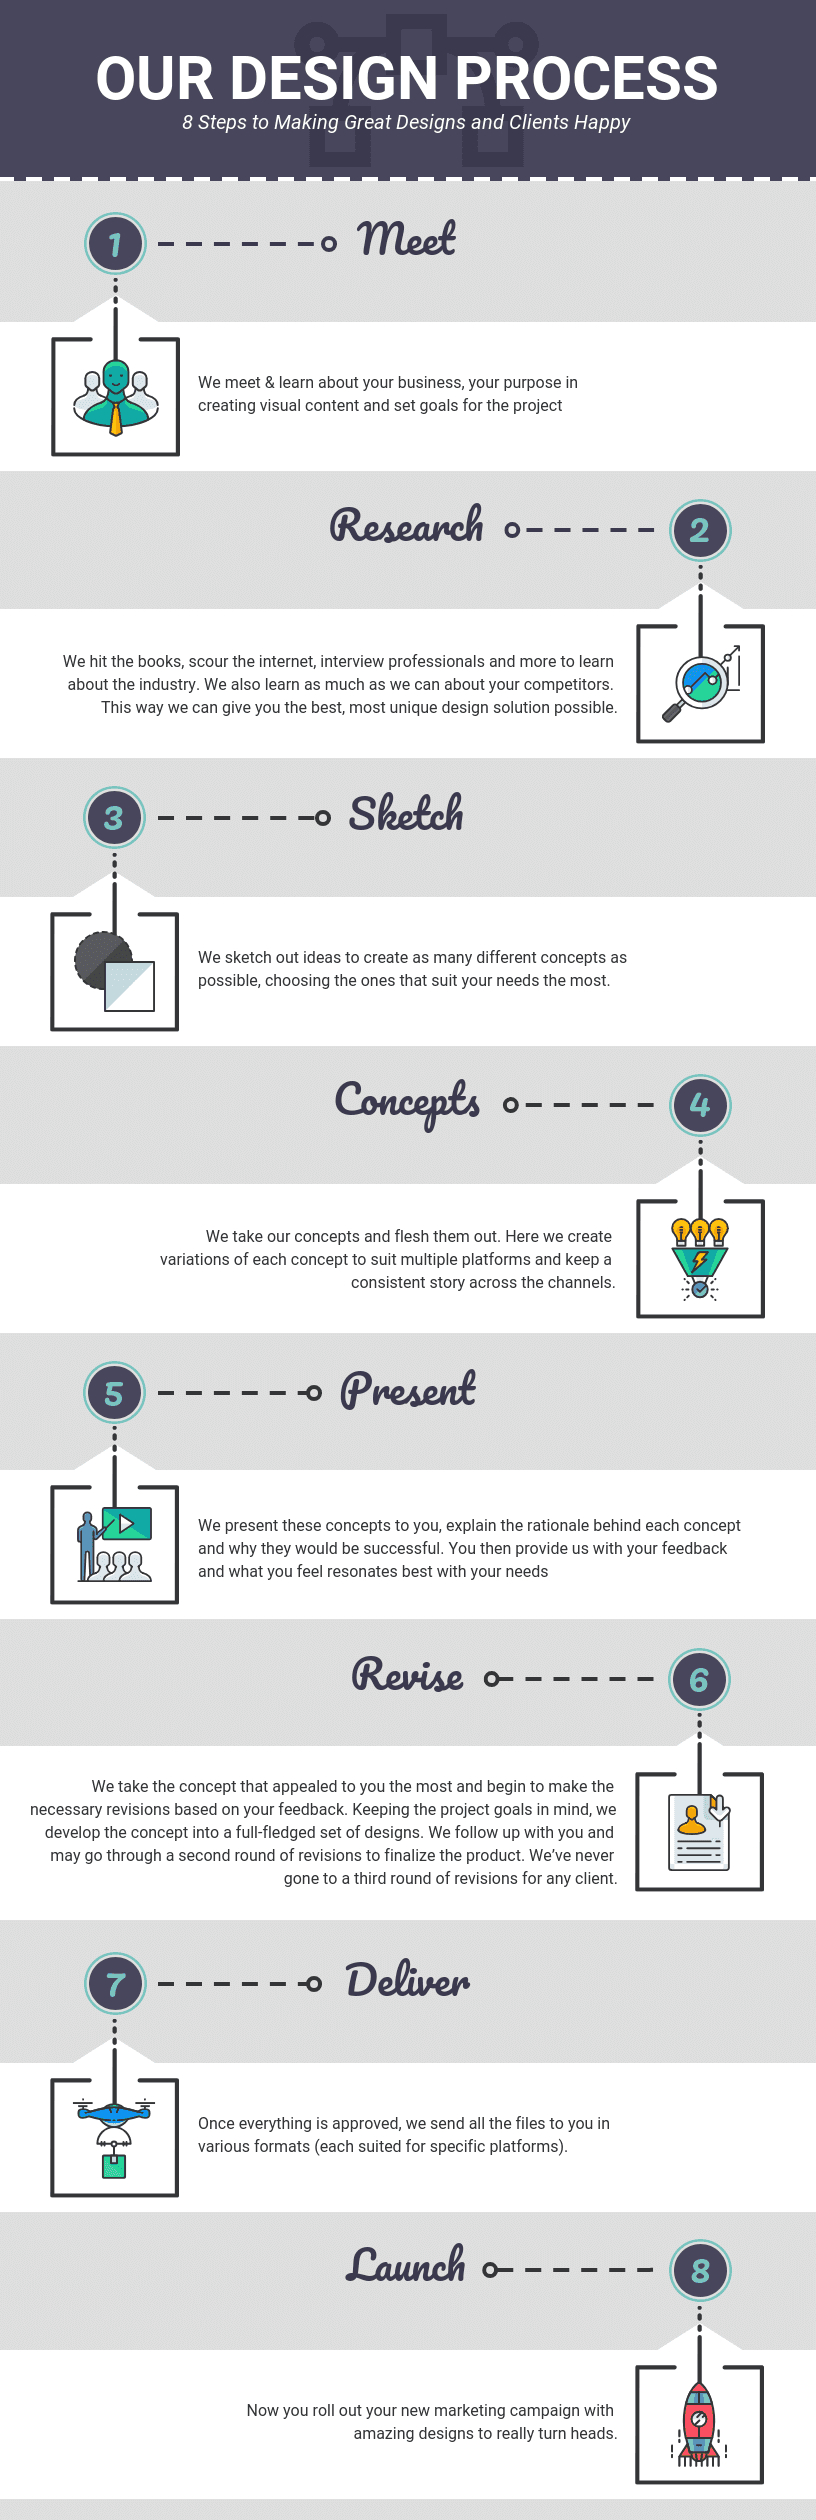
The header font for each step in this design process infographic template is friendly and a bit playful. In this case, this reflects the idea of making clients happy:
This infographic looks more innovative and technical, doesn’t it?
9. Use arrows to give your process infographic template flow
In design, visual cues are things like arrows, images of fingers pointing, or images where someone is looking in a specific direction. Visual cues help to direct how people read your infographic.
When designing your process infographic, think about how you want your information to flow on the page. You can create flow by connecting steps in a process with a line, or by using arrows to point readers towards the next step.
Take a look at how arrows help the information in this process infographic flow:
The arrows used in this process infographic guides your eyes visually without needing to read the information, the text is used adds details to the information:
Here’s another example of an infographic that uses arrows. The arrows make it possible for the steps to jump back and forth across the page while still making sense:
Or, for a more subtle approach, you could incorporate an arrow shape into your section backgrounds. Like in this process infographic template, where each section “points” to the next:
Another subtle example of arrows being used to guide the eyes is with this e-learning infographic:
10. Use a flow chart to visualize a workflow or a process with multiple paths
Here’s an example of a simplified process flow chart for inbound marketing:
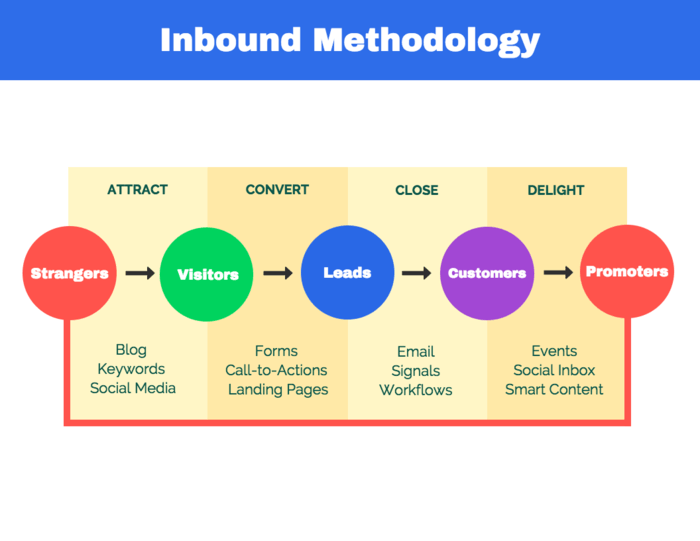
A flow chart can make processes with multiple paths and supporting processes easier to follow. They’re also handy for simplifying content approval workflows and breaking complex processes down into steps.
Typically, a flow chart uses a box (or other shape) to visualize a step in a process, with lines or arrows pointing to the next step.
11. Create an infographic that lists the tools needed for a process
Infographics make for great cheat sheets. Why not also create an infographic to remind readers about tools they will need to successfully see a process through?
A simple list infographic layout works well for this. You can use icons or images to illustrate each tool, to help eliminate confusion. Here’s one example:
Here’s another beginner-friendly infographic template you can use to show a list. Here’s a creative design hack: use icons in the place of bullet points:

How to use a process infographic template:
- Click the infographic template that fits the process you want to visualize. Some templates are free, some require a small fee to use.
- You’ll enter our Process Infographics Maker, an online drag and drop tool that’s perfect for design newbies.
- Add, remove, and rearrange steps in the infographic.
- Paste your own text and import your own images into the infographic.
- Customize the colors, fonts and icons to make the infographic design your own.
Here’s a sneak peak of what the Venngage infographic editor looks like:

Can I use an Eisenhower matrix as a type of process infographic?
Yes! The Eisenhower Matrix is a great example of a process infographic. It visually guides users through a prioritization framework by sorting tasks into four actionable categories: Do First, Schedule, Delegate and Eliminate.
It’s especially useful for simplifying decision-making and helping teams understand what to focus on and what to drop. If your goal is to show a clear, repeatable workflow for handling tasks or requests, the Eisenhower Matrix fits perfectly.
Process infographic templates
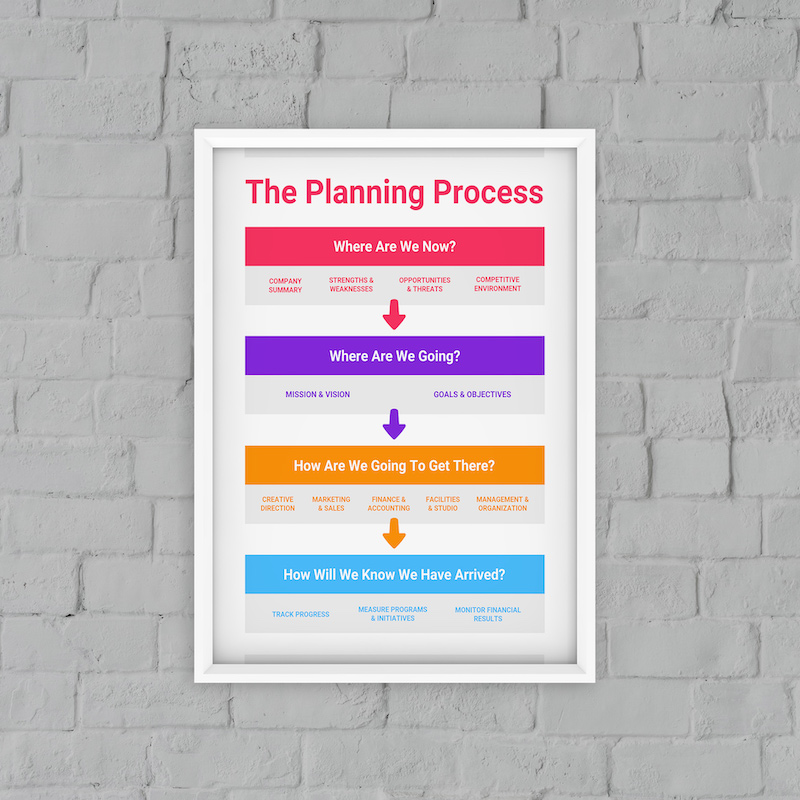
If you’re working within a tight design budget–and you don’t have much design experience yourself–designing an infographic might seem kind of intimidating.
That’s why it’s a good idea to start with a process infographic template, like this one:
More infographic design guides for your everyday needs:


