


Sales infographics are great tools for training up your sales team, supporting their sales efforts and keeping them up-to-speed on trends in the industry.
While reading every book, journal and article on sales can be time-consuming (and very impractical), sales infographics help convey a ton of valuable information in minutes. Sales infographics are easy-to-understand, accessible pieces of content that can be used for training, reinforcing knowledge, sharing data and even motivating your sales team.
They’re the perfect solution for a busy, industrious sales team to learn and execute quickly and effectively. This post is a collection of engaging sales infographic templates that you can customize, along with examples to inspire your work.
Not a designer? No problem. Our professional sales infographic templates and free Infographic Maker make it simple to create impressive visual content.
Click to jump ahead:
- 8-step sales infographic template
- Sales process infographic template
- Guide sales infographic template
- SOCO Framework sales infographic example
- Zendesk sales statistics infographic example
- Drift sales statistics infographic example
- Sales funnel infographic template
- Techniques for sales infographic template
- Marketing and sales infographic template
- High-performance sales infographic templates
- Social media sales infographic templates
- Sales infographics FAQ
1. 8-step sales infographic template

Sitting through a training video or reading countless pages on sales processes is not exciting. When something doesn’t engage us, it’s also far less memorable.
This sales process infographic template is perfect for a detailed, multi-step process. Customize it by swapping in your own sales process content, incorporate new icons from our icon library and change the color palette to suit your brand. The alternating layout makes it easy to read something that’s detailed and lengthy.
With My Brand Kit, you can incorporate your company logo, brand colors and brand fonts with a click (paid plans only).
Related: 20+ Business Infographic Examples
2. Sales process infographic template

When there are winning approaches to sales, help your team adopt them quickly. This sales process infographic template breaks down how to approach sales effectively and drive results.
This sales process infographic template is not very wordy, but heavy on visuals. Pairing illustrated icons with key takeaways will help your team retain key information for longer. When you customize it, aim to follow a similar layout.
What I like about this sales process infographic template is the addition of relevant statistics at the end, to help readers understand there is a science to the method. It’s a great section to include some relevant statistics, data or other insights around sales tactics.
Related: 25+ Statistical Infographic Templates to Help Visualize Your Data
3. Guide sales infographic template

Understanding the bigger picture in any profession or industry is vital for high performers. A sales mind map or diagram can help visualize larger processes or structures in place, ensuring that your salespeople can operate where and how they’re most effective.
This template is a customizable diagram that you can use as a process or flow chart to visualize varying activities and how they all fit together. Like other templates, you can incorporate your branding, swap in new icons and add more sections to make it your own with our simple drag-and-drop online editor.
4. SOCO Framework sales infographic example

I love this sales infographic design from SOCO for two reasons. One, because the colors make it vibrant and stand out. Two, because it focuses on something simple but still communicates it in a way that is loud and clear.
The same content could be missed in a blog post, or forgotten during a training video. But this visual is attractive, it can be easily referenced, and you can even print it off if needed.
Things don’t need to be complex to need an infographic. They can simply be valuable pieces of information that would be beneficial from an engaging design.
5. Zendesk sales statistics infographic example

This is a neat sales statistics infographic design from Zendesk. A cohesive color palette that’s soft on the eyes, clear headings, brief sections of text, and statistics that are clear as day all make this infographic an engaging read, and memorable. This type of infographic helps a lot when it comes to data analytics, one of the various Zendesk features, making complex data easily digestible for audiences of all technical backgrounds.
The design itself isn’t complicated. A collection of sharp stock images and a layout that utilizes an abundance of white space make it a well-designed infographic.
6. Drift sales statistics infographic example

The majority of people who read content online tend to skim. That means your captivating hooks, engaging prose, and enjoyable witticisms may all be overlooked. People want to get to valuable information instantly.
That’s what I really like about Drift’s infographic on real-time selling. The explanations are minimal, the word count has been filed down to the bare minimum. In the place of text, we find statistics and charts, hard data that we can chew on and form our own conclusions from. The infographic itself is very lengthy, but the amount of valuable dat makes it easier to read than typical alternatives.
7. Sales funnel infographic template

Understanding sales funnels, where customers drop off and opportunities to grow is valuable for salespeople. This sales funnel infographic template is a great way to visualize key performance insights all in one place.
The individual charts in the template are all customizable widgets in our online editor. Just double-click on the charts to input your data. You can add figures manually, add a Google Sheet Link or even upload an Excel file to auto-populate your chart. You can also change the color palettes with a click to customize the overall design.
8. Techniques for sales infographic template

Diagrams are key to explaining processes and tactics effectively. This sales infographic template is a great way to summarize a number of different sales techniques all in one page. An eye-catching color palette makes it engaging to reading. Individual sections and joining lines can be added or removed with just a few clicks.
9. Marketing and sales infographic template

There are countless marketing and sales strategies at our disposal. Different situations, industries, business models and a heap of other factors influence how we approach sales in our shop.
It’s not practical to expect sales professionals to hold every tactic in their heads at all times. This marketing and sales infographic template can be a great training resource for sales professionals. It can be used as a cheat sheet. It can also be included in blog content and shared as thought leadership content.
The alternating layout makes it easy to scroll through, while the vibrant colors make it engaging and pleasant to look at. You can easily customize it to share your breakdown of sales strategies, tactics and other insights.
Related: Marketing Infographics [The Definitive Guide + Templates]
10. High-performance sales infographic template
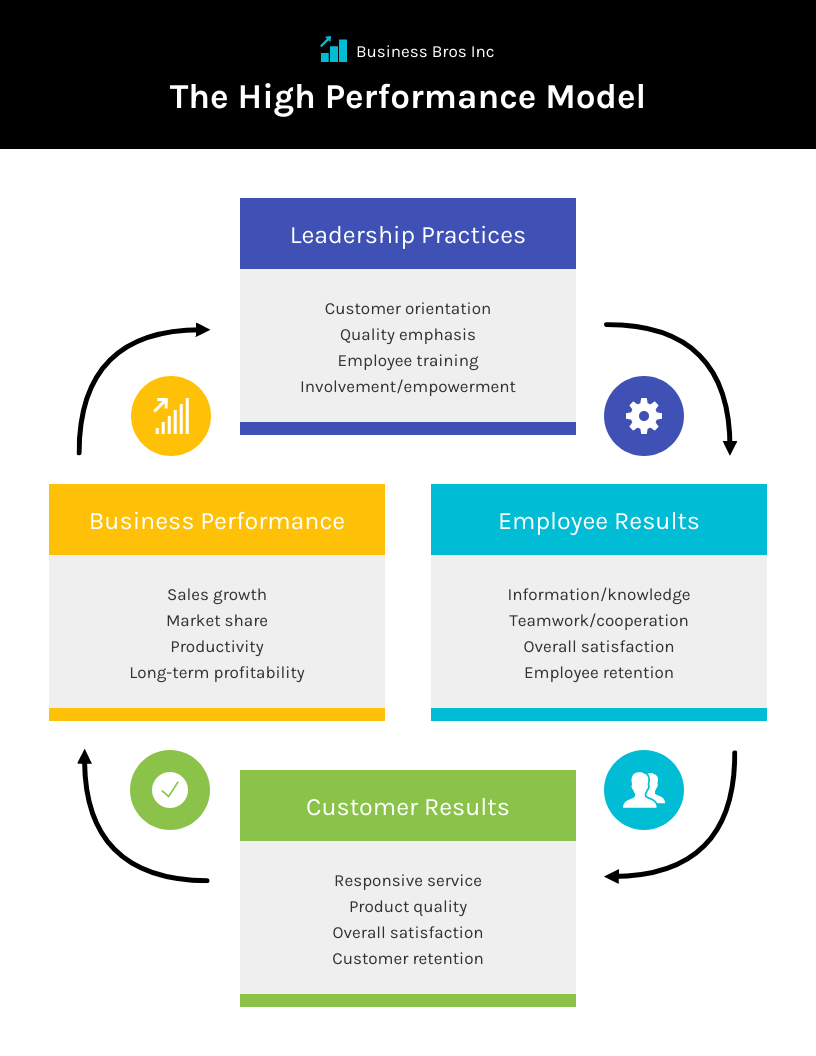
This high-performance sales infographic template can be customized for any type of process or flow. It visualizes the ideal environment for business success. It takes something abstract and nails it down by showing how different areas and factors are related.
Visualizing your own frameworks is easy when you get started with this template.
11. Social media sales infographic template

This social media sales infographic template is a great example of how you can share a lot of information, visually and clearly.
The professional icons are gorgeous illustrations that you can find in our icon library–we have thousands of free icons and illustrations to choose from. For each section of text, the icons engage the reader and communicate a central idea. This helps make each section easy to scan and remember.
Sales Infographics FAQ
1. What is a sales infographic?
A sales infographic is an infographic that focuses on sales trends, data, processes and other information related to sales. They can be used in sales training, thought leadership content, and as reference materials to support sales activities.
2. How do I create my own sales infographic?
Anyone can create a sales infographic using Venngage’s infographic templates. Visit the infographic templates library to select an eye-catching infographic design. Then customize the color, text and icons to help you visualize your idea. Download it as a PNG, PDF or PPT (PowerPoint file) to share with your audience.
3. Why do I need to use a sales infographic?
Sales training materials, frameworks and processes can be complex and change often. A sales infographic helps to distill valuable information in a single place through engaging design. It is far more accessible and easy to reference than lengthy text-heavy documentation.
Need to make a sales infographic? Start creating in seconds with our professional templates and simple online editor.


