


In a world where attention spans are shorter than ever, capturing your audience’s focus is no easy task—especially when it comes to dry business data. That’s where business infographics come in. These aren’t just pretty pictures; they’re a powerful way to simplify complex ideas, making them more engaging and easier to understand. Imagine turning a dull sales report into a vibrant visual story that actually holds people’s interest.
You don’t need to be a design pro to create these eye-catching visuals. With business infographic templates and a user-friendly infographic maker, you can craft professional, visually stunning infographics in no time.
Click to jump ahead:
- Social media business infographic examples
- Business infographics for guest posting
- Business infographics for sales pages
- Data visualization business infographics
- Business infographics to visualize internal processes
- Business infographics for internal communications
- Business infographics for PowerPoint and presentations
- Business infographic examples: further resources
New to creating infographics? This video tutorial is the perfect primer:
Related Reading: our post on what is an infographic is another great primer.
Let’s get started!
1. Social media business infographic examples
Business infographics on social media are essential for simplifying complex data and communicating key messages quickly. They enhance brand credibility by visually presenting insights, statistics, and processes, making information easy to understand and retain. They’re particularly effective for highlighting product benefits, sharing case studies, or presenting business results, helping companies stand out in a competitive digital landscape and compelling users to take action.
Want to promote your business on your social media channels (or on a partner’s channel)?
This business infographic example can be customized to show your services or competitive advantage–it’s the perfect way to try brand storytelling.

You can also use your infographic to inspire people to join a cause, or to contribute to a movement. This can also be used for your sales page (see the next section):

Sharing an entire infographic on a social media feed can look a little odd, depending how big it is. Especially with how Twitter and Facebook optimize and crop images.
Wishpond has a guide to social media image sizes. And all of our social media image templates are optimized for size by channel, too.
Otherwise, you might get stuck with something like this, from the World Economic Forum:
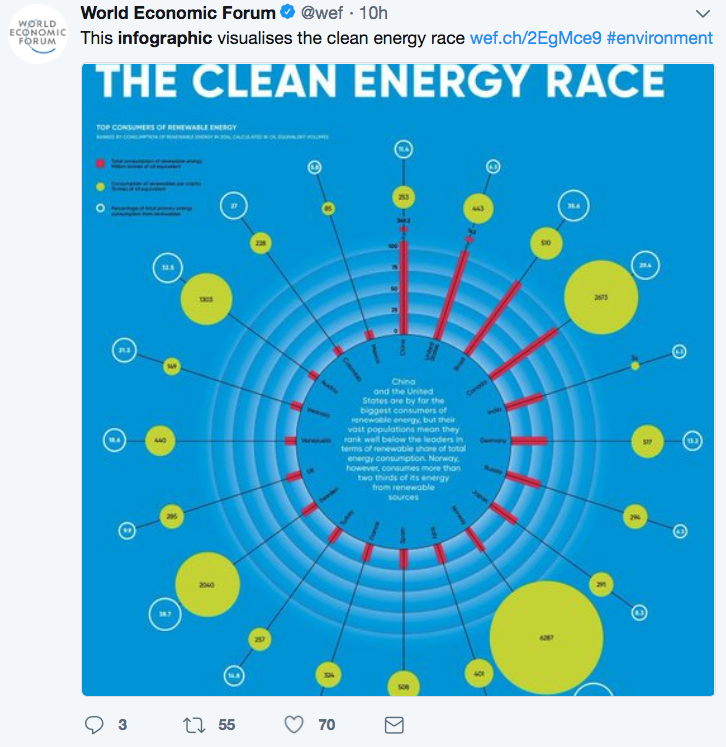
Half of the title is cut off, you can barely read the information and you have no idea what you should be focusing on.
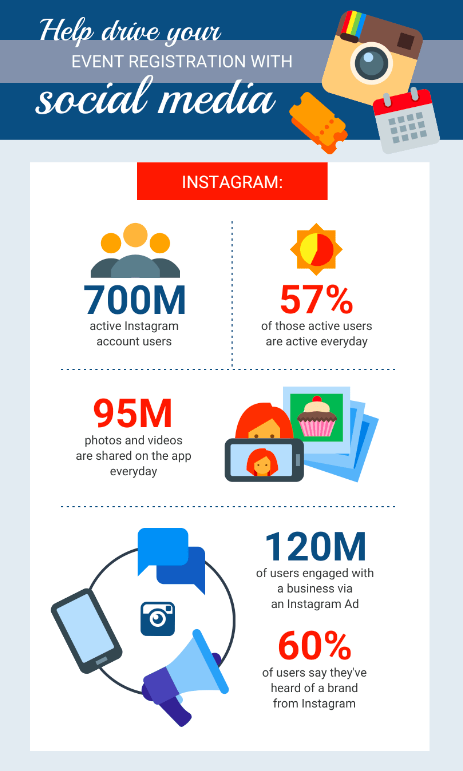
If you crop the image down to only include the header, you have an eye-catching social media image. Like in this example:

All you had to do was click a few things, instead of designing a whole new graphic!
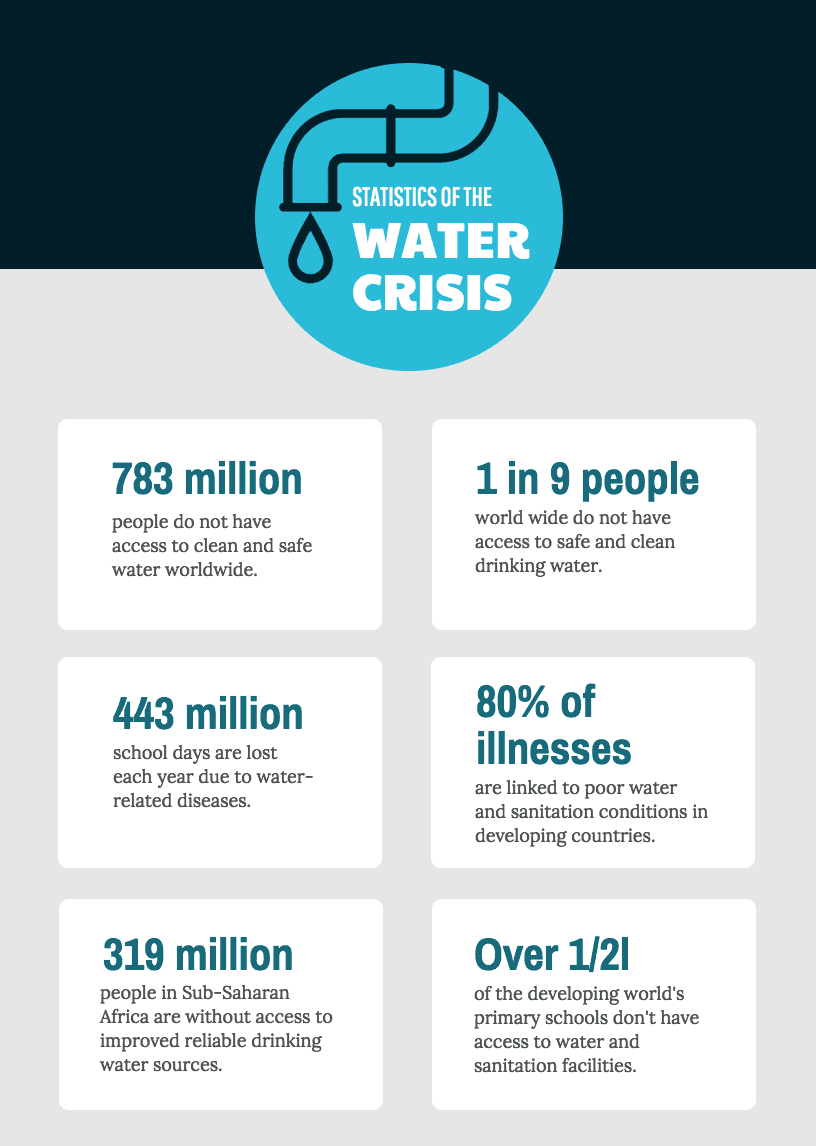
Another tip: you know how big numbers and shocking statistics make for great clickbait in article titles?
Well, infographics are no different.
Don’t believe me? What is your eye drawn to instantly in the example below:
Were your eyes drawn to the big, colorful numbers?
Here’s another example, this time using statistics as section headers:
2. Business infographics for guest posting
Infographics aren’t just tools that you can use to make your content more engaging.
Small businesses can use infographics as a low-cost tactic to drive traffic to other pages, to increase conversions, and to grow your audience. Try pitching guest posts to news sites or relevant company blogs. Make the offer even more enticing by offering to make an infographic to go along with the post.
Here’s a simple business infographic example you can repurpose to highlight the tips in your guest post:

Include a clear CTA (call to action) at the end of the infographic.
The CTA needs to tell readers exactly what you want them to do next. For example, your CTA could be as simple as telling them to visit your site for more information:

Telling them to download an ebook:

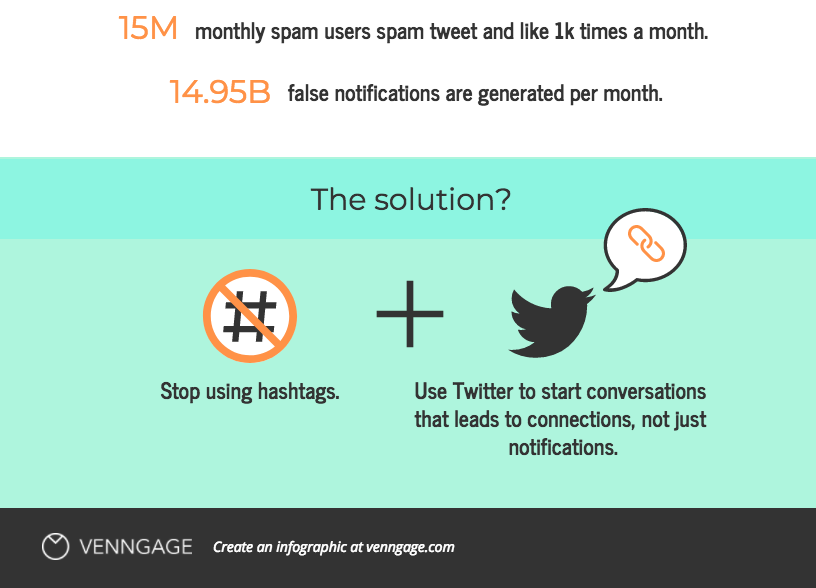
Or a call to action for a wider movement, like this plea to stop using hashtags:
If you don’t include a CTA, there’s a good chance readers are going to just bounce after they’re done reading the infographic. This is especially pertinent if your company infographic is going to be used on other sites or social media platforms.
Make it incredibly easy for them engage further with your company, no matter where they see it, by including an irresistible call to action.
3. Business infographics for sales pages
Include infographics on your website’s sales page to highlight your services, past successes or testimonials. This is a simple way for small businesses to use brand storytelling to make a bigger impact on visitors. Imagine, managing a restaurant as a small business, the use of templates will make attraction and conversion a lot easier.
Icons can be used to improve any design project, especially when it comes to company infographics. They represent an idea or concept in one small vector graphic.
To make your icons pop, use a background shape or border. This will help your icon stand out from the other visual elements, like in this business infographic example:

Check out how boring and out of place the icons on infographic on the left look, compared to the infographic on the right:
In the left-hand infographic, the icons fade into the background and are no longer a great focal point.
But when you add the background circle and border, like on the example on the right, the icons are brought front and center. Each of the sections now has a strong visual component drawing your attention directly to it.
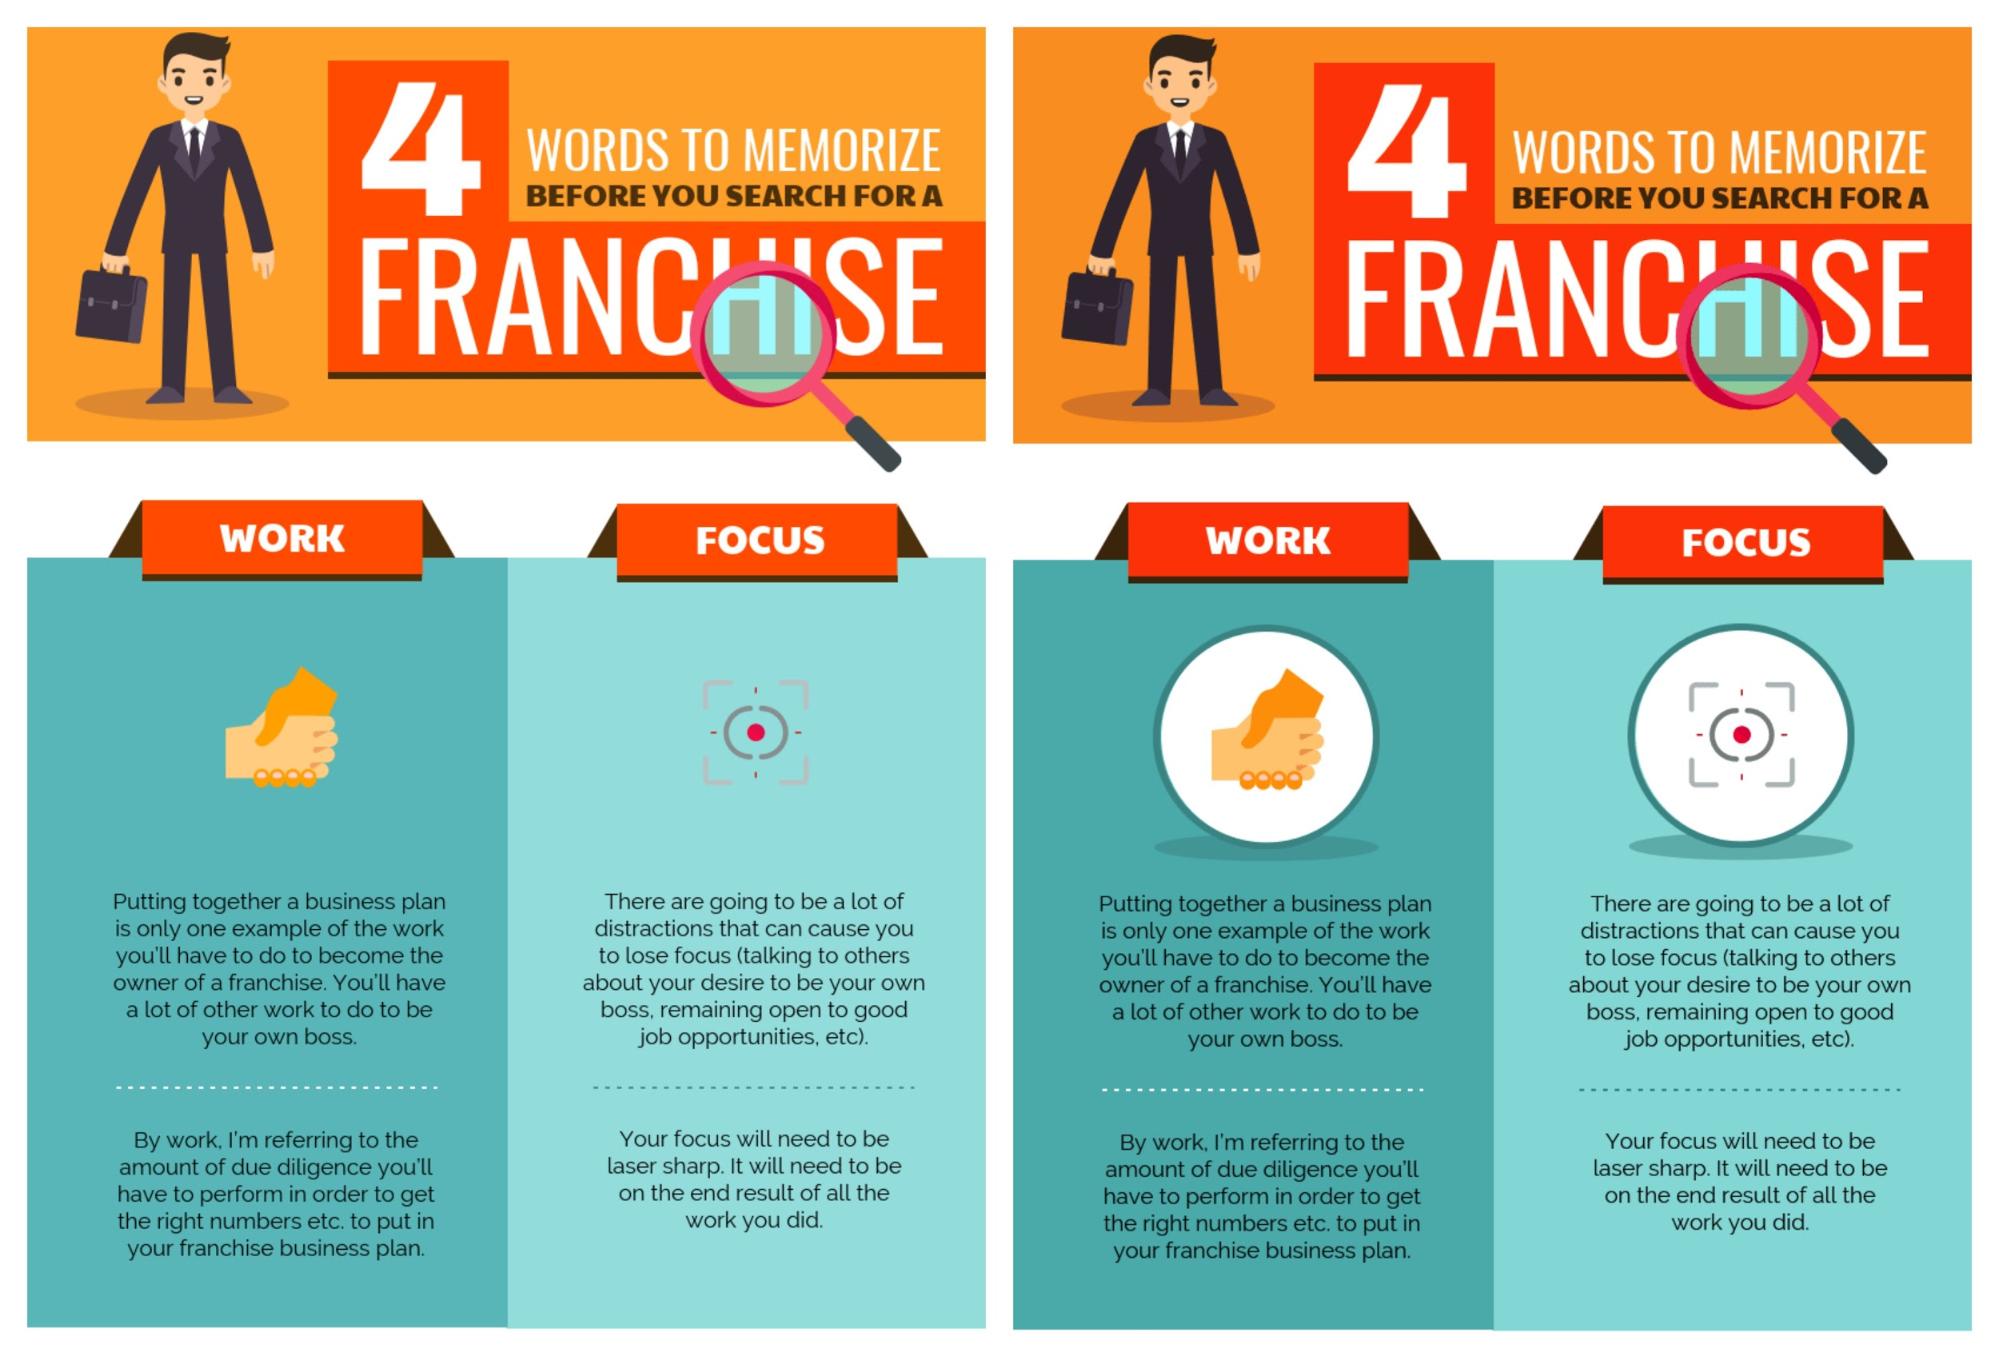
If you want to highlight different options or sections of your business infographic, you can use different colored backgrounds for your icons:

4. Data visualization business infographics
Often, there will be a particular number that you want readers to notice (for example, if you want to highlight a month with particularly high sales), like in this business infographic example:

A simple way to draw attention to a section of your infographic is to use a font or color that stands out from the rest. This is particularly useful when you want to highlight one particular data point or section of a chart.
For example, this business infographic uses green to highlight one bar on the chart, while the rest use a dark grey:
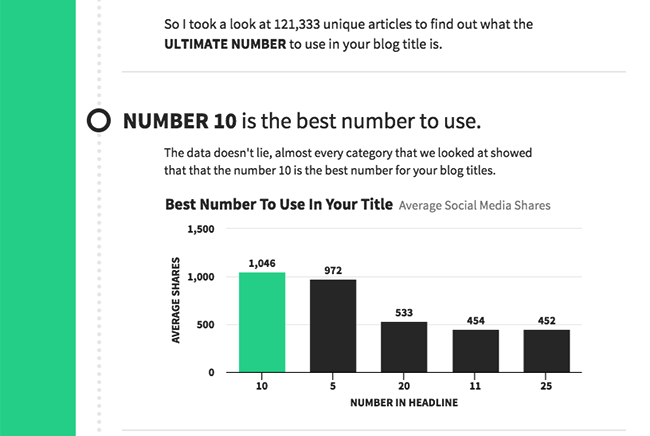
This helps readers quickly spot which data point you want them to notice.
You can also use colored shapes to emphasize particular sections of a chart, like in this example:

The infographic also includes a label that explains why that section is highlighted. In cases where the significance of a data point may not be obvious to readers, it’s a good idea to include a brief description.
Guide your readers to the information you want them to know by emphasizing the most important data points in your corporate infographic.
5. Business infographics to visualize internal processes
Maybe there’s a specific order in which you want people to read your company infographic (for example, if you’re summarizing a process). Or maybe there’s a particularly important statistic you want them to notice.
In both cases, directional cues like arrows and lines can guide readers’ eyes to where you want them to look, like in these business infographic examples:


Take a look at how confusing the business infographic example below looks without lines to guide your vision:
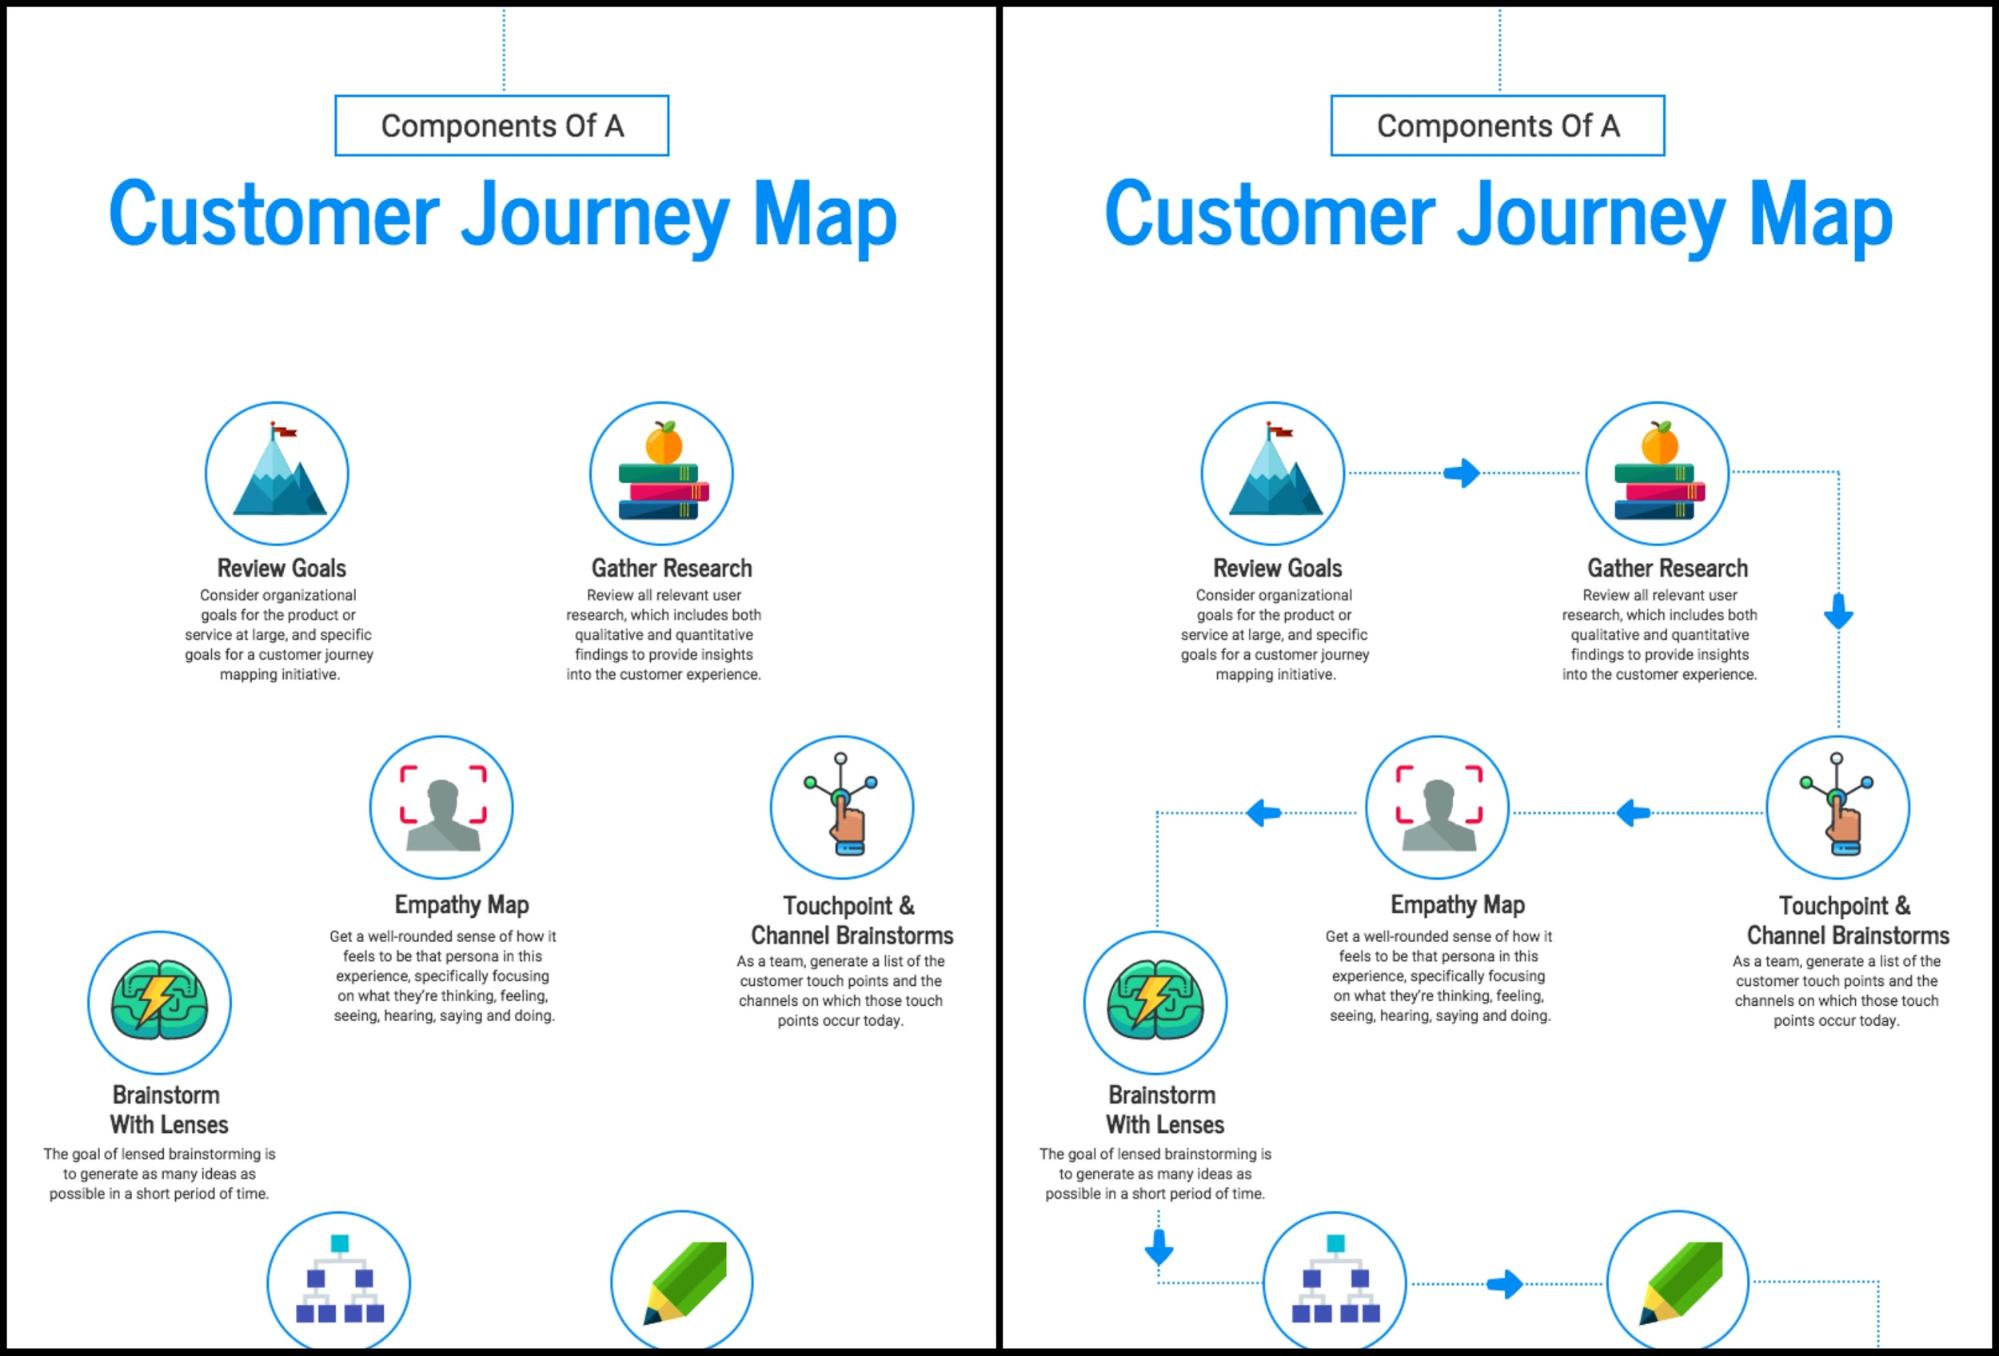
It’s significantly harder to follow the process, isn’t it?
But by using lines and arrows, you can create a simple timeline or map for readers to follow.

Here’s another example: in this business goals infographic, arrows are used to guide readers from the goals to the steps to achieve them:

It may seem like a somewhat small addition, but small visual cues make all the difference.
6. Business infographics for internal communications
Whether your company’s completely remote or not, it’s a good idea to clarify new processes, guidelines or expectations with a visual that you can share via different communication channels like these Slack alternatives, in a presentation, via email or even through the internal directory.
You can use this business infographic example to set goals or assign responsibilities to different members of your team:

This template works for new company guidelines or a new skillset you want your team to learn:

Our crisis communications guide has more templates and corporate infographics for internal communications.
If you want to communicate or reiterate your Diversity and Inclusion code of conduct, you can use a simple informational infographic:

7. Business infographics for PowerPoint and presentations
Infographics are great additions to your presentations, whether you make them in PowerPoint or Venngage (you can now export our presentations in PowerPoint format too!).
This market report infographic example could be customized for any kind of data you need to showcase in your presentation:

Lists and processes can easily be made into an infographic too, are often easier to follow if you number each point or step. Numbers make it clear that there is a specific order you should follow, which can clear a lot of potential confusion for your readers.
For example, this corporate infographic doesn’t really need numbered sections:

But you could easily get lost in the process if the numbers were taken away. As well as in this one, because the second point is actually below the first one, instead of to the right:
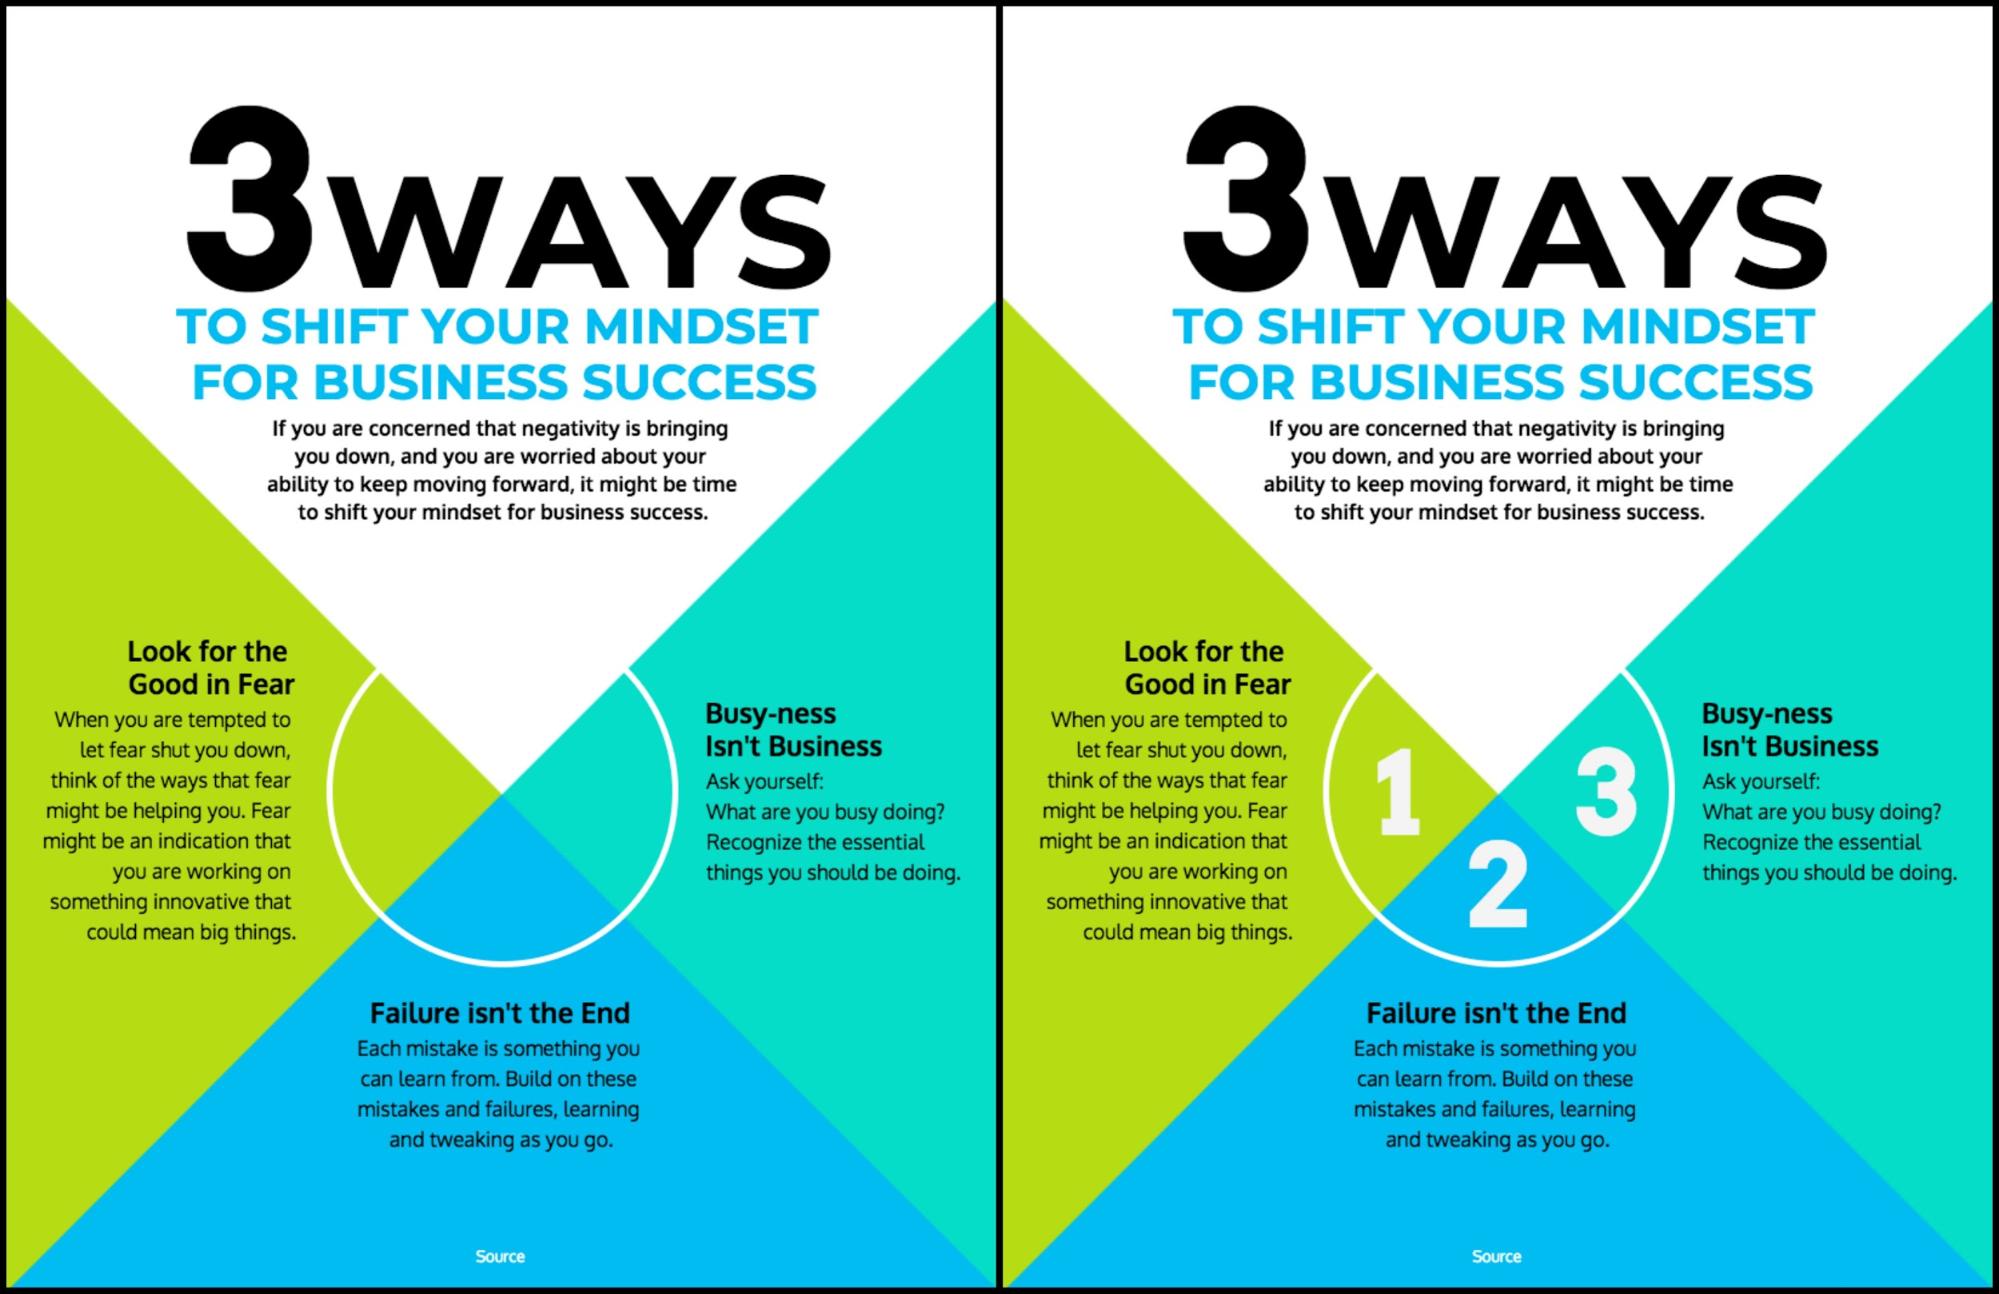
Numbers can also help differentiate between points, like in this infographic template:
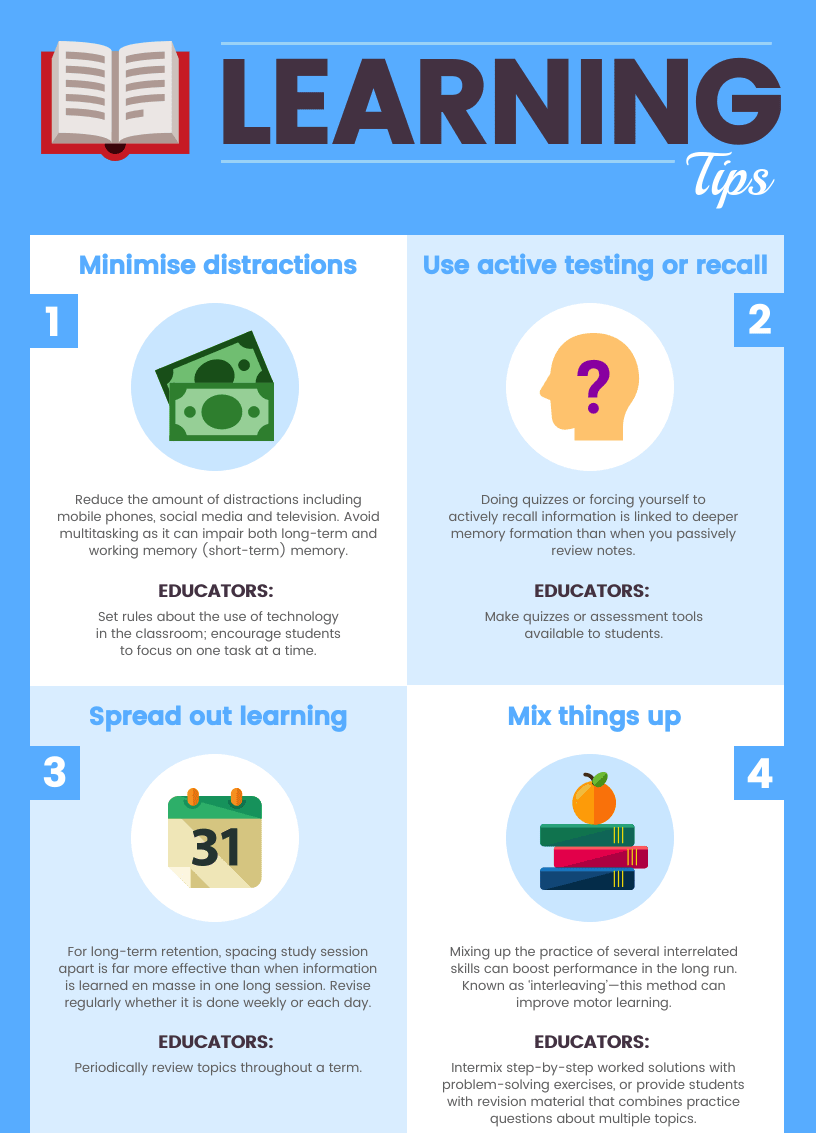
The numbers help highlight each individual point. People skimming the infographic will know there are four key points that they can take away.
Plus, like we saw with the arrows and lines, numbers can be strong visual cues that direct readers to specific parts of your infographic. Their mind will likely jump from one number to the next almost without thinking!
Business infographic examples: further resources
Just remember that a great design is only one part of the equation. You also need a great infographic topic and solid data.
Put all of that together and you will have an engaging business infographic that you can use over and over again.
Here are some more resources to help you create and market your infographic:
- Tips to Create a Process Infographic
- Marketing Infographic Templates + Tips
- Tips to Create Comparison Infographics + Templates
- 7 Leadership Infographic Ideas
- 31 Consulting Proposal Templates
- 19 Consulting Report Templates
- 10+ Case Study Infographic Templates That Convert
Want to learn more about creating great visual content? I would recommend checking these articles out:


