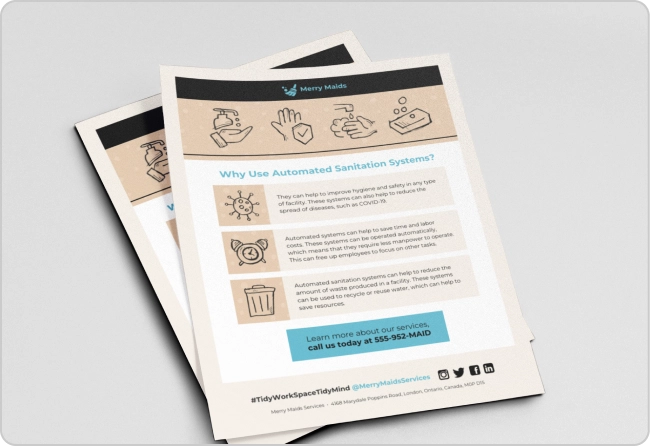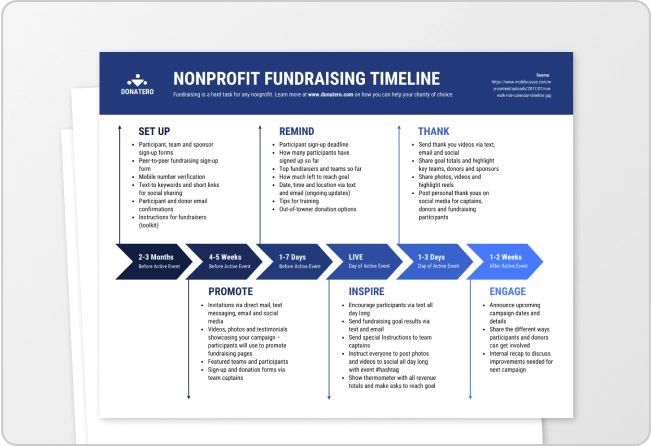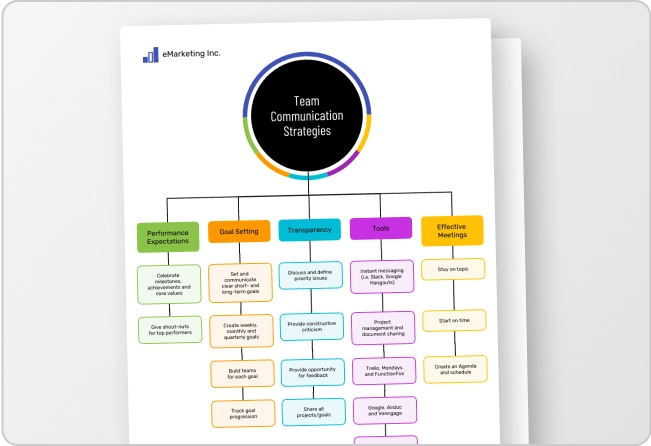



OpenAI released ChatGPT Images 2.0 in April 2026, with much better text rendering, instruction following and support for different languages and aspect ratios. These improved text and layout capabilities make it much easier to generate infographics, something AI image generators have traditionally struggled with.
You can now create infographic designs with a simple prompt in ChatGPT, but the final output still depends a lot on what you ask for and how you guide it. In this guide, I’ll show you how to generate infographics using ChatGPT, the prompts that work and where you might still need a dedicated infographic generator.
Why use ChatGPT for infographic creation?
ChatGPT Images 2.0 can handle both the information and the visual at the same time. You can give it your content, data or even a rough idea, then use prompts to shape how that information is presented.
Here are some of the capabilities that make it useful for creating infographics:
- Text inside images: ChatGPT can generate headings, labels, statistics and supporting text directly inside the infographic, so you don’t have to add every piece of copy separately.
- Dense text rendering: Infographics often need to fit quite a lot of information into one visual. Images 2.0 is better at rendering denser blocks of text while keeping them readable.
- Stronger instruction following: You can be specific about the structure, visual hierarchy, style and information you want included, and ChatGPT is better at following those directions.
- Images with thinking: For more complex prompts, ChatGPT can spend more time reasoning through the request before generating the image. This can help when you need a structured infographic layout.
- Flexible aspect ratios: You can create vertical, square or horizontal infographics depending on where you plan to use them, whether that’s a report, presentation or social media post.
- Conversational editing: You don’t have to get everything right in the first prompt. Ask ChatGPT to shorten a section, move elements around, change the style or revise specific parts of the infographic and keep refining the same design.
What do you need before creating an infographic with ChatGPT?
Infographics are more about thinking than design. You need to know what you want to say, how to say it clearly and why someone should care enough to read it.
Once you have clarity, designing an infographic becomes the easy part. But without a plan, even the best visuals can fall flat.
And unless you’ve a designer on payroll, it’ll take you a long time to learn the tools and design a good infographic on your own.
But here’s the good news: you don’t need to be a designer to create an infographic. Not anymore.
You just need to know two things before we get started:
- A rough idea of what is an infographic. Think of it as a visual storyboard that explains a complex topic easily.
- A basic grasp of prompt writing. Again, you don’t have to be a “prompt engineer.” But you should know how to give clear instructions to ChatGPT.
If you’ve these fundamentals in place, you’re ready to build an infographic with ChatGPT.
How to create an infographic with ChatGPT (step-by-step process)
Let’s go through the step-by-step process on how to use ChatGPT to create an infographic:
Step 1: Define the topic and audience
Before you write an infographic prompt for ChatGPT, be clear about two things:
- What’s the topic?
- Who’s it for?
This will help you design an infographic around a core point. Without this clarity, you might fall into the trap of trying to say too much and appealing to everyone.
Let’s say you work for a fast-growing marketing agency. Instead of creating another broad infographic on “The State of Digital Marketing,” narrow the idea down to something timely and specific, like “AI Design Trends Shaping 2026.”
The second one is more specific and highly relevant for your audience (i.e. content marketers in growing companies).
Step 2: Gather important information
Next, gather the information you want your infographic to communicate. This could be statistics, industry benchmarks, expert quotes, process steps or key facts.
For example, if your topic is AI Design Trends in 2026, you might collect points like:
- AI becomes part of the design workflow: 54% will prioritize AI-assisted creation.
- AI adoption grows faster than AI maturity: Nearly 70% of marketers use AI, but only 8% have a systemic setup.
- Human + AI aesthetics take over: 59% favor AI illustrated storytelling and 54% are experimenting with hybrid photography.
- Brands push back against the generic AI look: 44% say unrealistic 3D renders already feel overused.
- Consistency becomes the new AI challenge: 43% marketers say keeping AI output on-brand is their biggest headache.
The clearer your topic, audience and supporting information are, the easier it will be to give ChatGPT a prompt it can actually work with.
Step 3: Pick infographic design references
Before you prompt ChatGPT, find a few infographic designs that match the look and feel you want.
Pay attention to things like:
- Layout and information flow
- Color palette
- Illustration or icon style
- Typography
- How much text each section uses
You don’t need to copy a design exactly. The goal is to give ChatGPT a clearer visual direction instead of asking it to decide everything from scratch.
You can then upload the reference to ChatGPT along with your content and ask it to create something with a similar structure or visual style.
Step 4: Define the visual direction
Once you have a few design references, decide which infographic elements you actually want ChatGPT to follow.
Think about:
- Color palette: Brand colors, muted tones, bold contrasts or something more playful
- Visual style: Minimal, editorial, illustrated, corporate or data-heavy
- Icons and illustrations: Simple line icons, flat illustrations, realistic visuals or no icons at all
- Typography: Clean and modern, bold and playful or more formal
- Overall feel: What should someone think or feel when they first see the infographic?
If you have a brand style guide, pull the relevant colors, fonts and visual rules from it. If not, your reference designs can do most of the work.
The important part is to translate those references into instructions ChatGPT can actually follow. Instead of saying “make it look professional,” say something like:
Use a clean vertical layout, navy and cream color palette, simple line icons and bold typography for the key statistics.
That gives ChatGPT far more direction than a vague style request.
Step 5: Ask ChatGPT for infographic design ideas
You don’t have to jump straight from research to the final infographic. Before generating the image, ask ChatGPT to suggest a few visual directions based on your topic, content and references.
This helps you explore different ways to present the same information before committing to one design.
For our AI Design Trends 2026 infographic, you could prompt:
I’m creating an infographic on AI design trends for 2026. Based on the research and design references below, suggest 3 distinct visual concepts. For each concept, recommend the layout, color palette, typography style, illustration or icon approach and how the five trends could be visually separated. Keep the ideas modern, editorial and suitable for a professional audience.
ChatGPT might suggest, for example:
- a futuristic editorial layout with bold typography and modular trend cards
- a more human, tactile style using textured illustrations and softer colors
- a clean data-led design with large statistics and minimal graphics
Pick the direction that best fits your audience and the story you want the infographic to tell. You can then use that concept as the base for your final image prompt.
Step 6: Write a prompt to generate the infographic
Now you’re ready to bring everything together.
If you found an infographic design reference you like, upload it to ChatGPT. Or, if you preferred one of the visual concepts ChatGPT suggested in the previous step, tell it to use that direction.
Then give ChatGPT your content and a few clear instructions about what the final infographic should look like.
A good infographic prompt should cover:
- What you’re creating: The topic and infographic format
- What to include: Your final data points, trends or supporting information
- Visual direction: The design reference or concept you want it to follow
- Hierarchy: What should stand out first
- Style details: Colors, typography, icons or illustrations
- Format: Vertical, horizontal or square, depending on where you’ll use it
For our AI Design Trends 2026 example, here’s the prompt I used:
Prompt example 1
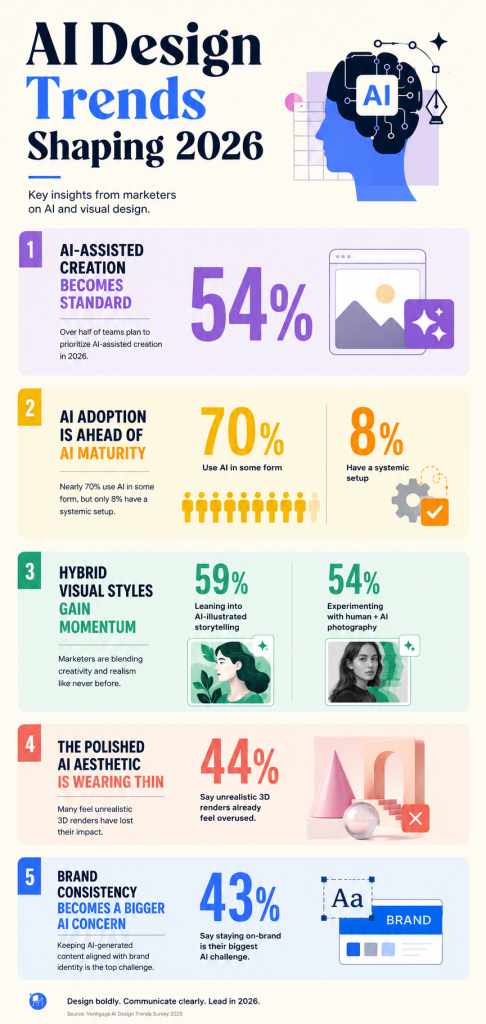
Create a vertical infographic titled “AI Design Trends Shaping 2026” using the research below.
Use the editorial design direction we selected earlier, with bold typography, clean modular sections and a mix of simple illustrations and prominent statistics.
Feature these five trends:
- AI-assisted creation becomes standard: 54% of teams plan to prioritize AI-assisted creation in 2026.
- AI adoption is ahead of AI maturity: Nearly 70% of marketers use AI in some form, but only 8% have a systemic setup.
- Hybrid visual styles gain momentum: 59% are leaning into AI-illustrated storytelling, while 54% are experimenting with human + AI photography.
- The polished AI aesthetic is wearing thin: 44% say unrealistic 3D renders already feel overused.
- Brand consistency becomes a bigger AI concern: 43% say keeping AI-generated output on-brand is their biggest challenge.
Make each trend visually distinct, with the statistic as the most prominent element and a short explanation underneath. Keep the copy concise and easy to scan. Use clear visual hierarchy and enough white space so the infographic doesn’t feel crowded.
Output for this prompt:
Let’s raise the stakes a little bit. Here’s an example of a detailed prompt that in a different visual style.
Prompt example 2
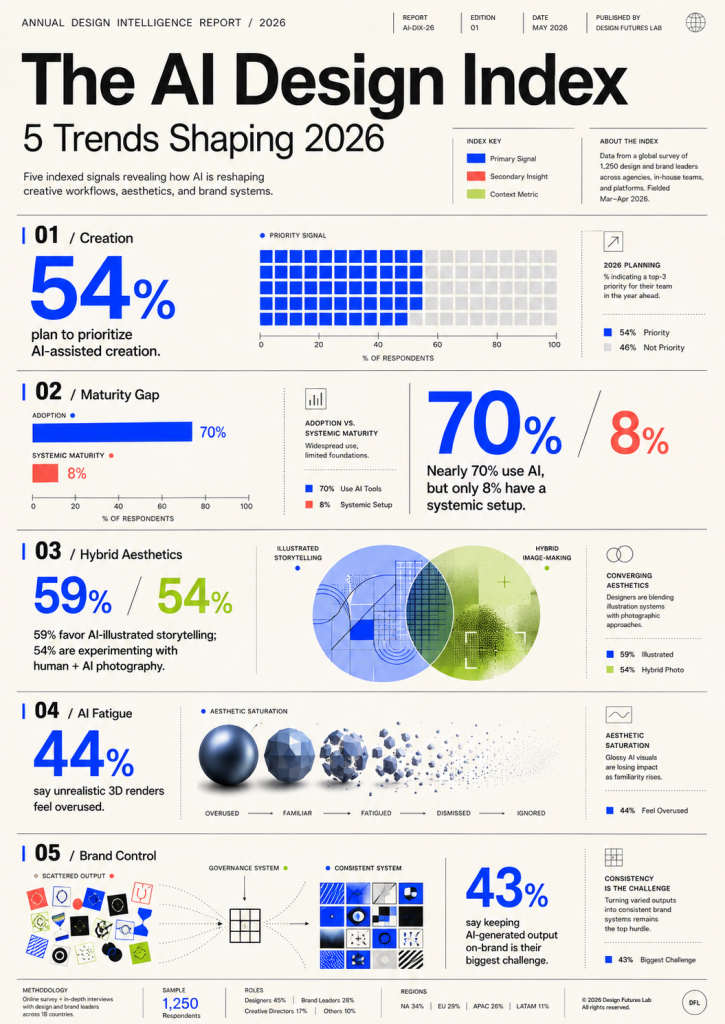
Create a vertical infographic titled “The AI Design Index: 5 Trends Shaping 2026” designed like a page from a premium annual design intelligence report.
The central concept is an AI Design Index: five numbered signals that reveal how AI is changing design in 2026. Treat every trend like a data point in an editorial research report, using oversized percentages, index numbers, small annotations, charts and abstract data graphics rather than decorative illustrations.
Use a warm off-white background, charcoal typography, electric blue as the main accent, with restrained coral and acid-green highlights. Use bold neo-grotesk typography, a strict editorial grid and generous white space.
Arrange the infographic as five numbered horizontal index bands: 01–05, alternating large statistics left and right.
01 — Creation
54% plan to prioritize AI-assisted creation.
Show a large 54% with an expanding progress/grid graphic.02 — Maturity Gap
Nearly 70% use AI, but only 8% have a systemic setup.
Make the 70% vs 8% disparity visually dramatic with unequal bars or blocks.03 — Hybrid Aesthetics
59% favor AI-illustrated storytelling; 54% are experimenting with human + AI photography.
Show two visual systems overlapping or merging.04 — AI Fatigue
44% say unrealistic 3D renders feel overused.
Show a polished geometric form gradually flattening, fragmenting or fading.05 — Brand Control
43% say keeping AI-generated output on-brand is their biggest challenge.
Show scattered visual outputs being pulled into one consistent grid.Add small editorial details such as trend labels, index numbers, fine rules, chart ticks and short data annotations to make it feel like a researched annual report.
Avoid cards, robots, brains, sparkles and generic futuristic AI imagery. The overall visual should feel like Bloomberg Businessweek meets a contemporary design trends report: sophisticated, data-led, graphic and highly editorial.
Output for this prompt:
Step 7: Download the infographic
Once you’re happy with the image ChatGPT generates, go ahead and download it.
Right now, infographics created through the “Create Image” feature are typically available in PNG format. If you need a JPEG or PDF version, you can easily convert it using one of the many free online image converter tools.
You can also ask ChatGPT to write captions or social media copy to help you promote the infographic.
Just be prepared for occasional hiccups — like image generation glitches or prompts that don’t deliver.
What are the limitations of creating infographics in ChatGPT?
ChatGPT can help you come up with an infographic concept and turn it into a complete visual, but the final design can still be difficult to edit and may look generic. Here are some of the reasons why creating infographics entirely in ChatGPT might not work:
- Difficult to edit: Small changes can be frustrating because editing one element may affect other parts of the design.
- Limited creative control: You can’t precisely adjust individual text boxes, icons, charts or sections. Fixing the design often takes several rounds of prompting, which can make the process time-consuming.
- Generic design output: ChatGPT often falls back on similar visual patterns, from heavy strokes to familiar AI-generated layouts. Across multiple infographics, the designs can start to feel repetitive and generic and might even look like AI design slop.
- Inconsistent branding: You can provide brand colors, fonts and references, but it can still be difficult to maintain the same visual brand identity across different designs.
- Difficult to reuse: Resizing or adapting an existing infographic for another format can change the composition instead of simply reflowing the same design.
What’s the best ChatGPT alternative for creating infographics?
ChatGPT can help you come up with an infographic concept and generate a complete visual, but it’s not a dedicated infographic design tool.
If you want to design infographics with AI that you can actually edit and reuse, a dedicated AI design solution like Venngage gives you more control over the final design.
The Venngage AI Infographic Generator lets you create an infographic from a simple text prompt and continue editing the same design with AI or manually. Here’s where that becomes useful:
Start with a professional infographic template
Venngage has 10,000+ professionally designed infographic templates across statistical, comparison, process and other infographic formats.
Select a template and add a prompt to edit it. AI Content Auto-Fill automatically places it into a suitable layout. This saves you from finding design references, planning the structure or repeatedly prompting ChatGPT to get the composition right.
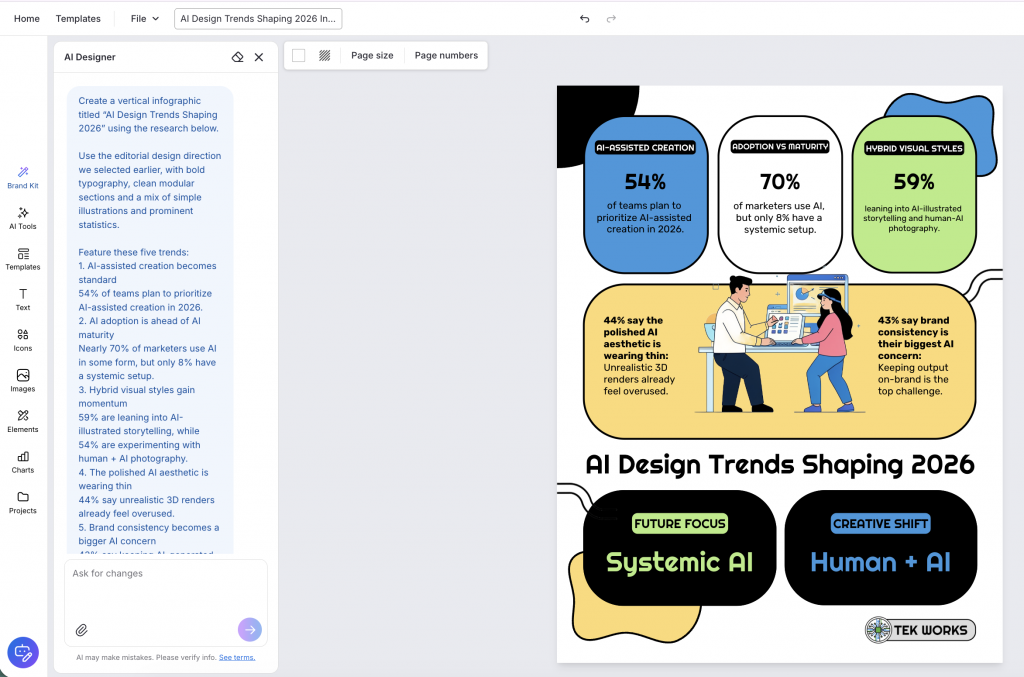
For example, I edited this statistical infographic template using the same AI design trends prompt I tried earlier with ChatGPT.
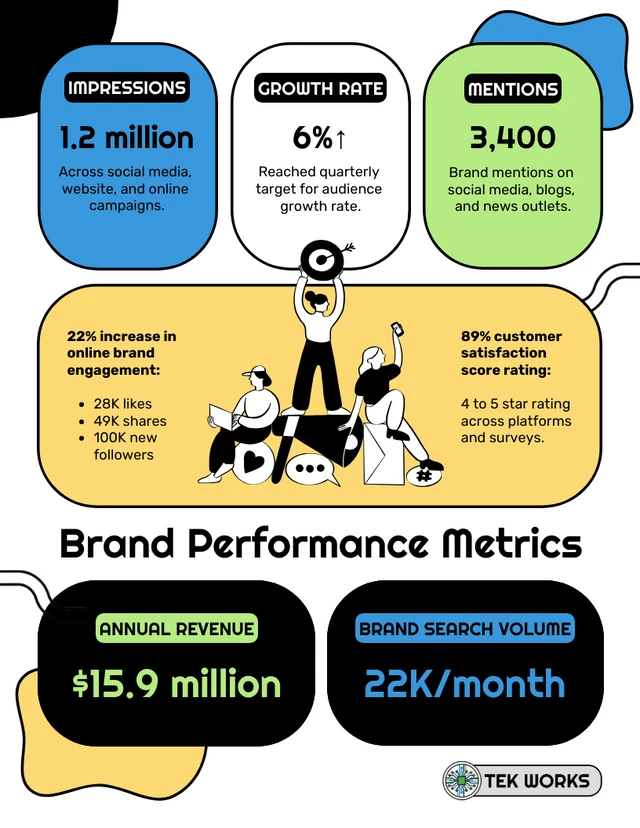
Here’s the result:
I also tried the same AI Design Index prompt in Venngage using the ‘Blank’ canvas option to see how the workflow compared with ChatGPT. Instead of jumping straight to the final design, Venngage AI first created a plan for the layout, visual style and data treatment. I could review the plan, approve it and then continue editing the infographic through the same chat.
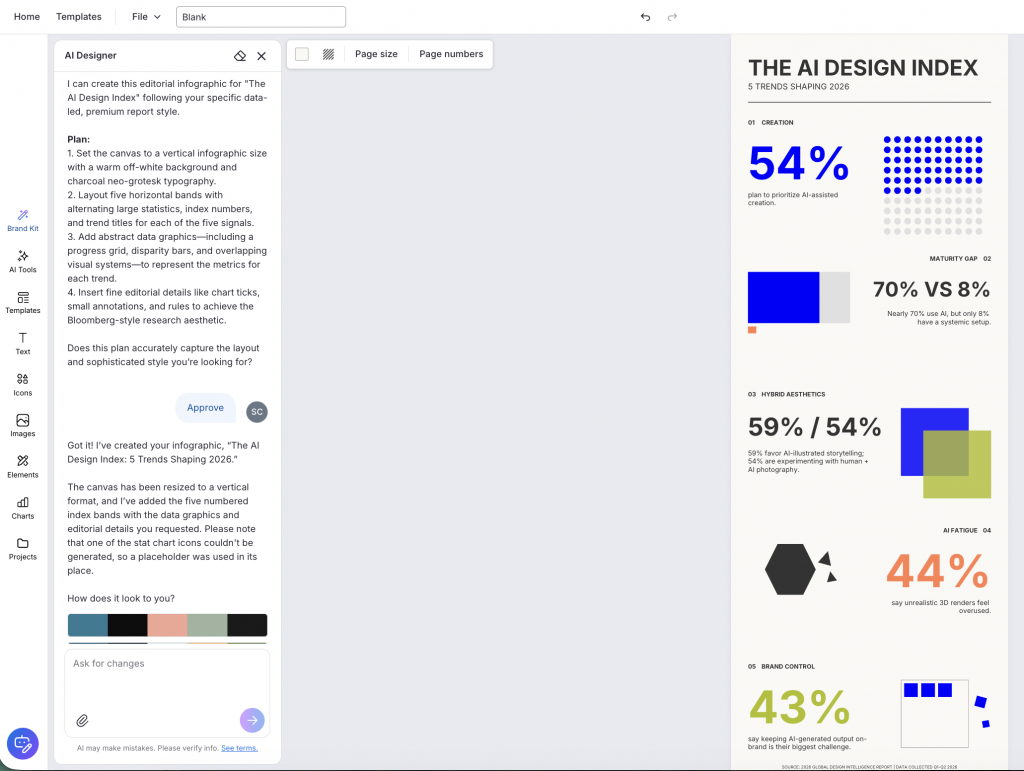
Edit the infographic design with Venngage AI
Instead of generating a new image every time something looks off, you can keep working on the same infographic in Venngage.
Chat with the AI Designer and tell it what you want to change. Ask for a different layout, a more vibrant color palette, a more engaging section or a resized version. It will suggest a plan based on your request, which you can apply in one click.

If you want more precise control, use the drag-and-drop editor to move text boxes, change icons, edit charts or reposition sections yourself.
You can also edit the copy without generating multiple versions of the infographic. Use the AI Writing Assistant to shorten text, rewrite a sentence or fix the grammar while keeping the rest of the design intact. And if you need a specific AI-generated visual, you can generate custom icons and images directly in Venngage.
Resize sections without breaking the layout
Infographic content rarely fits perfectly on the first try. A paragraph might need more room, or a section built around one statistic might need much less.
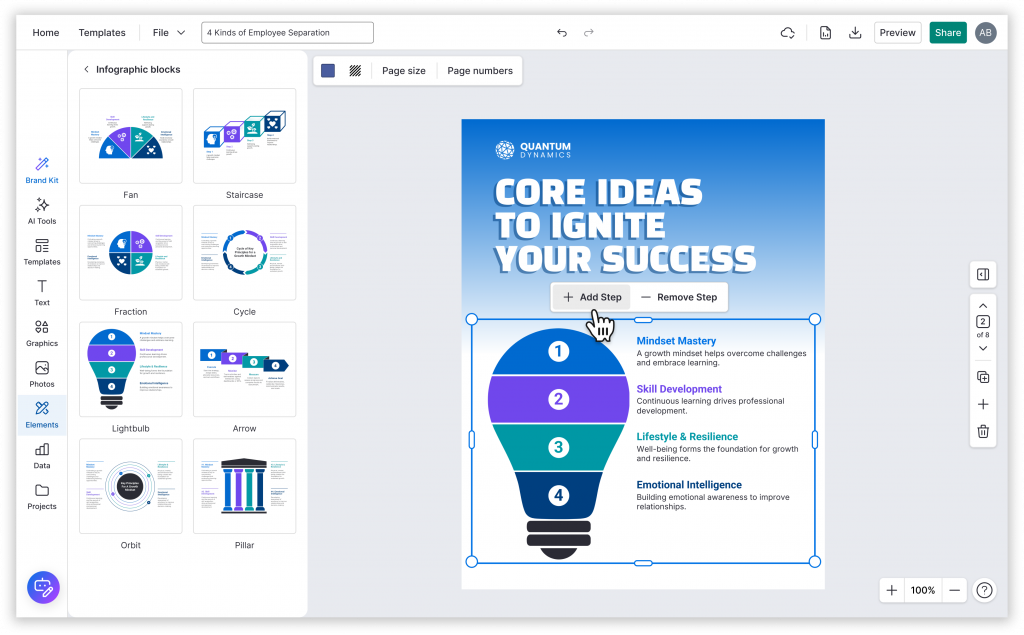
Venngage’s modular infographic blocks resize with the content inside them. Text, labels and icons scale with the block instead of getting clipped or pushed out of place.
That makes it easier to keep refining the information without rebuilding the layout every time something changes.
Apply your branding in one click
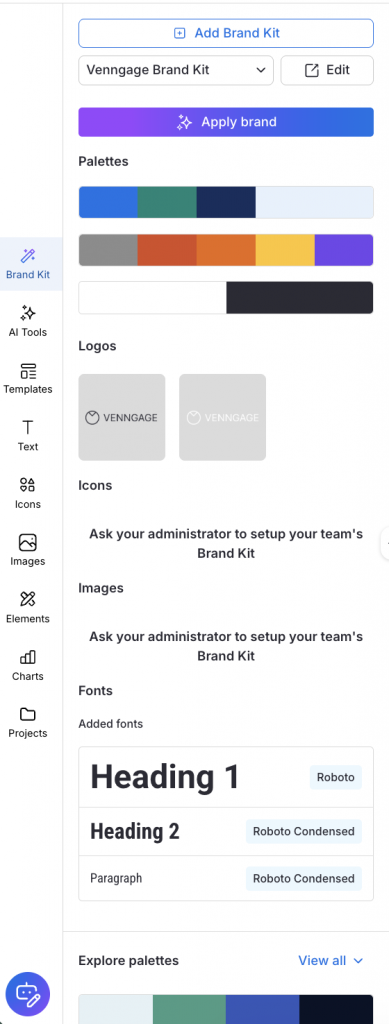
You can tell ChatGPT which colors and fonts to use, but maintaining brand consistency across multiple designs can be difficult.
The My Brand Kit feature in Venngage lets you apply your logo, fonts and brand colors to the infographic in one click. You can also save finished designs as templates, which is useful if you regularly create infographics for the same brand.
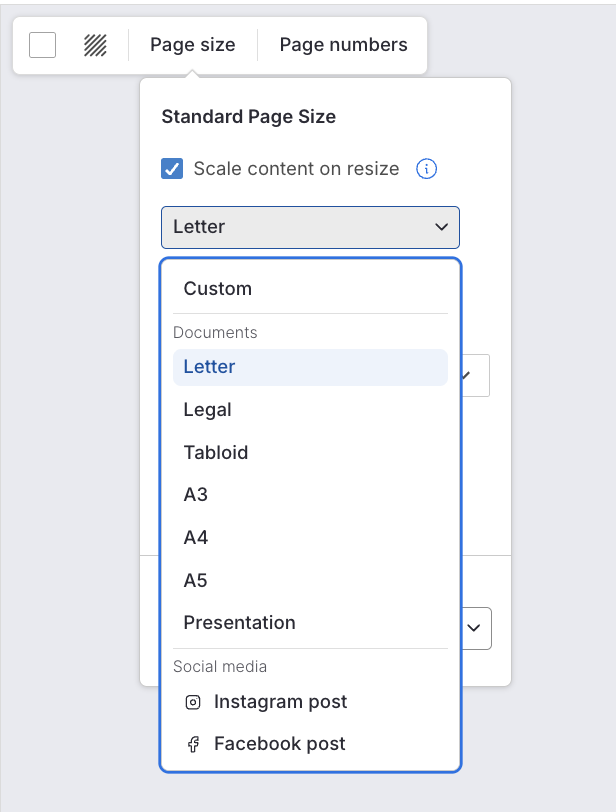
Resize and reuse your infographic
If you need the same infographic for LinkedIn, Instagram, Facebook or another format, you don’t have to generate the design again from scratch.
Choose a preset size or set your own dimensions, then adjust the layout if needed. Once the design is ready, you can export it as a high-quality image.
How to edit a ChatGPT infographic in Venngage?
If you’ve already created an infographic in ChatGPT and like the overall direction, you don’t have to recreate it from scratch in Venngage.
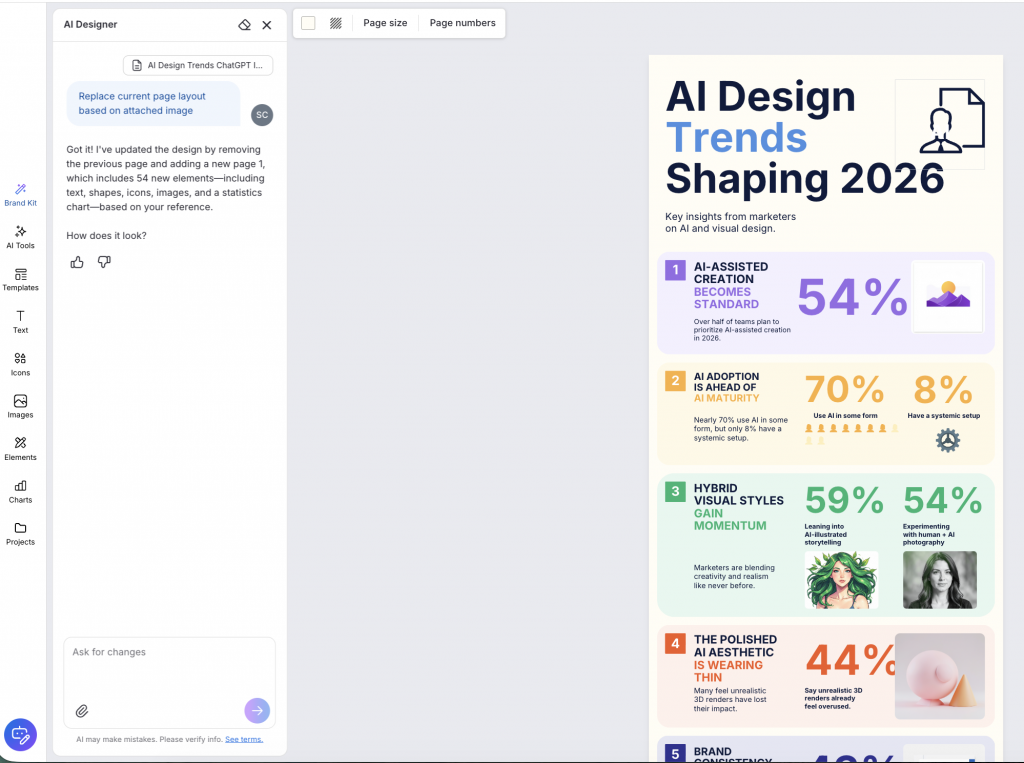
Upload the ChatGPT infographic to Venngage and the AI designer will convert it into editable blocks, so you can edit the text, generate custom icons and polish the overall design easily.
Here’s how the AI design trends infographic generated by ChatGPT looks like in Venngage. You can select any text or image and refine it.
Frequently Asked Questions (FAQs)
Curious to know more about using AI tools for creating infographics? Here are answers to some of the most common questions:
1. Can ChatGPT generate complete infographics on its own?
Not exactly. ChatGPT can help draft an infographic outline, recommend the content structure, generate content and generate images. However, it can’t create fully editable, high-resolution infographics by itself. For best results, you’ll need to use external tools like Venngage.
2. What are the benefits of using ChatGPT for infographic creation?
ChatGPT is great for organizing your thoughts, structuring the visual layout and brainstorming copy ideas. It’s especially useful when you need to get things done faster or if you want to spar your ideas with others.
3. Is it possible to create unique and engaging infographics with ChatGPT?
Yes, but this heavily depends on your prompting skills. ChatGPT can help you create original content and design, but it has limitations. To create unique designs, you’ll need to use a dedicated design tool that lets you customize the layout, icons, fonts and colors.
4. Can ChatGPT assist in updating existing infographics?
Partially. You can paste the text or data from an existing infographic and ask ChatGPT to revise or improve it — like rewriting copy, updating statistics or recommending a new structure. For the actual changes to the design, you’ll need a design tool.
5. How can I ensure the quality of infographics created with ChatGPT?
Start with a clear outline. Ask ChatGPT to critically assess the plan. Next, draft a prompt with very specific instructions and feed it on ChatGPT to create the infographic. The better your prompt, the better the quality of the infographic.
Create infographics that aren’t just pretty, but purposeful
In the past, you had to be an elite designer to create visually stunning infographics. With AI tools like ChatGPT, that barrier doesn’t exist anymore.
ChatGPT helps you sharpen your ideas, think through the nuances and create the first draft in record speed.
But great infographics aren’t about making things look pretty. They’re about simplifying complex topics for the readers. Design is just a vehicle for your ideas.
And while ChatGPT is great for brainstorming and first drafts, Venngage gives you the creative control to bring those ideas to life. It offers you thousands of customizable templates, Brand Kit and an AI design suite that meets all your design needs.
Try Venngage’s AI infographic generator for free and see how you can turn your ideas into powerful visuals.