


Claude now sits inside workflows for coding, research, writing, presentations and product planning. So it was only a matter of time before people started asking: can it make infographics too?
The short answer is yes, but the workflow matters more than the tool. Claude Design works best for non-designers. Claude Code suits technical users. Artifacts help with quick drafts.
Skills work for repeatable workflows. Claude handles structure, copy, layout direction and code-based visuals well. Final polish and export options still depend on the product, plan and workflow.
Best Ways to make an infographic with Claude
The best Claude infographic workflow depends on one thing: what you want at the end. Some workflows optimize for speed, while others optimize for control, polish or repeatability.
For instance, Anthropic positions Claude Design around visual exports in Canva, PDF, PPTX and standalone HTML. Meanwhile, technical users often prefer Claude Code workflows and infographic skills like Baoyu Infographic with its 21 layout types and 20 visual styles.
And UX Planet shows growing interest in Claude Code-specific infographic workflows.
Therefore, your workflow changes depending on how much control, polish or speed you want. Here’s a quick look at how the main options compare:
Which workflow should you choose?
- Use Claude Design for polished visuals and faster editing: Best for marketers, founders and non-designers. Export options include PDF, PPTX, Canva and HTML.
- Use Claude Code for control and custom outputs: Best for HTML, SVG, web graphics and developer workflows.
- Use Artifacts for quick drafts: Useful for testing structure, layouts and visual direction fast.
- Use Claude Skills for repeatable workflows: Useful for creating similar infographic formats repeatedly.
- Use Figma or Canva for final polish: Better for branding, templates, exports and production-ready assets.
Related: How To Create Infographics Using ChatGPT
Quick workflow: Create a Claude infographic
Claude works best when you ask it to organize information before you ask to conjure up a visual.
Whether you want a polished Claude infographic or a full Claude Code infographic workflow, the best way is to finalize the structure first, then prompt the visuals.
1. Define the topic, audience and goal
Before you create infographics with Claude, make sure you have clarity about the following:
- Topic: What is this infographic about?
- Audience: Who will read it?
- Goal: What should people learn, remember or do?
- Format: Vertical infographic, LinkedIn carousel, one-page PDF or slide deck.
- Style: Editorial, playful, technical, minimal or data-heavy?
- Length: Short summary or deep dive?
- Source material: Stats, report excerpts, article links or something else?
A safe bet is not to ask Claude AI infographic tools to invent the content for you. Instead, paste your notes, research or survey results directly into the prompt.
For instance, here’s how an absolutely bad prompt looks like:
Create an infographic about cybersecurity.
While here’s a nuanced prompt:
Create a vertical infographic for small business owners about cybersecurity risks.
Goal: help readers identify the five biggest risks and prevention steps. Use a professional style. Keep copy concise.
Source material: [paste notes].
Recommend visuals and layout hierarchy.
The second prompt gives Claude actual constraints that ensure a great output.
2. Ask Claude to structure the infographic
Next, ask Claude to build an ‘information architecture’ before you give it a design direction.
Read our guide on visual hierarchy principles to understand how readers scan and process information. Your Claude infographic prompt should ask for:
- One headline
- One subtitle
- 3 to 5 core sections
- One key idea per section
- Suggested visuals for each section
Also, ask Claude to keep the copy visual-first. Here’s a helpful prompt you can work off of:
Keep sections scannable. Limit paragraphs. Recommend where charts, icons, comparisons, timelines or process visuals would work better than text.
This stage usually tells you whether your topic has enough structure for an infographic at all.
3. Generate the layout and visual direction
Layout and design choices come easier when you already know what goes where. Ask Claude for:
- Layout type
- Section order
- Visual hierarchy
- Typography suggestions
- Color palette ideas
- Spacing recommendations
- Icon or chart suggestions
Format matters here because a LinkedIn carousel and a web infographic need different layouts.
Be specific:
Turn this into a 1080×1920 vertical infographic with stacked sections and mobile-friendly spacing.
Or:
Create an SVG/HTML layout for a developer-focused Claude infographic generator workflow.
If you skip format instructions, Claude often defaults to generic layouts.
4. Build or export the design
Now choose the workflow that matches your output.
- Claude Design infographic workflow
Use Claude Design when you want to edit, improve or export visuals. Depending on your access level, you may get export or sharing options for formats like PDF, presentations or editable handoffs.
- Claude Code infographic workflow
Ask Claude Code to generate HTML, CSS or SVG. Export the output into PNG or PDF afterward.
Example:
Convert this infographic into responsive HTML/CSS with editable SVG icons and export-friendly spacing.
- Artifacts workflow
Artifacts work well for quick iterations. Build the draft, preview it, tweak sections and reuse the structure elsewhere.
- In Canva or Figma
You can also take Claude’s structure into design tools for final polish, then use templates, icons, charts and branding elements to finish the design.
5. Refine for clarity and scannability
Your first version probably has too much text. For example, you can ask Claude to:
Reduce copy by 30%. Keep meaning intact. Improve hierarchy and mobile readability.
Then check:
- Can someone scan this in under 30 seconds?
- Are key numbers easy to find?
- Does the hierarchy feel obvious?
- Does contrast support readability?
- Do visuals support the message?
- Did you verify every statistic?
If this infographic is designed to meet marketing goals, add one takeaway or CTA at the end.
What worked better in our testing
Most tutorials about how to make infographics with Claude focus on prompt structure. That’s definitely helpful, but structure alone rarely gets you to a usable final graphic. The workflow that consistently worked better looked like this:
Source material > Structure > Layout > Build > Reduce copy > Export
Claude does a good job with information architecture. You still need judgment for hierarchy, visuals and final polish.
Claude infographic prompt template
Most bad infographic prompts fail before Claude generates a single word.
A strong prompt gives Claude context, constraints and a clear finish line. If you want better layouts, fewer revisions and outputs you can actually export, spend more time on the input.
Here’s a copy-paste Claude infographic prompt template you can reuse for almost any project:
Create an infographic about [topic] for [target audience].
The goal of this infographic is to help readers [learn, compare, decide, remember, sign up, buy, etc.].
Context and source material:
[paste notes, report excerpts, statistics, survey data, article text, spreadsheet findings, research links, or bullet points]Output requirements:
Format: [vertical infographic, LinkedIn carousel, one-page PDF, slide, web graphic, etc.]
Final export target: [PNG, PDF, HTML, SVG, PPTX, etc.]
Tone: [professional, technical, playful, educational, minimal, bold, etc.]
Visual style: [editorial, modern, SaaS, minimalist, data-heavy, colorful, etc.]
Brand or design constraints: [fonts, colors, logo rules, accessibility requirements, etc.]
Maximum copy length: [ex: under 250 words total]Build the infographic using this structure:
- Create one clear headline and short subtitle
- Organize the content into 3 to 5 major sections
- Include one key insight, statistic, or takeaway per section
- Suggest charts, icons, timelines, comparisons, or process visuals where relevant
- Recommend layout direction and section order
- Suggest colors, typography, spacing, and visual hierarchy choices
- Keep the copy concise and optimized for scanning on desktop and mobile
Important constraints:
- Avoid generic visuals or filler copy
- Use only information from the source material where possible
- Flag unsupported claims or statistics that need verification
- Reduce unnecessary text and prioritize visual communication
- Make the output suitable for export in the chosen format
Before finalizing, review the infographic for clarity, hierarchy, readability, accessibility, and visual balance.
Follow-up prompts that improve the output
With AI, your first output rarely is the final product. Usually, it’s the second or third prompts that make the difference. Use these follow-up prompts after Claude generates the first draft:
Turn this into an HTML/CSS infographic that I can export as a PNG.
Make the layout more mobile-friendly and reduce the text by 30%.
Suggest three alternative visual styles for this infographic.
Convert this infographic into a LinkedIn carousel format.
Review this infographic for clarity, hierarchy, accessibility and visual balance.
The point is, each prompt field shapes a different part of the output. Audience and goals shape relevance, format affects layout decisions and source material improves trust and accuracy.
UX Planet’s prompt structure is often a good starting place, but production-ready infographics need more than prompts. Venngage’s AI infographic generator, for instance, adds export, editing and verification steps for polished results.
Related: 80+ AI Prompts for Marketing To Make You 10X Productive
Example Claude infographic workflow
To show how this works in practice, I’ll walk through creating an infographic about the five stages of customer onboarding:
1. Original prompt
Here’s the exact prompt:
Create a vertical infographic about the 5 stages of customer onboarding for SaaS marketers.
Goal: explain each stage clearly and help teams identify friction points.
Audience: growth marketers and customer success teams.
Style: clean, editorial, data-focused.
Format: 1080×1920 vertical infographic.Structure requirements:
- Create one headline and subtitle
- Include 5 stages
- Keep sections concise
- Recommend visuals for each stage
- Suggest hierarchy, spacing and icons
- Make the output suitable for PDF export
Source notes:
[paste onboarding notes, customer feedback, support pain points or internal documentation]
2. Claude’s suggested structure
Here’s the structure Claude returned based on the prompt:
Title: The 5 Stages of Customer Onboarding
Subtitle:A practical framework for growth and success teams to reduce friction, accelerate time-to-value, and build lasting retention.
Sections:
- Welcome & Activation
- First Value Moment
- Habit Formation
- Expansion & Depth
- Advocacy & Retention
3. Final layout direction
At this stage, move from content to design decisions. Recommended layout:
- Vertical 1080×1920 format
- Large hero title section
- Five stacked cards connected with a progress line
- One icon per stage
- Consistent spacing between sections
- CTA block at the bottom
4. Export method
Different workflows create different outputs.
- Using Claude Design: Generate the layout, refine sections visually, then export or share depending on available options.
- Using Claude Code: Ask for HTML or SVG output. Example: Turn this infographic into responsive HTML/CSS with editable SVG elements. From there, open it in a browser and save it as PNG or PDF.
- Using design tool handoff: Copy Claude’s structure into your design editor (e.g., Figma) and use templates, icons, charts and brand colors to finish the design.
5. Refinement notes
The first draft looked decent. The refined version worked better. Here’s what I changed:
- Reduced text by roughly 30%
- Replaced generic icons with onboarding-specific visuals
- Improved spacing between sections
- Shortened headings for mobile readability
- Increased contrast for readability
- Verified supporting claims and examples
For me, this prompt helped a lot:
Reduce repetition, tighten hierarchy and shorten each section to one core takeaway.
Here’s how the final result looked like:
Customer Onboarding
What I learned from this iteration
What worked:
- Clear source material improved structure
- The constraints I provided improved layout quality
- Visual suggestions improved design precision
- Export instructions created more usable outputs
What failed:
- The first version had too much text
- The icons Claude suggested felt generic
- Section hierarchy needed manual edits
- The first layout draft looked crowded on mobile
Claude Design vs Claude Code for infographics
Claude Design works better when you want polished visuals and faster editing. On the other hand, Claude Code works better when you want control over layouts, HTML or export flexibility.
Your choice mostly depends on whether you think visually or technically.
Anthropic recommends Claude Design as a workflow for prompts, document and image imports, collaboration, fine-grained editing controls, exports and Claude Code handoffs.
Similarly, UX Planet’s Claude Code workflow guide suggests that code-first infographic workflows are becoming more common.
Can you download Claude infographics?
Yes, but the download path depends on how you built the infographic in the first place.
A lot of frustration around downloads comes from assuming every Claude workflow exports the same way. Well, they actually don’t.
Your export options change based on whether you used Design, Code, Artifacts, skills or a handoff workflow.
Download and export paths by workflow
1. Claude Design
If you build your infographic inside Claude Design, you’ll usually have the most export flexibility.
According to Anthropic’s Claude Design announcement, Claude Design supports exports and handoffs such as:
- PDF exports
- PPTX exports
- Standalone HTML files
- Folder exports
- Organization share links
- Design-tool handoffs
Anthropic also offers support for document uploads, image imports, collaboration tools and direct handoffs into code workflows. However, the export availability varies by account type and workspace settings.
Best for: People who want shareable deliverables without extra conversion work.
2. Claude Code
A Claude Code infographic workflow gives you more control but usually adds one extra step. Common outputs include:
- HTML
- CSS
- SVG
- Interactive layouts
- Responsive designs
From there, you’ll typically:
Generate code > Open in browser > Export as PNG or PDF
If you want editable graphics later, SVG outputs usually age better than screenshots.
Best for: Developers, technical marketers and web-based graphics.
3. Artifacts
Artifacts sit somewhere in the middle.
You can preview outputs, tweak structure, copy layouts and adapt sections into other tools. Export behavior changes depending on interface updates and feature availability.
Think of Artifacts as a drafting workspace more than a finished export workflow.
Best for: quick prototypes and iteration.
4. Claude skills
Claude skills don’t follow one export workflow because output formats differ between skills. Some skills create:
- Structured layouts
- HTML outputs
- SVG instructions
- Repeatable design systems
- Formatting rules
If you’re experimenting with community-created skills or marketplace options, check the documentation before assuming export support.
Best for: Repeatable processes and team workflows.
5. Canva or Figma handoffs
For most teams, this is probably the safest route. You can move your structure into design software when you need:
- PNG exports
- PDFs
- Presentation decks
- Social media graphics
- Editable design files
One important caveat
Export behavior changes often. What you can access depends on a mix of product plans, admin settings, and rollout timing. Therefore, don’t assume your workspace will match someone else’s.
A better question than “Can I download this?” is:
What file format do I need at the end?
Work backwards from there. That way, your workflow is much clearer.
Can you make Claude infographics for free?
Yes, but with a few tradeoffs.
The cheapest way to create infographics with Claude is to use it for structure, copy and layout direction, then finish the visual work in a free or low-cost design tool.
Here’s the reality:
- Some Claude features work on free accounts, but usage limits apply.
- Access to Claude Design varies by rollout stage, plan access and plan type like Pro, Max, Team or Enterprise.
- Claude Code workflows may require subscriptions, setup work or technical knowledge.
- Feature access changes often, so what exists today may look different later.
Low-cost workflows that actually work
- Structure first, design later: Use Claude for hierarchy, layout ideas, and visuals, then finish the design in free tools like Google Slides or Figma.
- Generate HTML or SVG: Prompt Claude for export-friendly code outputs, then open and export them manually for more technical workflows.
Best practices for better Claude infographics
Claude works well with structure and layout ideas. But you still need to think like an editor and review like a designer.
Here are a few points you can use to improve results fast:
- Give Claude source material, data, notes or report excerpts instead of broad topics
- Ask for hierarchy before asking for visuals
- Limit the infographic to 3 to 5 major sections
- Define the format and export target early
- Ask for chart, icon or visual recommendations for each section
- Use real numbers and include sources
- Tell Claude to cut copy length before exporting
- Verify claims manually before publishing
- Check readability on mobile screens
- Move the draft into design tools when you need stronger visual polish
Before publishing, I suggest you review for visual hierarchy, contrast, brevity, and accessibility because those details shape readability.
Read our guide to design principles to learn more about fundamentals behind stronger visual design.
Quick pre-publish checklist
Before exporting your infographic, ask:
- Can someone understand the message in under 30 seconds?
- Does each section have one clear takeaway?
- Are statistics verified and sourced?
- Does the layout still work on mobile?
- Are colors and text easy to read?
- Did you remove extra words?
- Does the ending include a takeaway or CTA?
Limitations of Claude for infographics
After testing Claude and reviewing community workflows and tutorials, I noticed a few limitations that appeared repeatedly:
1. Layouts can feel generic
Claude often defaults to familiar structures.
You’ll see stacked cards, timeline layouts and predictable icon suggestions unless you give strong visual direction. Specific instructions around hierarchy, spacing and style usually improve the output.
2. Statistics need cross-verification
Claude can hallucinate numbers, invent sources or confidently summarize bad information.
If you’re creating reports, marketing assets or data-heavy visuals, verify every number manually before publishing.
3. Complex data can be messy
Messy spreadsheets, large datasets and advanced visualizations still need work.
Multi-axis charts, dense comparisons and technical diagrams often require manual editing after generation.
4. Brand consistency takes extra work
Claude can follow brand rules if you provide them.
But the outputs often look generic without very specfic brand guidelines, typography rules, logo files or layout guidance.
5. Export workflows vary
Some workflows export easily. Others require conversion steps.
Product plans, rollout stages, workspace permissions and product updates all affect export options. Build your process around the final format you need instead of assuming every workflow supports direct exports.
6. Accessibility needs human review
Claude can recommend layouts. It doesn’t reliably review accessibility for you. Check:
- Color contrast
- Font sizes
- Mobile readability
- Icon clarity
- Screen-reader considerations
- Information hierarchy
These checks matter more than most prompt tweaks.
Related: Top 18 AI Accessibility Tools to Boost Web Inclusion
7. Practice caution with sensitive data
If you’re building internal reports or customer-facing assets, review company rules before uploading source material.
After testing Claude for infographic work, I kept reaching the same conclusion: the structure is often stronger than the finished visual output. Users in forums like Reddit discussions, Indie Hackers and LinkedIn also complain about Claude’s generic outputs, export limitations and the need for frequent manual tweaks.
When you shouldn’t use Claude alone
Avoid relying on Claude alone for:
- High-stakes reports
- Regulated claims or compliance content
- Complex data visualizations
- Print campaigns with exact specifications
- Brand-sensitive materials with strict guidelines
Who should use Claude for infographics?
Claude works well for anyone who needs to turn messy information into visual structure fast. The better question is which workflow fits your role.
1. Marketers
Marketing teams usually need speed. Use Claude for:
- Social media graphics
- Campaign visuals
- Research reports
- Webinar assets
- Content repurposing
Recommended workflow: Claude Design or structure-first workflows with template handoffs.
2. Bloggers and content teams
Long-form content already contains infographic material. Use Claude to:
- Turn information into visual summaries
- Come up with statistics
- Create process graphics
- Build comparison layouts
Recommended workflow: Prompt > structure > template handoff.
3. Product Managers
Product work creates information overload fast. Use Claude for:
- Feature explainers
- Product roadmaps
- User journey visuals
- Documentation graphics
Recommended workflow: Claude Design for collaboration or Artifacts for quick drafts.
4. Founders
Founders spend a lot of time explaining the same ideas repeatedly. Use Claude for:
- Pitch visuals
- Product summaries
- Feature comparisons
- Investor materials
Recommended workflow: Claude Design with presentation or PDF exports.
5. Educators and trainers
Teaching content already follows hierarchy. Use Claude for:
- Chapter summaries
- Study guides
- Process explainers
- Workshop materials
Recommended workflow: Structure-first workflows with presentation-friendly exports.
6. Designers
Designers don’t need Claude to design. They often need Claude to explore. Use it for:
- Layout directions
- Information hierarchy
- Headline options
- Alternate visual concepts
- Content reduction
Recommended workflow: Use Claude as an ideation layer before moving into production tools.
7. Developers and technical teams
Some infographic projects, such as data infographics, need code more than drag-and-drop editing.
Use Claude for:
- HTML visualizations
- SVG graphics
- Data visualizations
- Interactive graphics
Recommended workflow: Claude Code.
Why should you choose Venngage over Claude for Infographics?
If your workflow ends at structure, Claude might be enough. If your workflow ends with a polished infographic, presentations, social graphics or downloadable assets, Venngage usually removes extra steps.
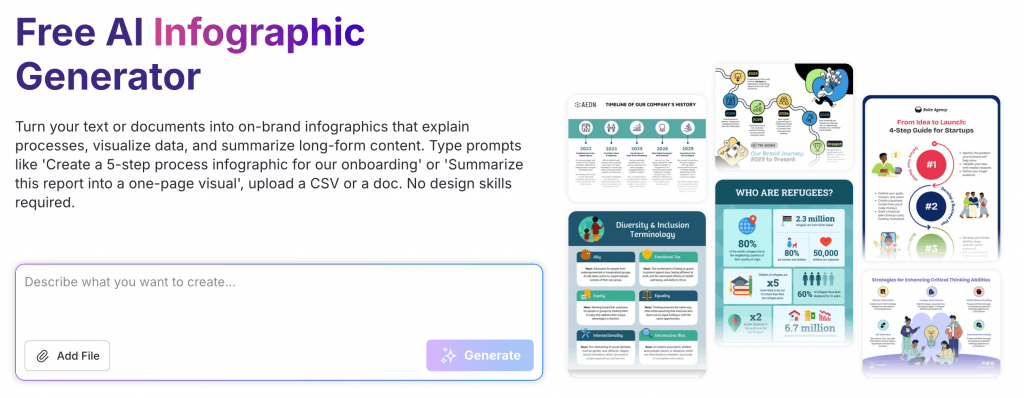
For example, the Venngage’s AI Infographic Generator turns prompts into editable layouts, then gives you tools to refine copy, visuals, icons and branding in the same workflow.
You also get access to thousands of infographic templates, export options like PNG and PDF, collaboration features and access to Brand Kit that eliminates manual work.
FAQs about Claude infographics
Here are answers to some of the most commonly asked questions about designing infographics with Claude.
1. What is the best Claude tool for infographics?
Claude Design works best for polished infographic creation. Claude Code works better for HTML, SVG and custom layouts. Artifacts suit quick drafts, while skills help automate repeatable infographic workflows.
2. Can Claude make infographic images directly?
Yes, sometimes. Claude can generate layouts, design instructions, code and visual structures, but direct image creation and export options depend on the Claude product, plan and workflow.
3. Can I export a Claude infographic as PNG or PDF?
Yes, but export methods vary. Claude Design may support PDF exports or design-tool handoffs. Claude Code infographic workflows usually require converting HTML or SVG outputs into PNG or PDF.
4. Is Claude better than Canva for infographics?
Claude is great for structure, copy and layout. Canva is good for visual editing and exports. Many people create infographics in Claude then finish the design elsewhere. If you’re looking for more options, check out our guide to Canva alternatives.
5. Do I need Claude Code to create infographics?
No. Non-technical users can use Claude Design, Artifacts or prompt-based workflows. Claude Code mainly helps developers build HTML, SVG or custom infographic layouts.
6. Are there Claude infographic skills?
Yes. Some Claude infographic skill libraries and marketplaces offer templates for layouts, visual summaries and reusable workflows. Review documentation, trust signals and output formats before using them.


