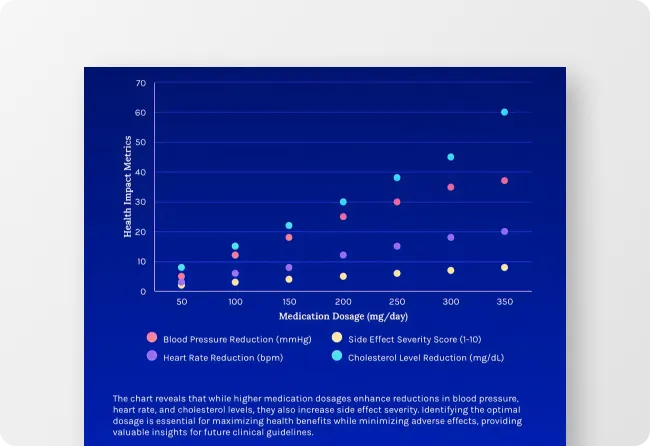
Free AI Chart Generator
Struggling with complex data visualization? Our AI Chart Generator lets you prompt, create, and customize charts that transform raw data into clear, compelling visuals—perfect for reports, diagrams, and presentations.
Discover an extensive range of chart designs
AI-Powered Tools
How to write a prompt that generate the charts you want?
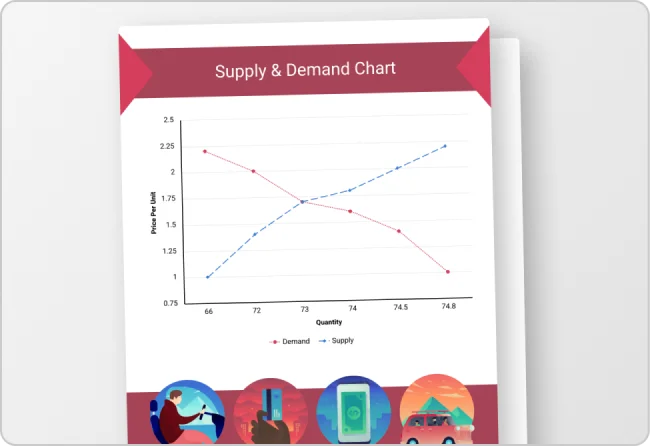
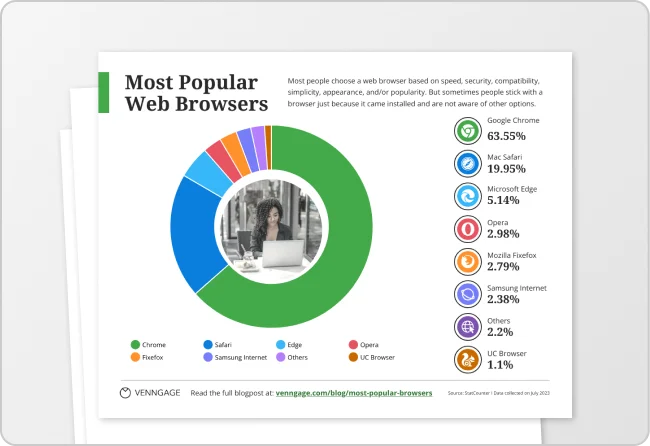
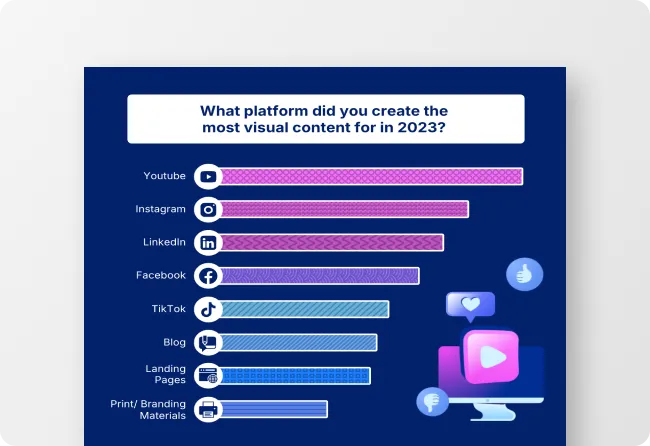
Specify the Chart Type:Clearly state the chart type needed (e.g., bar, line, pie, scatter) and its orientation. Mention any specific data representation like percentages or comparisons.
Detail the Design Elements:Describe desired visual styles and elements such as color schemes, minimalist or detailed designs, and include essentials like legends, labels, and titles.
Mention the Intended Use:Explain the purpose and context of the chart. Indicate the target audience to ensure the design suits its intended viewers, whether for business, education, or personal use.
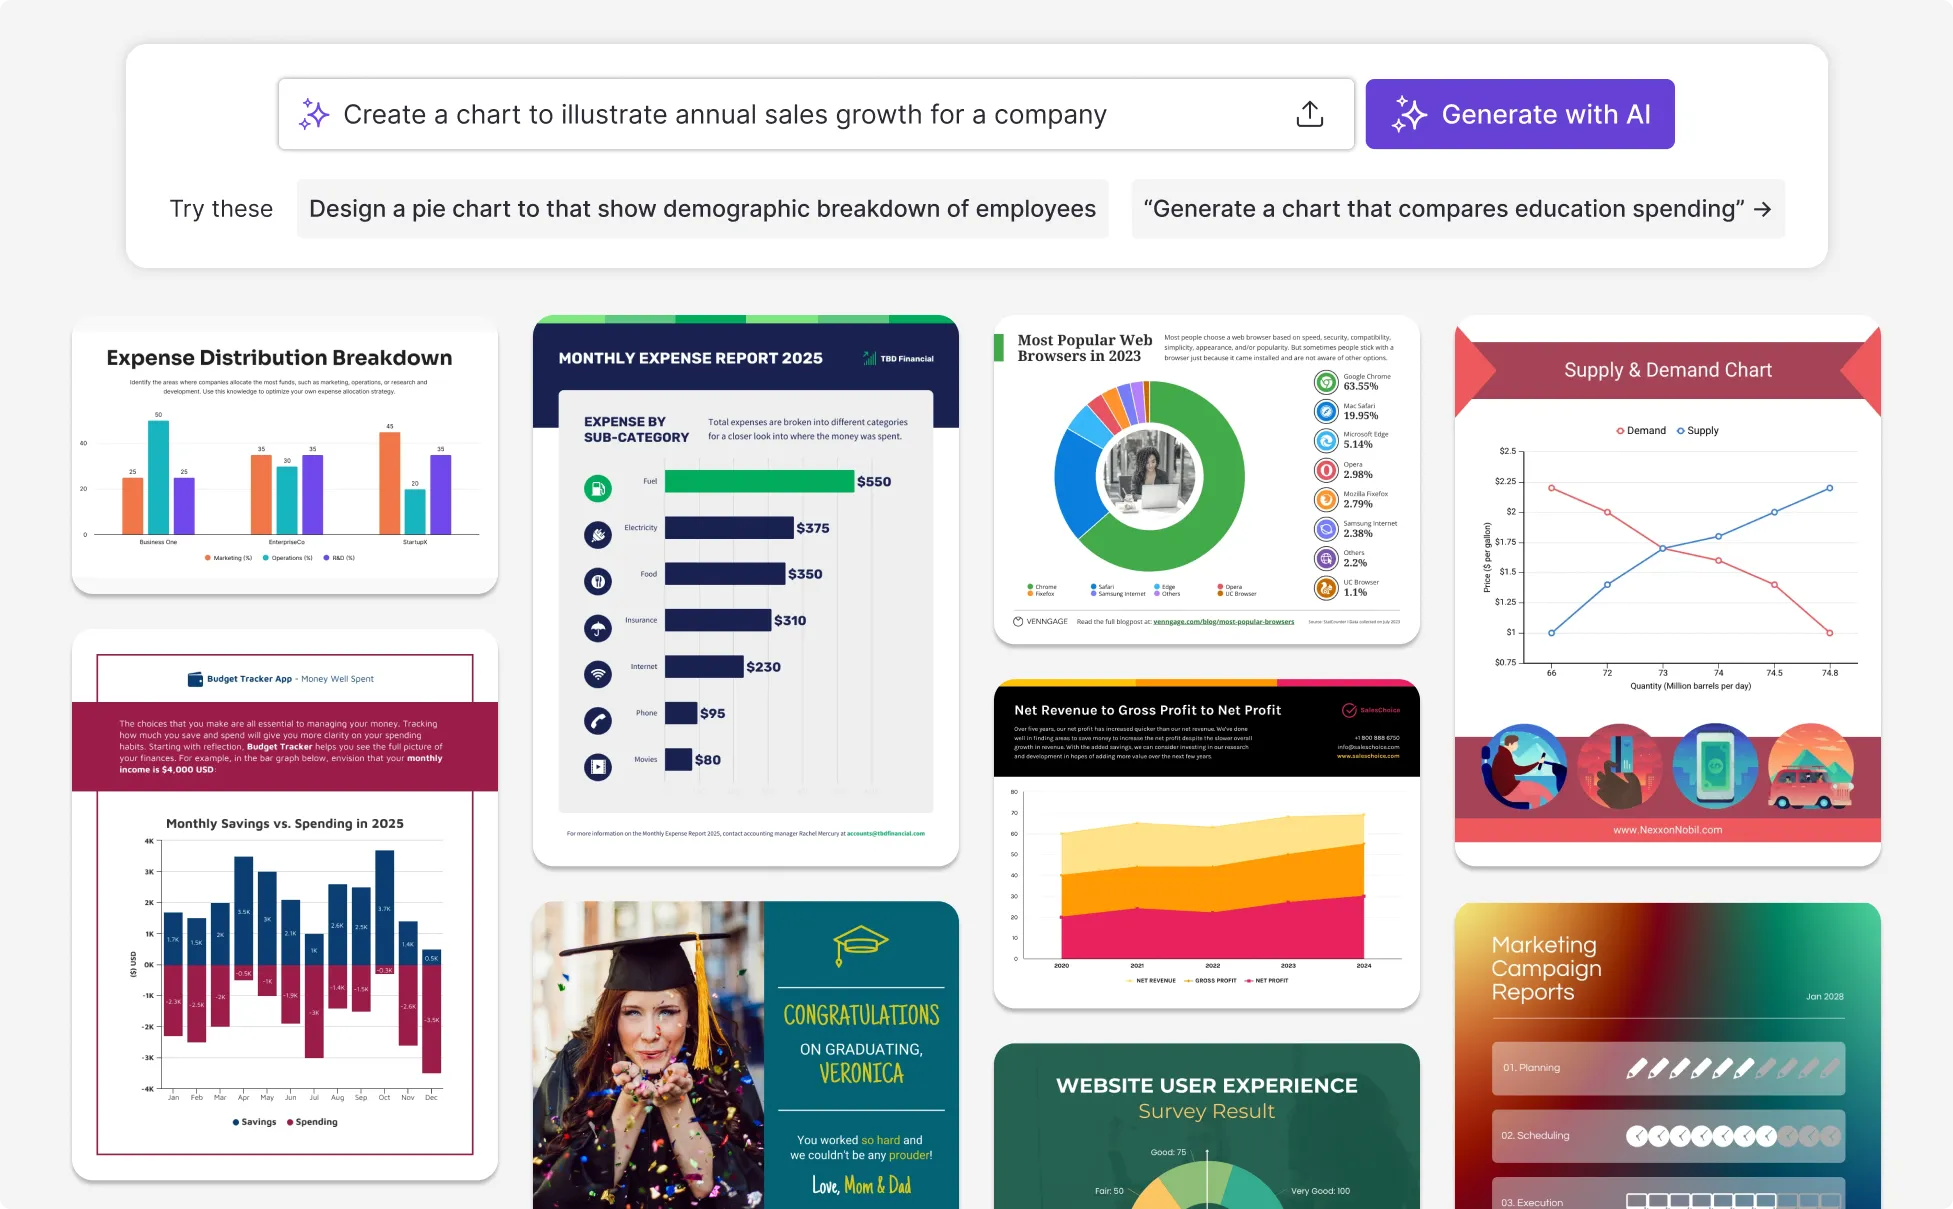
Sample prompts you can modify and use
“Global Renewable Energy Usage Chart: Create a chart showcasing renewable energy usage by country, highlighting solar, wind, hydroelectric, and biomass with symbols and colors.”
“Annual Sales Growth Comparison Chart: Illustrate annual sales growth over five years by product lines or regions using bar or line charts with distinct colors.”
“Employee Demographics Pie Chart: Display employee demographics by age, gender, and ethnicity in a pie chart, using diverse colors and interactive legends.”
“Education Spending by Country Chart: Compare education spending as GDP percentages across countries using bar charts with blue shades and contextual icons like graduation caps.”
How to create a chart using AI
Step 1: Define Your Chart’s Purpose
Clarify your chart's goal—whether for a business event, celebration, or appreciation. Input your objective to guide the AI in customization.
Step 2: Choose Style and Tone
Pick a design style and tone that match your purpose, from vibrant to professional, and select the right format like pie or bar charts.
Step 3: Write an AI Prompt
Craft a clear prompt by defining your message, audience, style, and key points. This guides the AI to create a standout chart.
Step 4: Edit and Customize
Customize the chart by tweaking layout, text, and visuals. Use editing tools to ensure it matches your vision perfectly.
Step 5: Download and Share
Export your chart in the desired format and share easily via links or other options for greater reach and collaboration.
Say Goodbye to Manual Chart Design
Stop spending hours adjusting chart layouts. Venngage’s AI Chart Generator instantly turns your data into clean, professional visuals that are ready for reports, decks, or dashboards.
Easily customize colors, labels, and fonts—no need to start from scratch. With dynamic visuals and smart design elements, your charts do more than inform, they stand out and stick with your audience.
Generate A Chart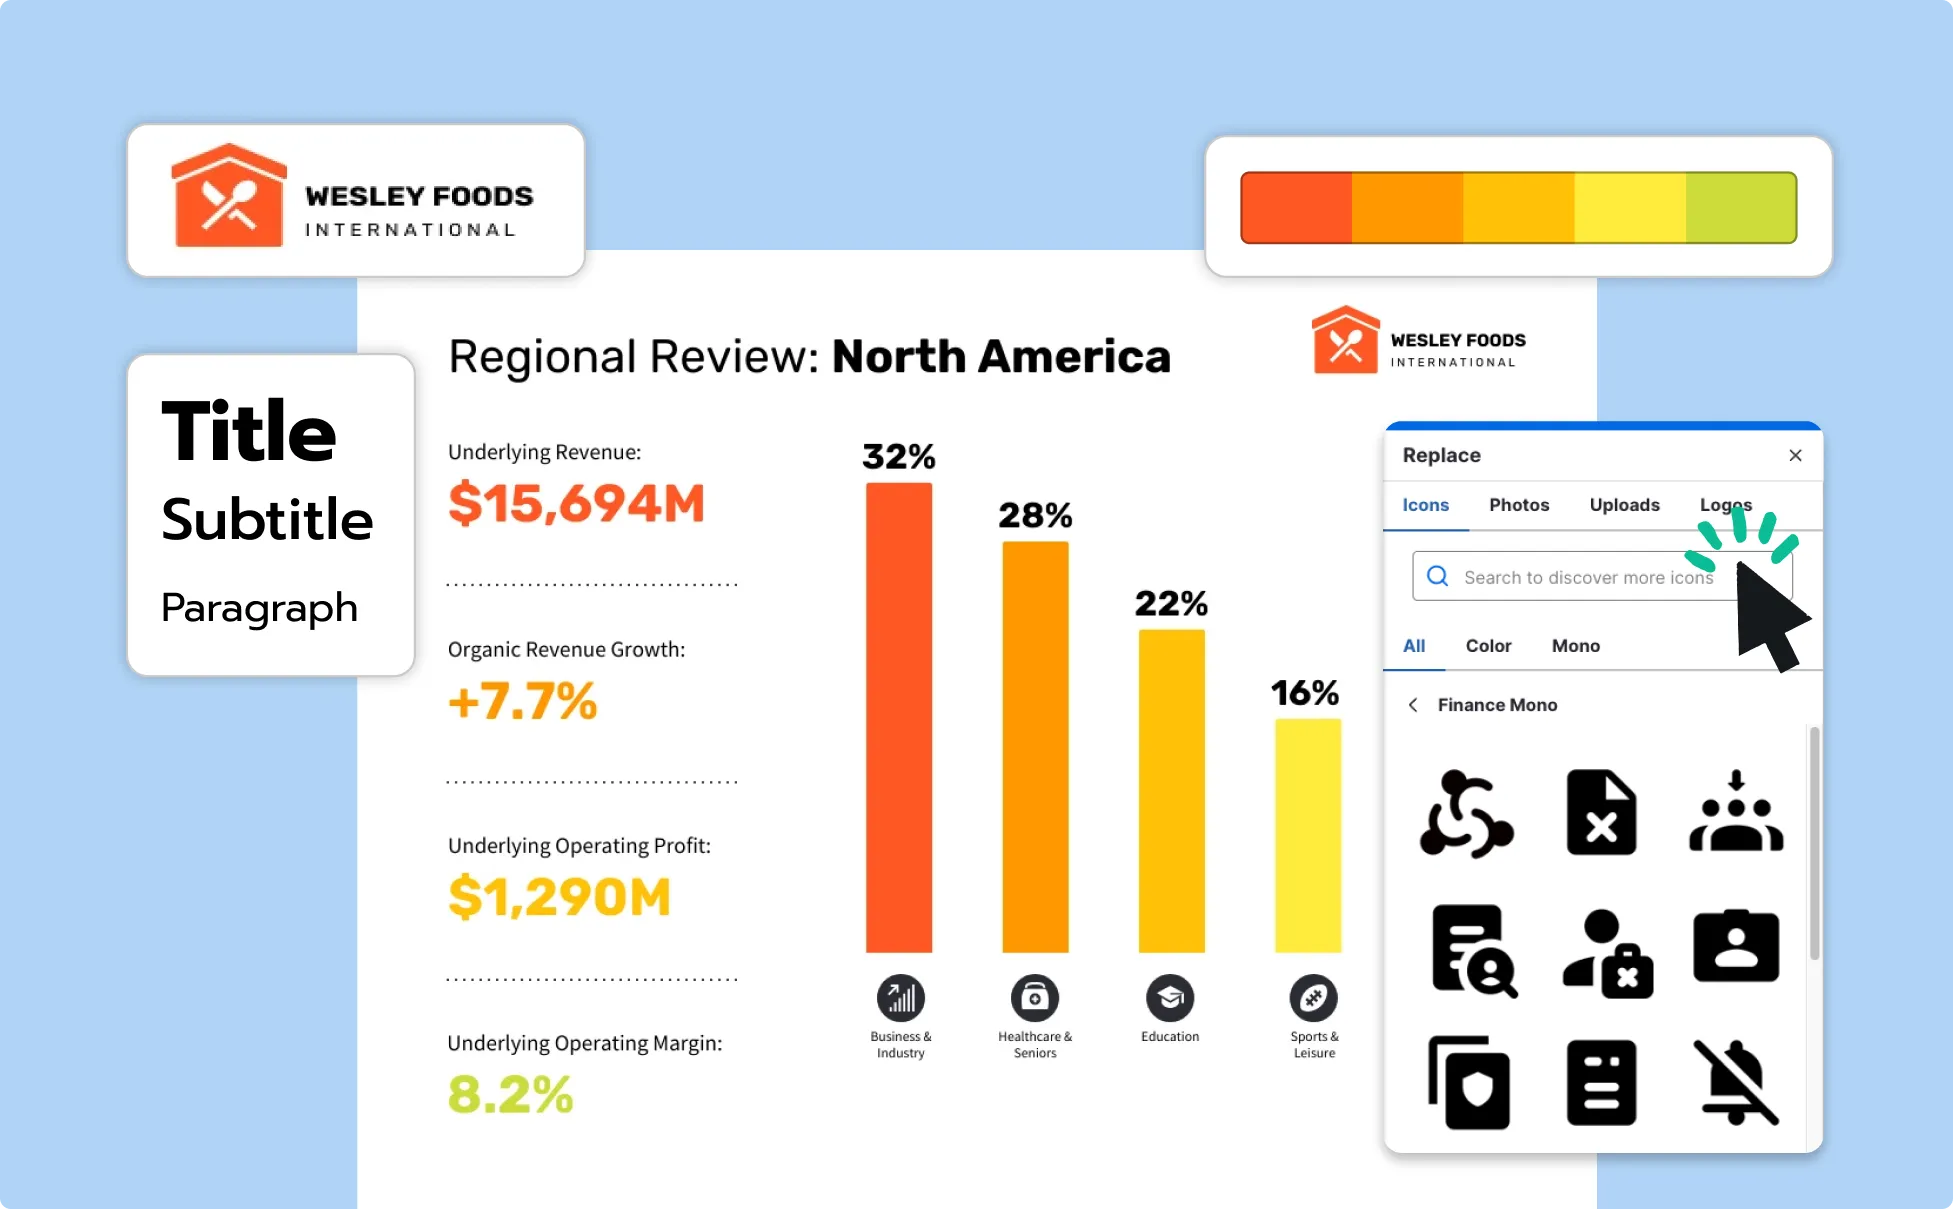
Let Your Data Speak Loud and Clear with AI-Designed Charts
Let your numbers do the talking. With Venngage’s AI-powered chart generator, you can input just a few key insights and let generative AI handle the design, layout, and formatting.
Perfect for highlighting trends, showcasing performance, or simplifying complex metrics, our intelligent visualization tools make it easy to turn data into visuals that actually resonate.
Generate A Chart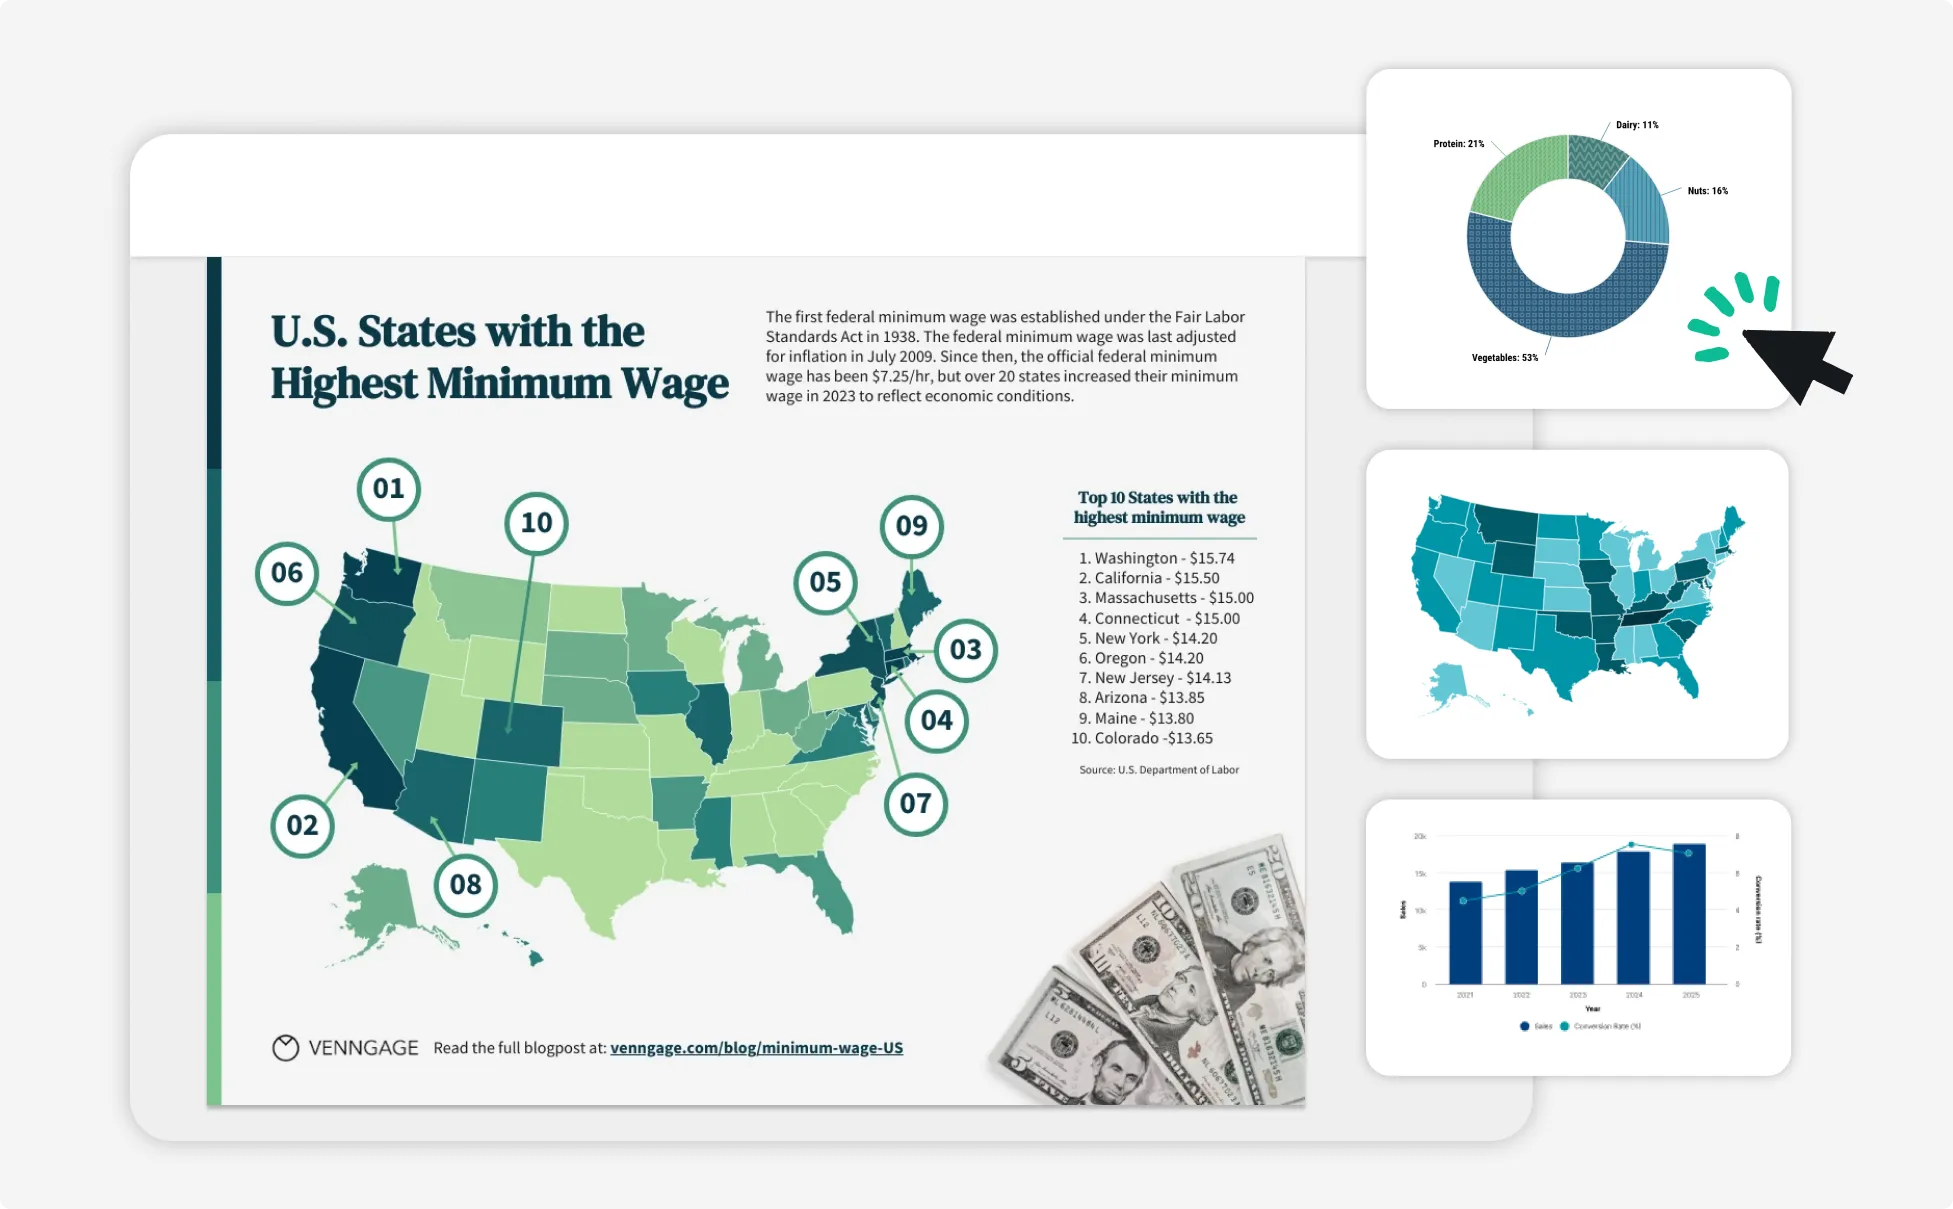
Keep Every Chart On-Brand and Visually Cohesive with AI
Say goodbye to inconsistent visuals and awkward formatting. Venngage’s AI Chart Generator instantly turns your data into sleek, on-brand charts—no design skills needed.
Whether you’re creating one chart or fifty, AI ensures every visual stays polished, consistent, and aligned with your brand style or personal aesthetic.
Generate A Chart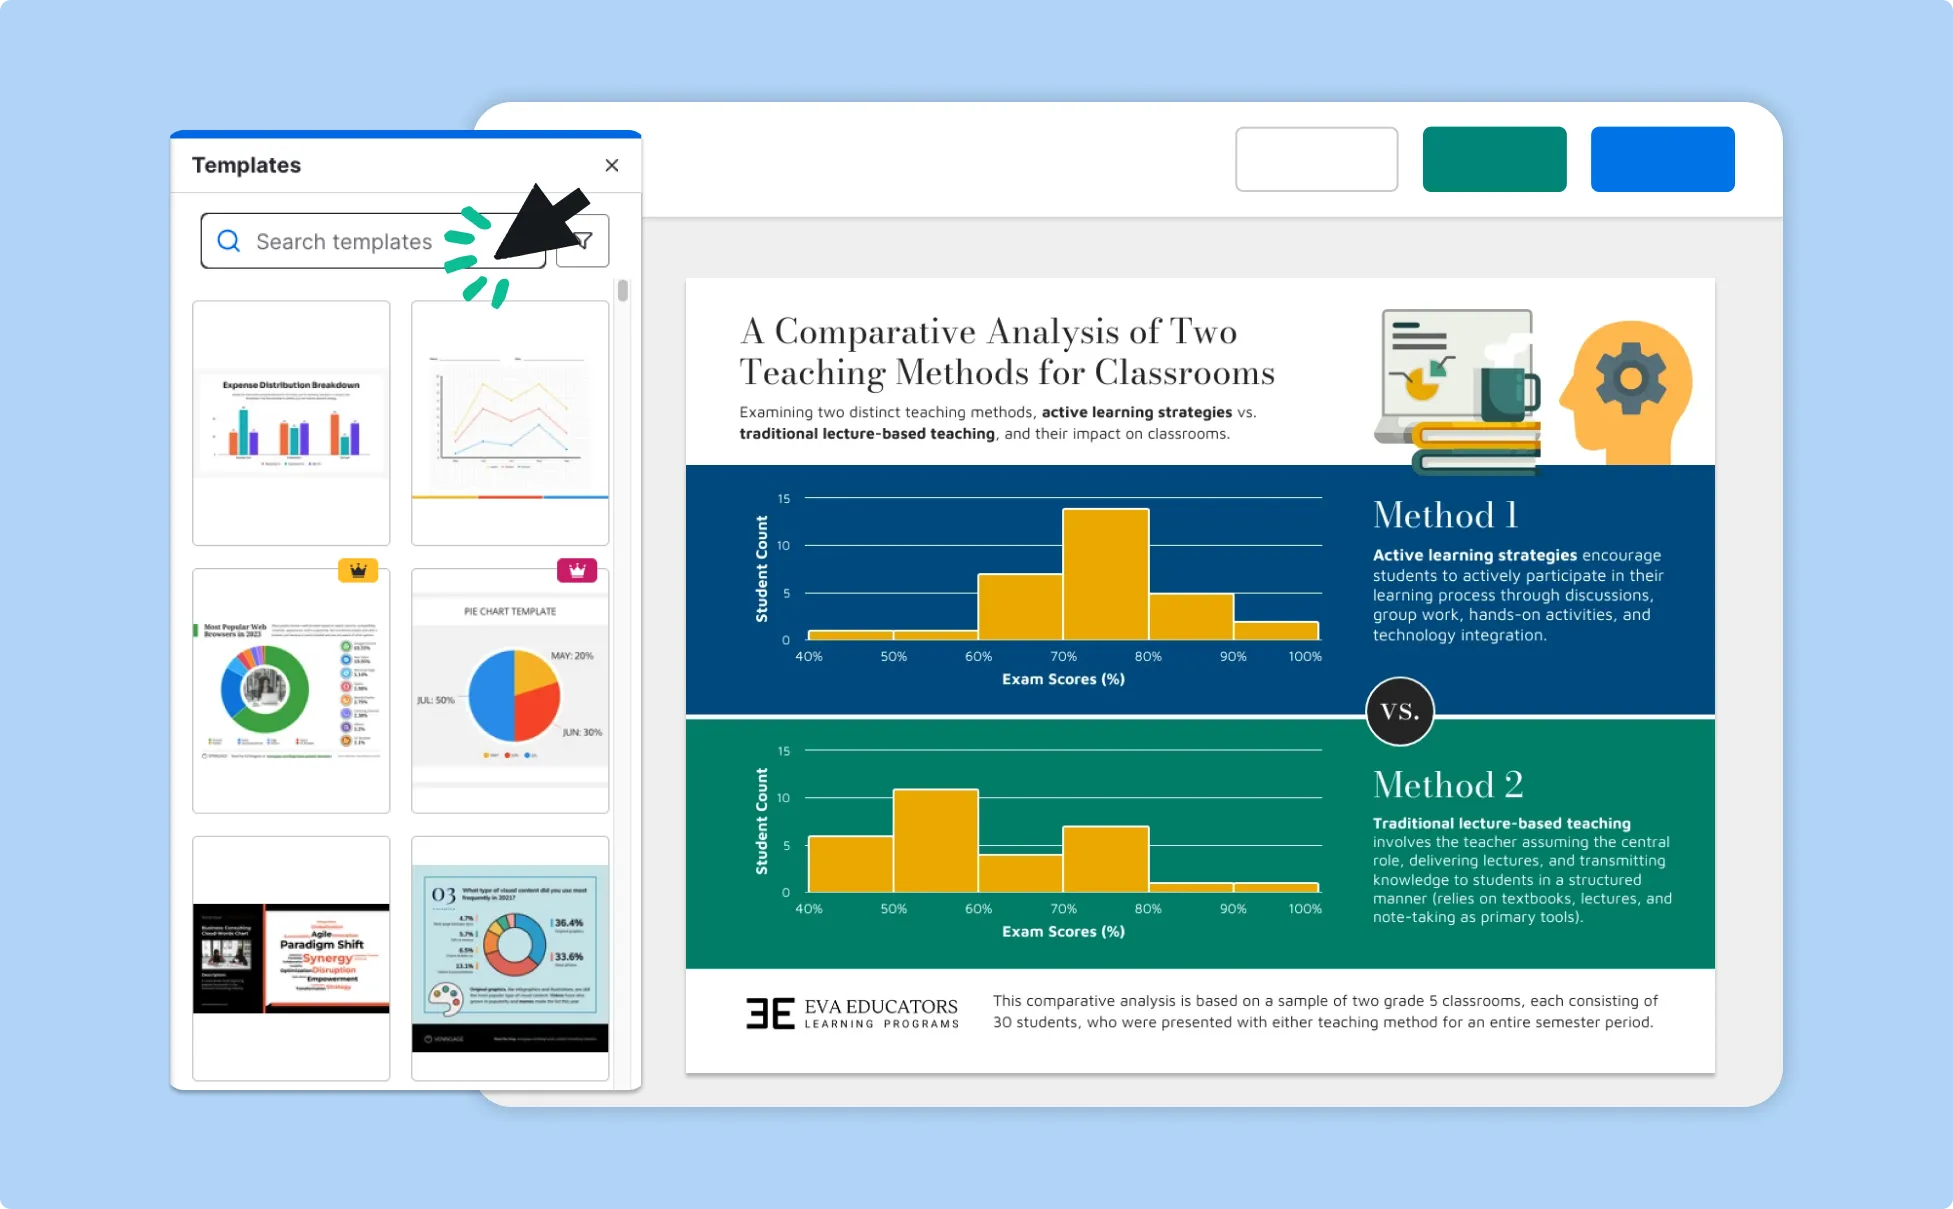
Fuel Your Creativity with AI-Powered Design Tools
Venngage is your one-stop shop for creating impactful presentations, infographics, reports, and more. It's a favorite among professionals, educators, and marketers for a reason:
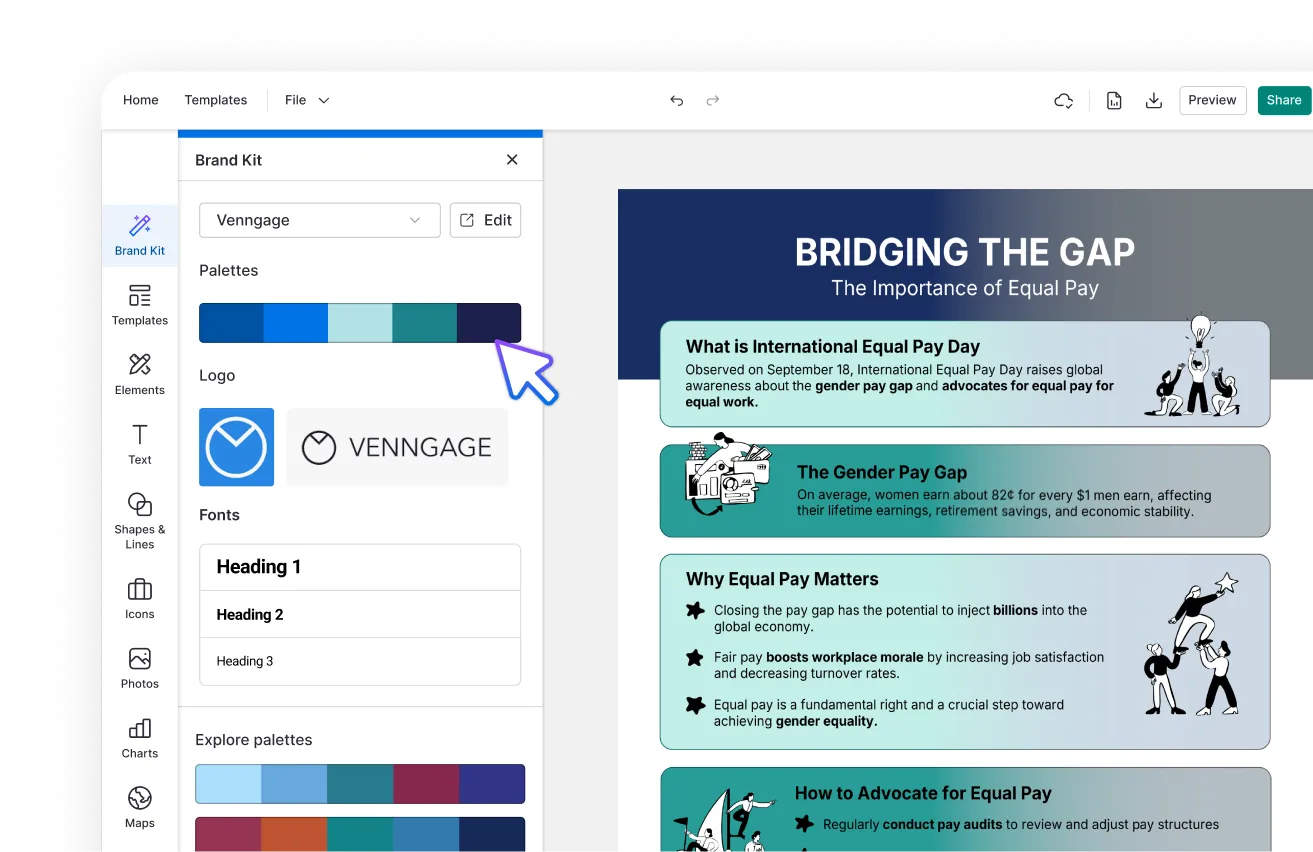
AI Branding Automation
Instantly extract brand colors, fonts, and styles. Auto-apply your logo and visual identity to every design for seamless brand consistency.
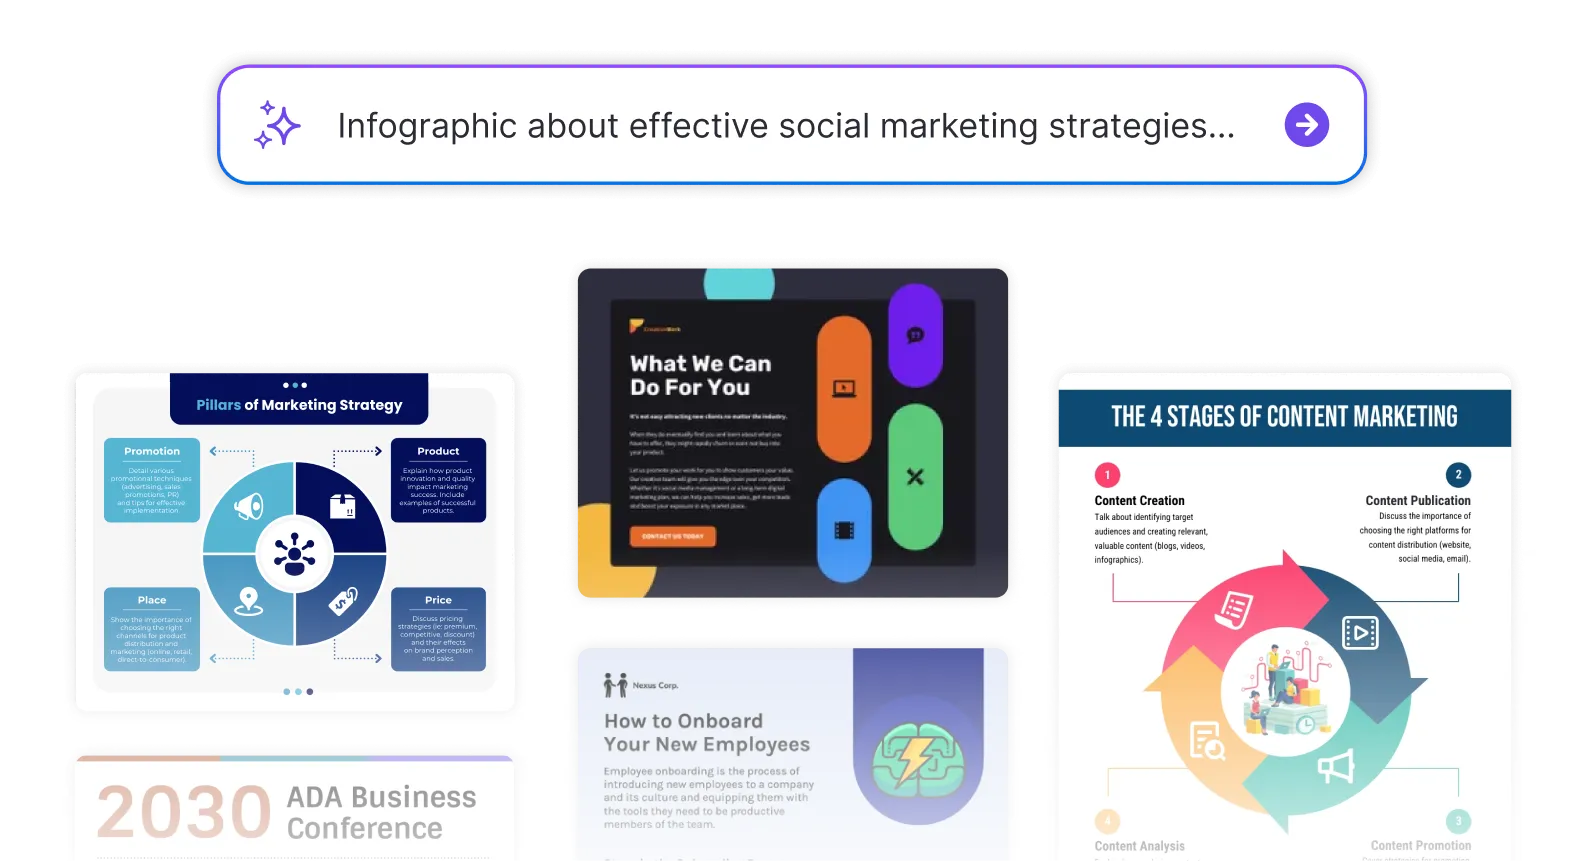
DesignAI Generator
Turn simple prompts into stunning professional visuals in seconds. Describe what you need in plain language and watch our AI generate layouts optimized for maximum visual impact.
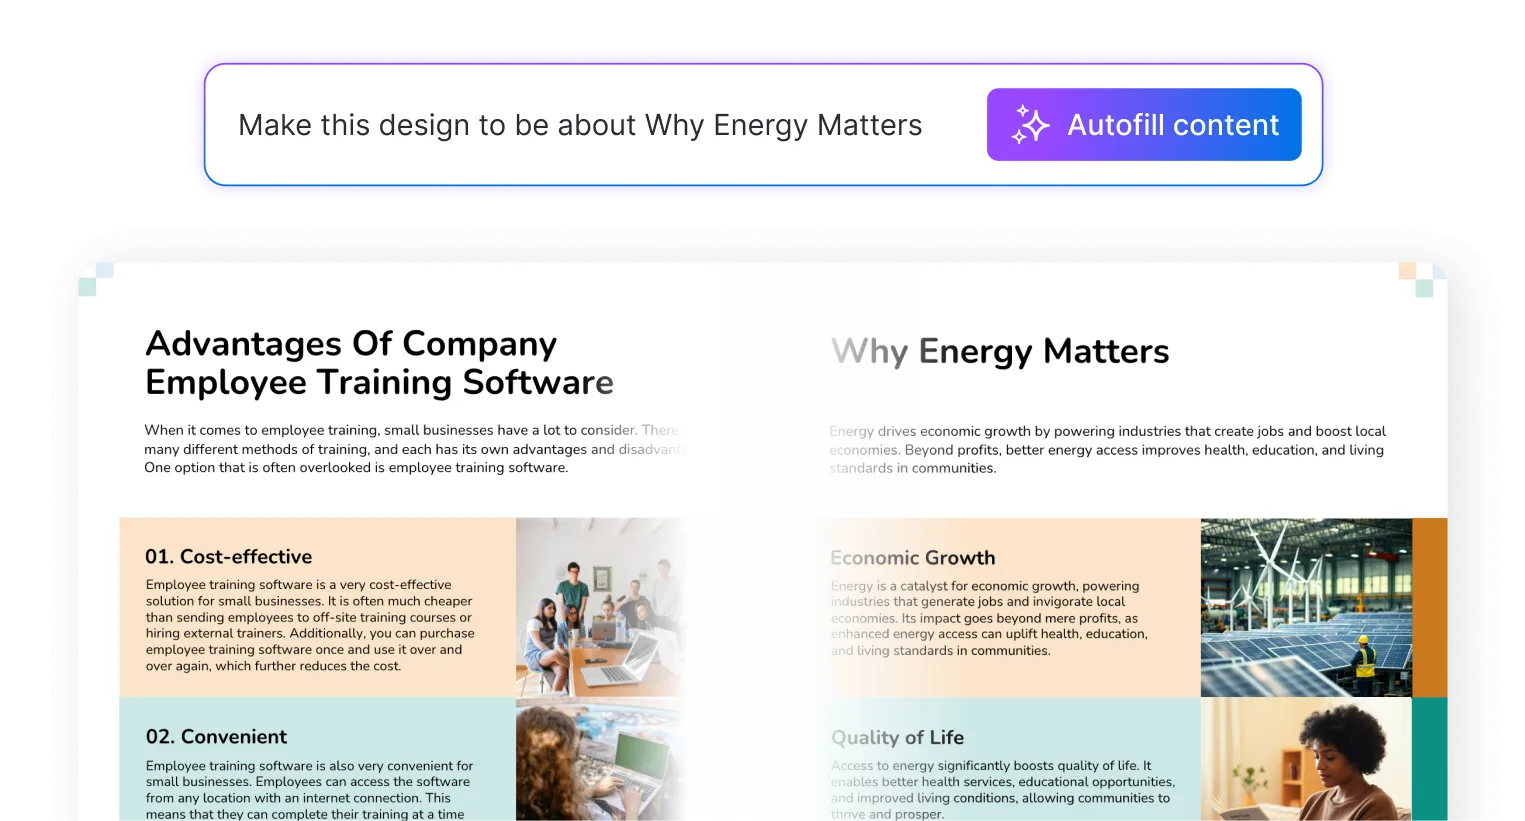
AI Content Auto-Fill
Kickstart your design process in seconds. Choose a template and let our AI auto-fill it with relevant, on-brand content, ideal for streamlining workflow and boosting productivity.
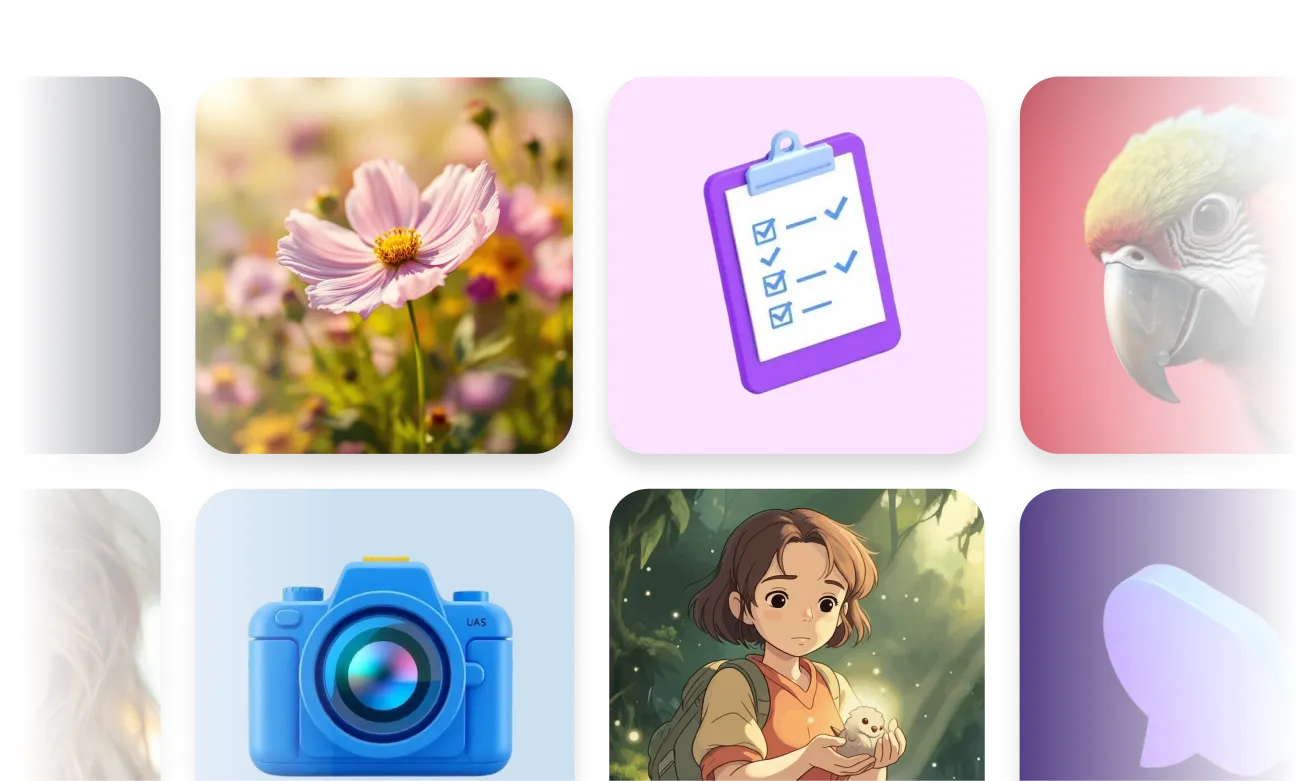
AI Generated Icons and Images
Create unique visuals that perfectly match your content and style. Generate custom illustrations, icons and images that align perfectly with your brand.
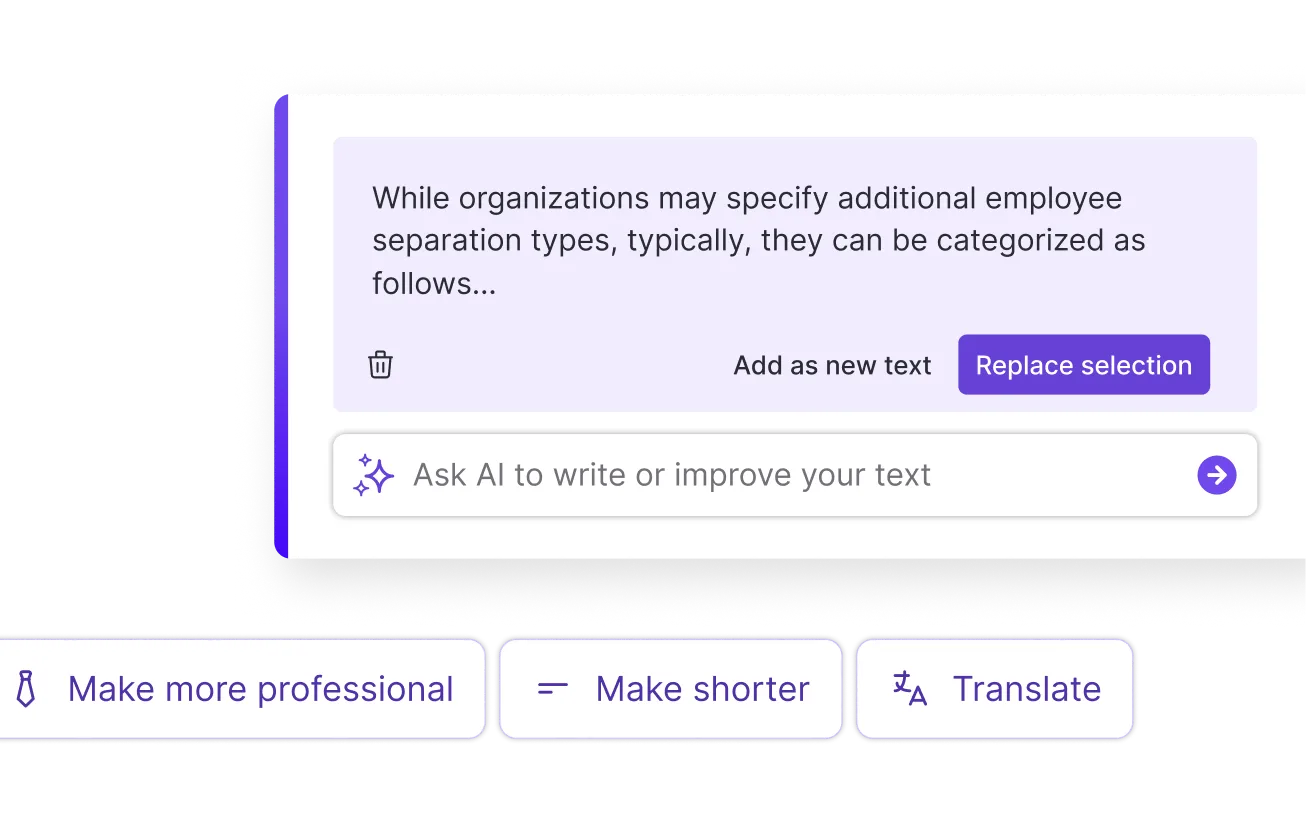
AI Writer and Translation
Enhance clarity, rewrite content, and instantly translate text to create accessible, global-ready visuals.
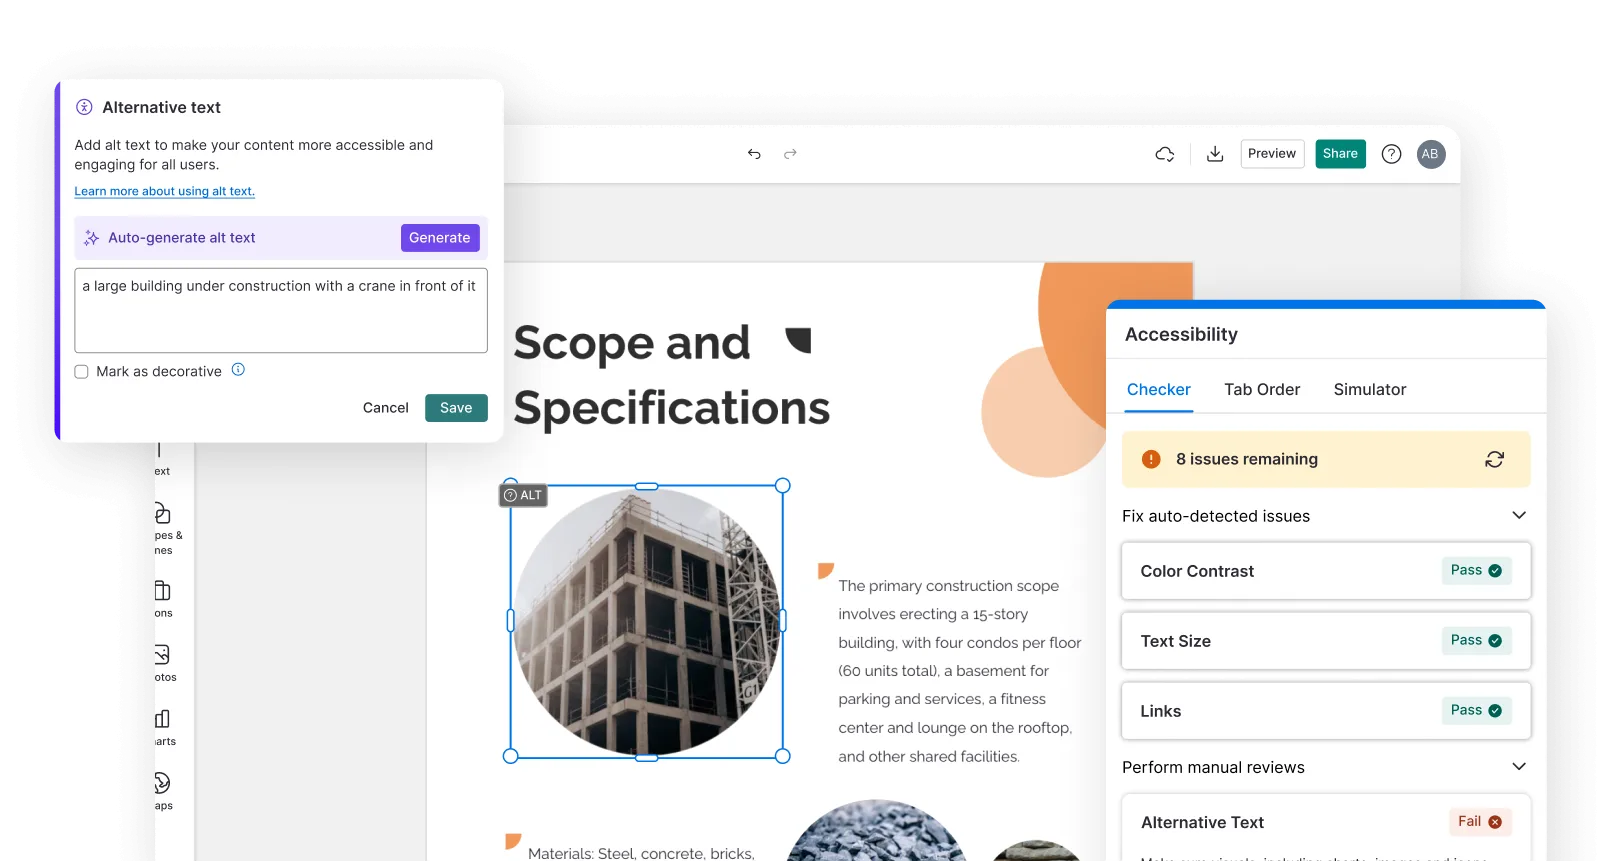
Smart Accessibility AI
Ensure every project looks great and works for everyone. Use AI to write alt text check contrast, layout, and font readability, and export fully WCAG-compliant visuals and PDFs.
What Our Customers Say
Very good Swiss Army knife for designers. Great to find inspiration, but also a good tool in and of itself.
FAQs
Yes, you can fully customize all AI-generated templates on Venngage's platform.
Yes, Venngage offers a wide variety of chart designs to suit different needs and preferences. Whether you're looking for something sleek and modern, or more detailed and data-focused, you'll find numerous options to choose from in our extensive template library.
Yes, the AI-generated charts created using Venngage's tools are copyright-free. You can use them for both personal and commercial purposes without any restrictions on copyright. However, it's always good practice to ensure that any externally sourced content you include is also cleared for use.
We offer a free plan so you can try out all our AI features without spending anything. If you want more advanced features like private sharing and auto branding, we've got Premium and Business plans available too.
ChatGPT helps you craft the perfect prompt for your chart, but it doesn’t generate visualizations directly. Think of it as your smart assistant for planning. Once the prompt is ready, our AI chart generator brings your data to life with just a click.
You can easily import data from CSV and XLSX files. We support these popular formats to ensure a smooth and seamless chart creation experience, no data wrangling required.
You can download your chart in just one click—PDF for print, PPTX for presentations, HTML for embedding, and PNG for quick visuals. Each format is optimized to fit different sharing and display needs.
Yes! Choose from templates tailored for finance (budget reports), marketing (campaign dashboards), and education (student progress charts). We’re constantly adding more, so you’ll always have a time-saving starting point.
