
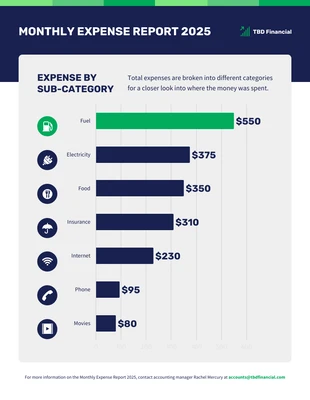
Monthly Expense Report Bar Graph Template
Create an informative material for your business organization by using this Bar Graph Template from Venngage.

 100% customizable templates
 Millions of photos, icons, charts and graphics
 AI-powered editing features
 Effortlessly share, download, embed and publish
 Easily generate QR codes for your designs
- Design stylemodern
- Colorslight
- SizeLetter (8.5 x 11 in)
- File typePNG, PDF, PowerPoint
- Planbusiness
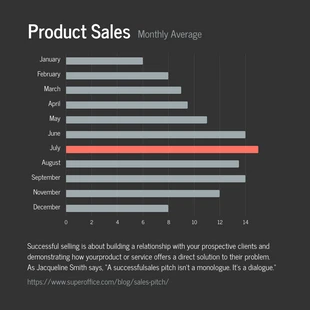
Are you looking to communicate important business information to your clients and customers? Do you need to create an information tool that can help your stakeholders understand complicated numbers and data? If you want to simplify data to make people understand your business numbers and statistics, then using a graph to explain your data is a great solution. And if you are not familiar with the creation of informative and data-driven visualizations, this Bar Graph Template from Venngage can definitely set you on the right path. A bar graph is a graphical representation used to represent data about your business. It can be used to explain the difference between elements and variables that mean something in your company or organization. For example, if you want to explain the different expenses in your company and the value of each, you can use bar graphs to graphically represent the values as numbers. The longer the length of the bar graph is, the more money you spend on each variable expense in your company. Bar graphs offer a unique way to simplify data about your
Related Chart Templates
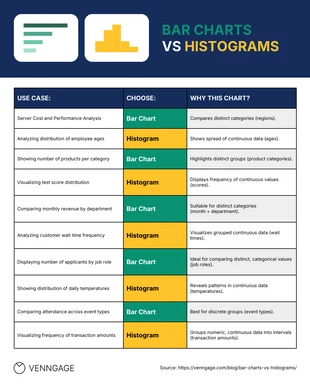
table charts
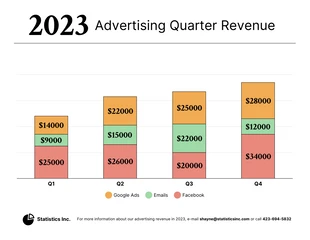
stacked charts
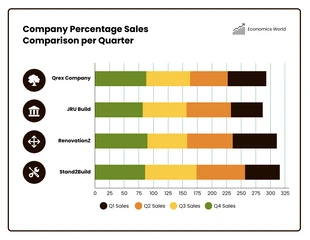
stacked charts
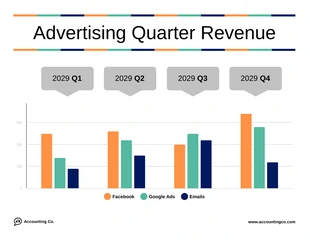
bar charts
mixed charts
bar charts
column charts
bar charts
stacked charts
stacked charts