
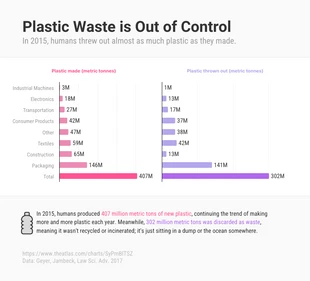
Segmented Bar Graph
Looking for a segmented bar graph? We customize a unique design with your choice of colors, fonts, and chart types in our friendly editor.

 100% customizable templates
 Millions of photos, icons, charts and graphics
 AI-powered editing features
 Effortlessly share, download, embed and publish
 Easily generate QR codes for your designs
- SizeLetter (11 x 8.5 in)
- File typePNG, PDF, PowerPoint
- Planfree
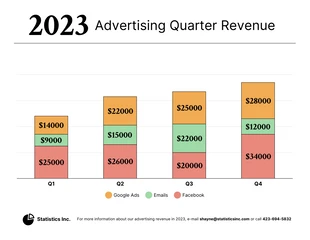
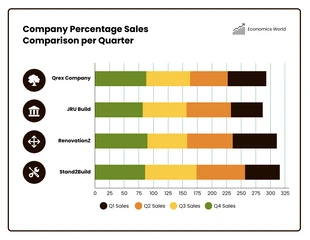
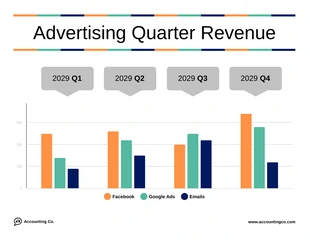
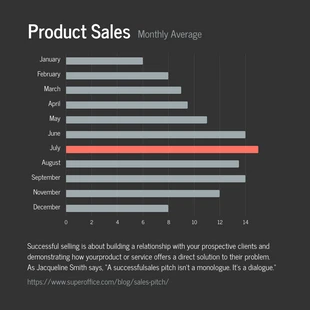
Segmented bar graph is a type of bar graph that has multiple bars that are split into segments. They are used to compare the same data for different groups. Segmented bar graphs make it easy for users to compare values and see patterns and trends in data by separating it into different segments. The segmented bar graph is great for people who need to make quick decisions based on their analysis of data, such as managers or salespeople who need to know what's selling well right now so they can adjust their inventory accordingly. To access the template editor and design library, you'll need an account with Venngage. You can register either by using your Gmail or Facebook address—just be sure to modify this sample first so that you're familiar with how it works. It's worth noting that if you've already created a Venngage account of your own, what happens next? Just sign in and get started—it's that simple! You can also choose from a variety of templates in the library or customize one of your own.
Related Chart Templates
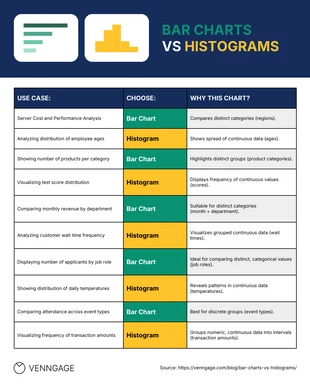
table charts
stacked charts
stacked charts
bar charts
mixed charts
bar charts
bar charts
bar charts
stacked charts
stacked charts