
Horizontal Bar Graph Marketing Stats Template
Craft a visual representation of your important data through this horizontal bar graph marketing stats template from Venngage.

 100% customizable templates
 Millions of photos, icons, charts and graphics
 AI-powered editing features
 Effortlessly share, download, embed and publish
 Easily generate QR codes for your designs
- Design stylemodern, fun
- Colorslight
- SizeCustom (816 x 720 px)
- File typePNG, PDF, PowerPoint
- Planbusiness
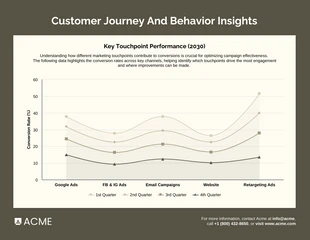
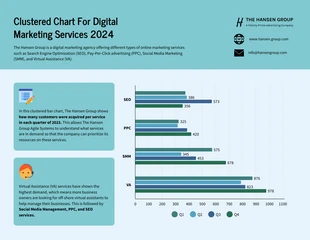
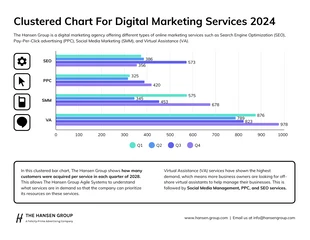
Do you need a simple yet effective way to visually represent important marketing data about your company? Are you looking for a way to engage your audience when reporting company marketing statistics? If the answer is yes, then you need to create a bar graph to help visualize your data. If you want to show the difference between different elements and variables that affect your company, using a bar graph is an excellent solution to achieve this goal. However, if you are not used to creating graphs from scratch, this horizontal bar graph marketing stats template can help you get started on the right path. Unlike textual information, visually-engaging elements such as videos, images, and graphs are more memorable and easier to recall. Most text-based information or presentation are forgotten by the audience because they are not engaging or appealing enough to be remembered. If you have important company or business data that you want to share with your stakeholders, you can use a bar graph to communicate this information. If you don’t have enough experience creating professional-quality bar graphs from
Related Chart Templates
stacked charts
column charts
stacked charts
stacked charts
bar charts
bar charts
bar charts
bar charts
area charts