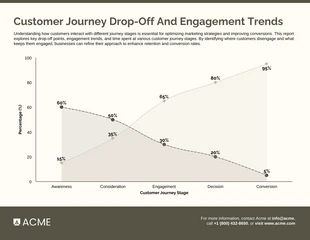
Visual Content Share Marketing Stats Bar Chart Template
Design a professional-looking vertical bar chart for your business marketing stats. Customize this Vertical Bar Chart Marketing Stats Template to get started.
100% customizable templates
Millions of photos, icons, charts and graphics
AI-powered editing features
Effortlessly share, download, embed and publish
Easily generate QR codes for your designs
- Design stylemodern, fun
- Colorslight
- SizeCustom (816 x 685 px)
- File typePNG, PDF, PowerPoint
- Planfree
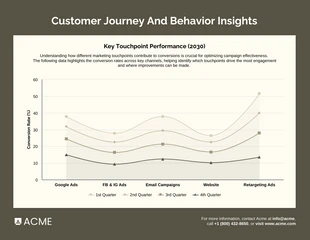
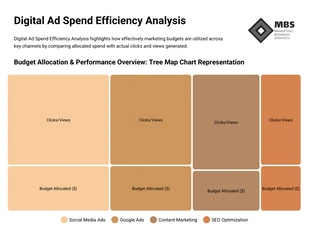
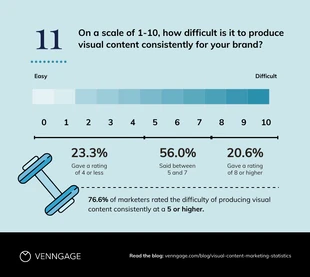
A Vertical Bar Chart Marketing Stats is used to display data about the marketing performance of a business. It shows how much revenue was generated, how many leads were generated, and what percentage of those leads converted into sales. The chart can also display the cost of marketing campaigns and other expenses. The Vertical Bar Chart Marketing Stats Template helps users by providing an easy way to create charts that have all of these features. Users just have to enter their data into the template and the chart will be created for them automatically. The benefits of using Vertical Bar Chart Marketing Stats Template are that it saves time on creating charts manually, it allows users to see all of their data at once in one place instead of having to go through multiple places or different documents in order find it all at once, and it gives users an easy way to share their results with others who might not want to go through all the work involved in creating their own charts manually themselves but still want access to some

