
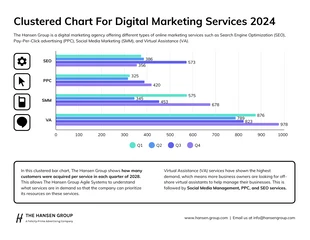
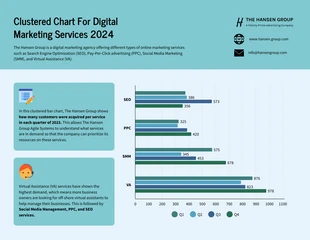
Digital Marketing Services Clustered Bar Chart Template
Create a visually appealing comparison of multiple data sets with a Clustered Bar Chart. Make data analysis easy and efficient!

 100% customizable templates
 Millions of photos, icons, charts and graphics
 AI-powered editing features
 Effortlessly share, download, embed and publish
 Easily generate QR codes for your designs
- SizeLetter (11 x 8.5 in)
- File typePNG, PDF, PowerPoint
- Planpremium
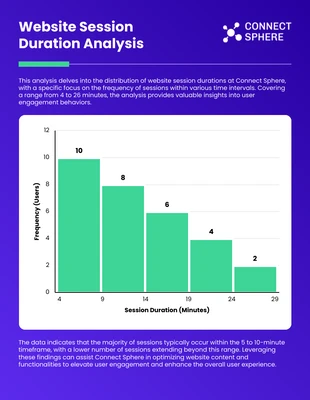
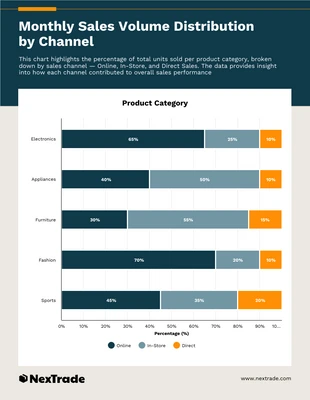
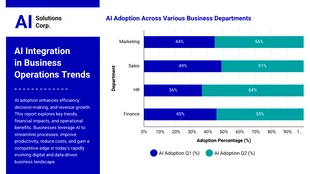
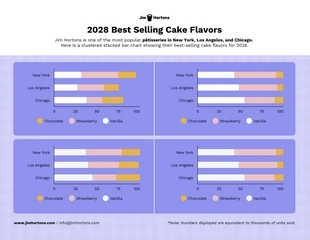
A Clustered Bar Chart is a type of graph that presents data in a clear and concise way. It makes comparing values between different categories easier to understand for your audience. This chart is commonly used in business, marketing, and social sciences to illustrate changes in quantitative or qualitative variables over time. It also visualizes information on the distribution of one category relative to another, highlighting similarities or differences between two or more groups. The Clustered Bar Chart is helpful in identifying trends, displaying patterns, and detecting anomalies in data. Overall, the Clustered Bar Chart is a type of graph that provides a clear and concise representation of complex data that can be easily understood and analyzed.
Related Chart Templates
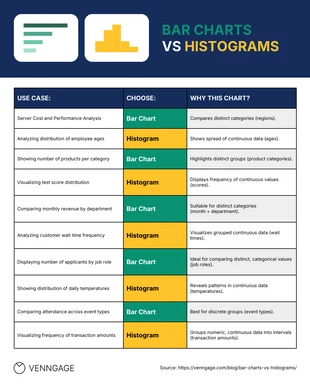
table charts
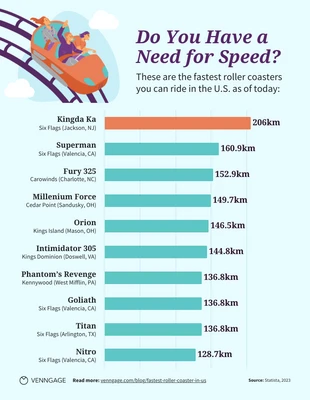
bar charts
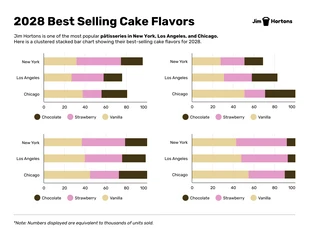
stacked charts
histogram charts
stacked charts
stacked charts
bar charts
column charts
bubble charts