
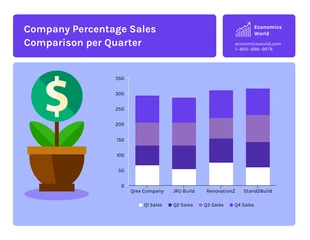
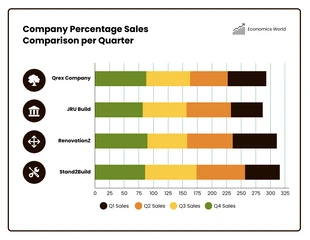
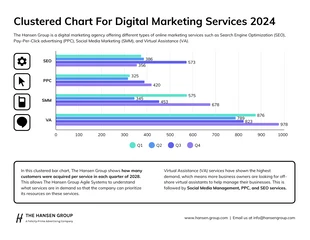
Clustered and Stacked Bar Chart
Visualize your data in a new way with a Clustered and Stacked Bar Chart — gain insights and showcase your findings like never before!

 100% customizable templates
 Millions of photos, icons, charts and graphics
 AI-powered editing features
 Effortlessly share, download, embed and publish
 Easily generate QR codes for your designs
- SizeLetter (11 x 8.5 in)
- File typePNG, PDF, PowerPoint
- Planpremium
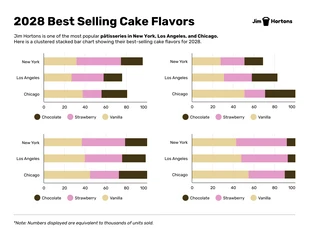
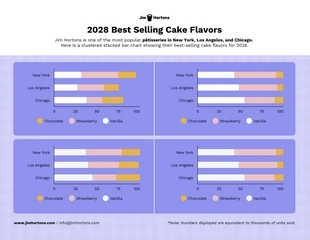
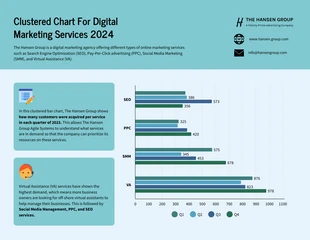
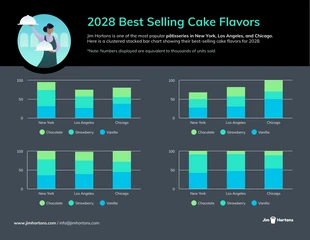
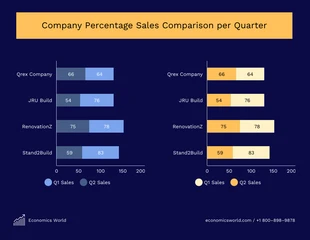
A Clustered and Stacked Bar Chart is useful when you want to display multiple sets of data in one chart. This type of chart allows you to see how each set of data contributes to the overall total, as well as compare the individual values within each set. This can be helpful when analyzing data from different categories or time periods. For example, you could use a Clustered and Stacked Bar Chart to compare sales figures for different products in a given year. Or, you can use it to analyze the percentage of time spent on different tasks by employees in a particular department. Overall, a Clustered and Stacked Bar Chart is a great way to showcase information to a wider audience.
Related Chart Templates
stacked charts
stacked charts
stacked charts
stacked charts
stacked charts
stacked charts
stacked charts
bar charts
bar charts
stacked charts

stacked charts
stacked charts