
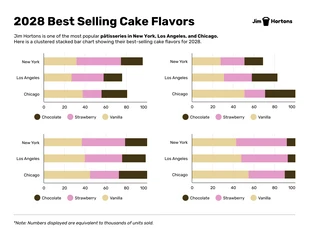
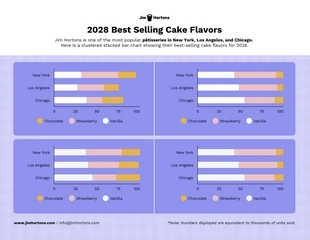
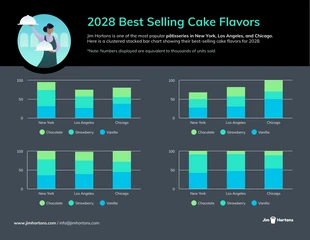
Clustered Stacked Column Chart
Visualize multiple data sets and their relationships at once with a Clustered Stacked Column Chart — be efficient and informative!

 100% customizable templates
 Millions of photos, icons, charts and graphics
 AI-powered editing features
 Effortlessly share, download, embed and publish
 Easily generate QR codes for your designs
- SizeLetter (11 x 8.5 in)
- File typePNG, PDF, PowerPoint
- Planpremium
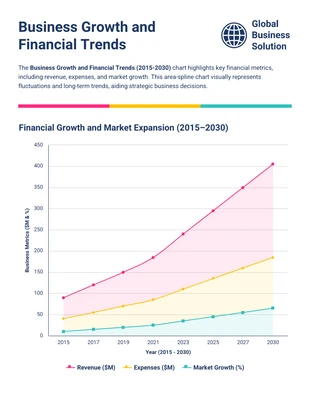
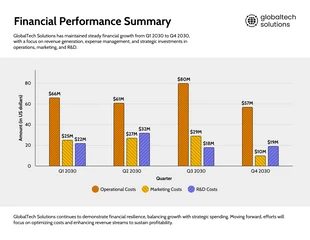
A Clustered Stacked Column Chart is a type of chart where multiple columns are grouped together for each data category, with each column displaying multiple data points stacked on top of each other. The Clustered Stacked Column Chart is commonly used to show how different variables contribute to a total, such as sales by product and region. This allows for easy comparison of data within each variable and between categories. All-in-all, it’s safe to say that a Clustered Stacked Column Chart is one of the best ways to showcase multiple levels of data involving a number of different variables.
Related Chart Templates
column charts
stacked charts
stacked charts
stacked charts
stacked charts
stacked charts
column charts
stacked charts
stacked charts
stacked charts