
Clustered Stacked Bar Chart
Visualize data with depth and insight — create a Clustered Stacked Bar Chart for a dynamic and informative display!

 100% customizable templates
 Millions of photos, icons, charts and graphics
 AI-powered editing features
 Effortlessly share, download, embed and publish
 Easily generate QR codes for your designs
- SizeLetter (11 x 8.5 in)
- File typePNG, PDF, PowerPoint
- Planpremium
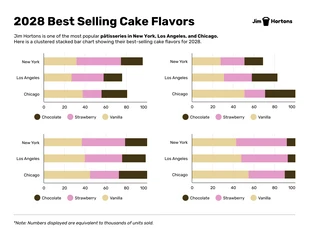
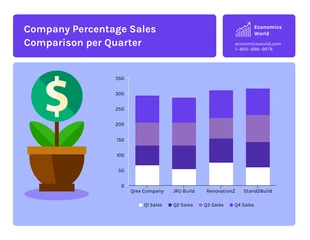
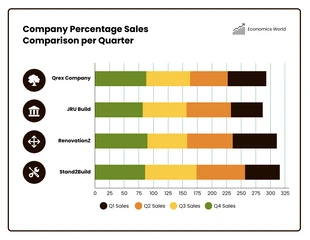
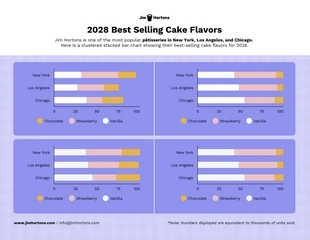
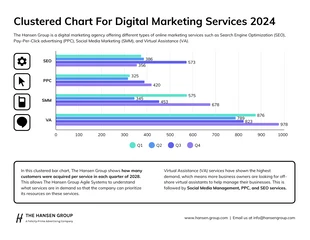
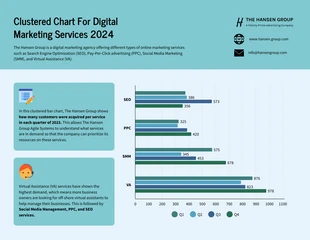
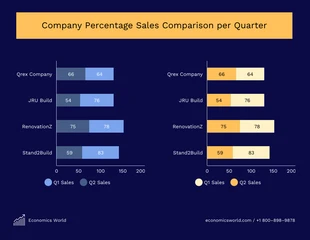
A Clustered Stacked Bar Chart is a graphical representation of data that shows multiple data series in bar form. It's useful when comparing variations in data across different categories, with each category being displayed as a cluster of bars. The Clustered Stacked Bar Chart also allows for easy comparison of the contribution of each variable to the overall value of the category. This type of chart is ideal for analyzing data from surveys, customer feedback, and other market research that requires a comparison of multiple data points. Finally, a Clustered Stacked Bar Chart can also be a great tool for visualizing budget allocations, project timelines, and resource utilization in project management.
Related Chart Templates
stacked charts
stacked charts
stacked charts
stacked charts
stacked charts
stacked charts
stacked charts
bar charts
bar charts
stacked charts

stacked charts
stacked charts