
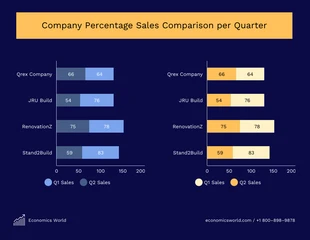
Stacked Bar Graph
Our templates are made from scratch. You can add content to Venngage stacked bar graphs and customize it any way you want to fit your needs.

 100% customizable templates
 Millions of photos, icons, charts and graphics
 AI-powered editing features
 Effortlessly share, download, embed and publish
 Easily generate QR codes for your designs
- SizeLetter (11 x 8.5 in)
- File typePNG, PDF, PowerPoint
- Planpremium
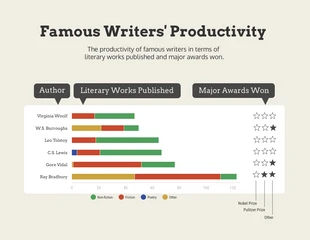
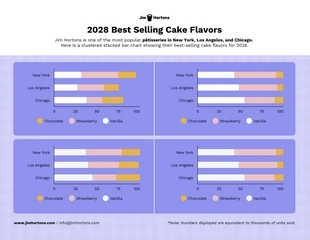
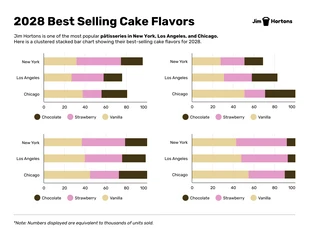
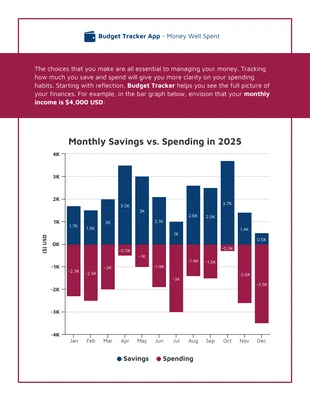
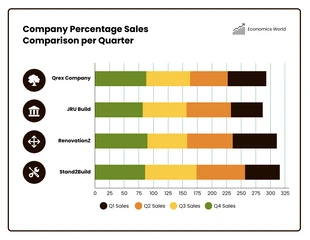
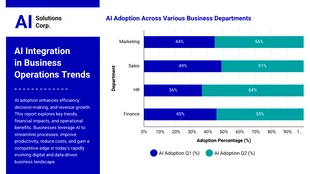
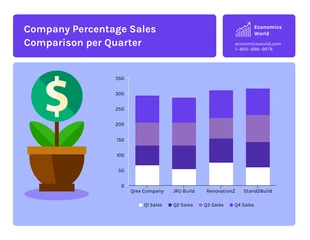
Stacked bar graphs are a simple way to show data in multiple categories. They can be used to compare the relative quantities of each category, or they can show the total quantity of all categories combined. The stacked bar graph is most effective when the categories are discrete and clearly defined, so that users can easily distinguish one category from another. Stacked bar graphs help users by providing a quick visual representation of the data, which is often more intuitive than a table or a line graph. The benefits of using stacked bar graphs include: ease of understanding and interpretation, no need for readers to have prior knowledge of the data; easy comparison between multiple sets of data; ability to see relationships between different variables within each set. Anyone can use stacked bar graphs! They are helpful for visual learners looking for an easy way to understand large amounts of data without needing prior knowledge about it. If you want to construct bar graphs but don’t know where to start, this template from Venngage may help
Related Chart Templates
stacked charts
stacked charts
stacked charts
stacked charts
stacked charts
stacked charts
stacked charts
stacked charts
stacked charts
stacked charts
stacked charts