AI Integration in Business Operations Percentage Column Chart Template
Unleash Your Creativity: Design Custom Column Charts for AI-Driven Business Insights
100% customizable templates
Millions of photos, icons, charts and graphics
AI-powered editing features
Effortlessly share, download, embed and publish
Easily generate QR codes for your designs
- SizeLetter (8.5 x 11 in)
- File typePNG, PDF, PowerPoint
- Planfree
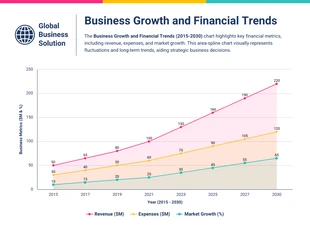
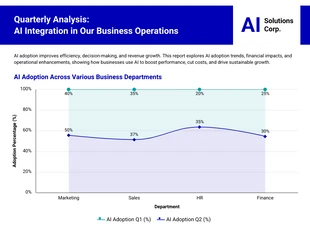
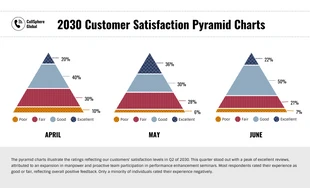
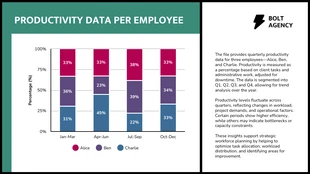
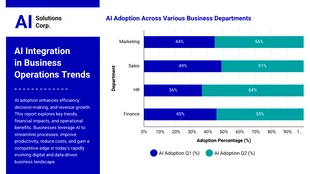
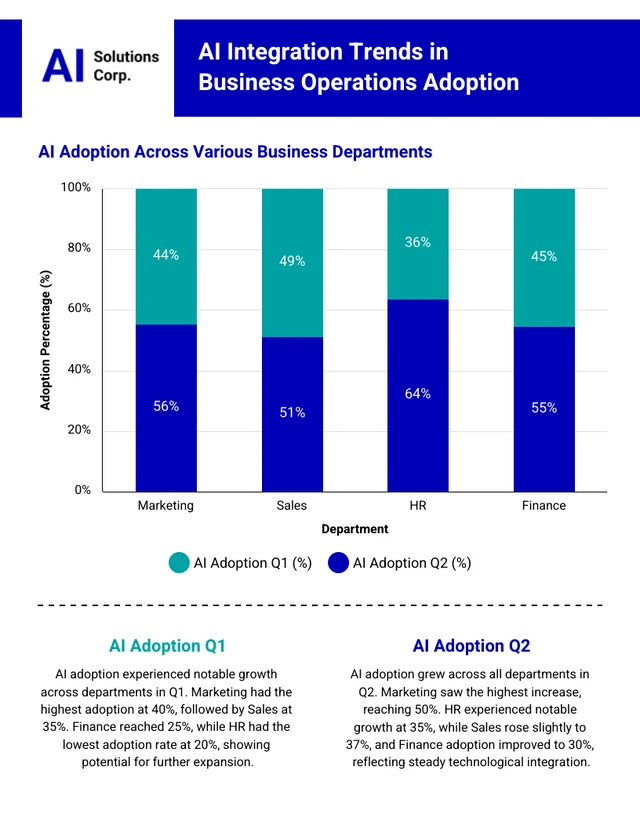
The AI Integration in Business Operations Percentage Column Chart Template is your go-to solution for visually showcasing how AI is transforming business processes. Perfect for presentations, reports, or stakeholder meetings, this template allows you to depict data-driven insights with clarity and style. The column chart makes it easy to compare the percentage of AI integration across different sectors or business functions, providing a clear snapshot of progress and areas for growth. This template is the ideal design to promote and get the word out! You can fully customize it—tweak the colors to match your brand, adjust sizes to fit your data needs, and select the most compelling photos or icons from our extensive free stock libraries. Use Venngage to create a stunning and informative design that speaks directly to your audience's

