
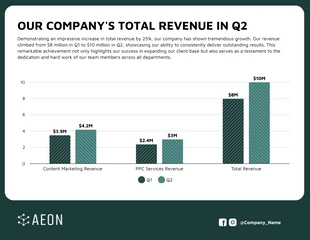
Financial Performance Summary Column Chart
Visualize Your Data: Design Your Own Financial Performance Summary Column Chart Now!

 100% customizable templates
 Millions of photos, icons, charts and graphics
 AI-powered editing features
 Effortlessly share, download, embed and publish
 Easily generate QR codes for your designs
 Accessible and WCAG-compliant
- SizeLetter (11 x 8.5 in)
- File typePNG, PDF, PowerPoint
- Planbusiness
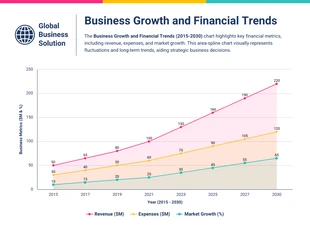
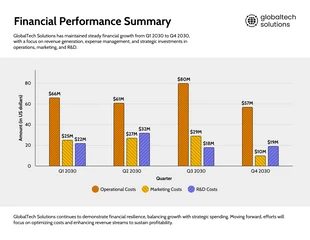
The Financial Performance Summary Column Chart Template is your go-to solution for showcasing financial data in a clear and compelling format. Designed with precision and clarity in mind, this template allows you to present complex financial information in an easy-to-digest way. Whether you're preparing for a board meeting, investor update, or a business review, this template helps you communicate key financial metrics effectively. This template is the ideal design to promote and get the word out! It's fully customizable to meet your specific needs—adapt the colors to match your brand, adjust sizes to emphasize key data, and choose the best visuals or icons from our extensive free stock libraries. Use Venngage to craft a design that not only informs but also impresses. Dive into creating your bespoke financial report
Related Chart Templates
area charts
table charts
tree map charts
column charts
stacked charts
table charts
stacked charts

column charts
column charts