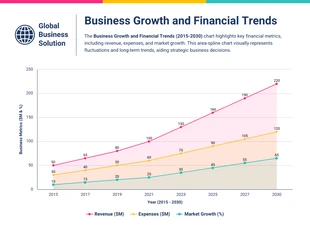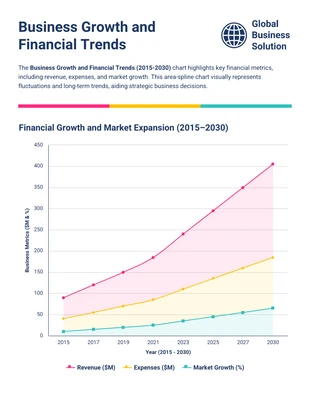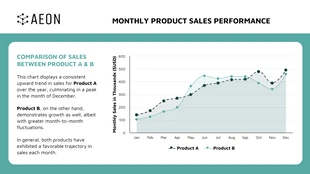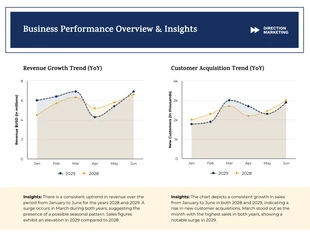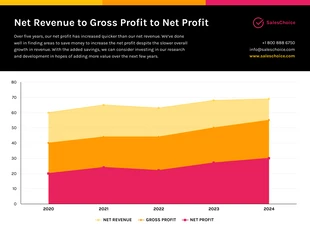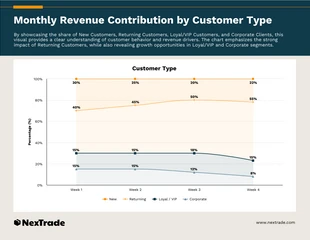
Revenue Comparison Area Chart
Unleash your creativity: Design a captivating Revenue Comparison Area Chart with our customizable template!
100% customizable templates
Millions of photos, icons, charts and graphics
AI-powered editing features
Effortlessly share, download, embed and publish
Easily generate QR codes for your designs
Accessible and WCAG-compliant
- SizeLetter (8.5 x 11 in)
- File typePNG, PDF, PowerPoint
- Planfree
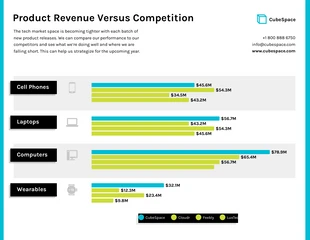
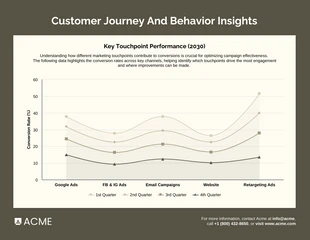
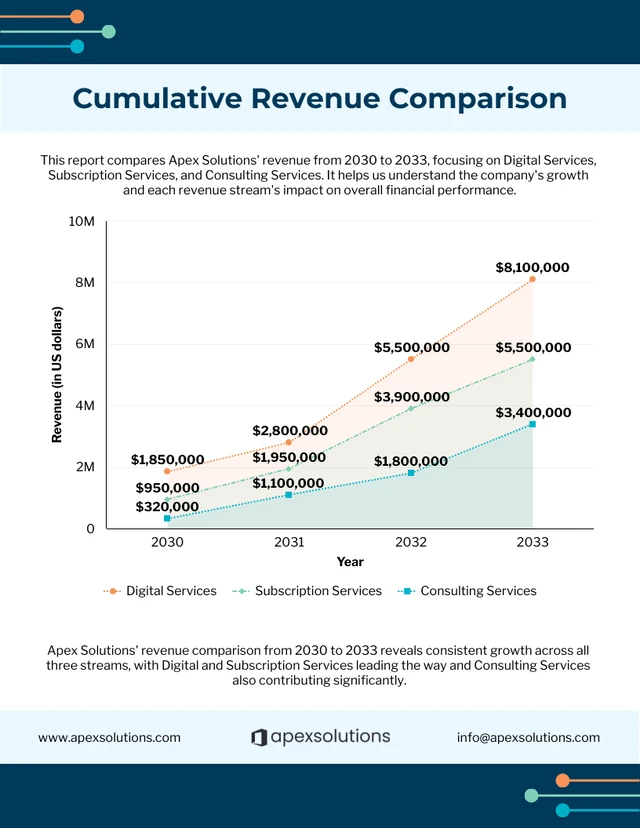
Crank up your data presentation game with the Revenue Comparison Area Chart Template! Perfect for showcasing financial trends and comparing revenue streams over time, this template is designed to captivate and inform. Featuring an intuitive layout with clearly delineated areas, it allows for easy visualization of multiple revenue sources and their growth. This template is the ideal design to promote and get the word out! Dive into customization as much as you need – whether it’s infusing your brand colors, adjusting sizes, or incorporating the most striking visuals. Access a treasure trove of free stock photos and icons in Venngage’s extensive libraries to craft a design that's uniquely yours. With user-friendly editing tools, your final presentation will be not just comprehensible, but engaging and memorable.

