
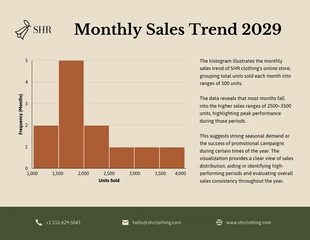
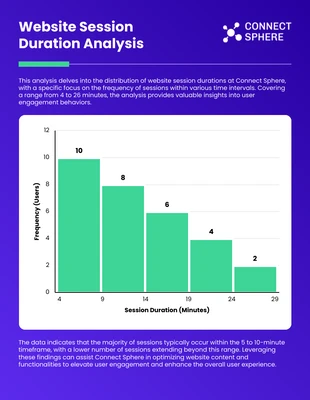
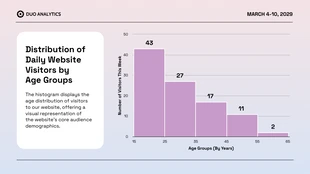
Website Session Duration Histogram Chart
Unleash Your Creativity: Design Personalized Histogram Charts for Enhanced Website Analytics

 100% customizable templates
 Millions of photos, icons, charts and graphics
 AI-powered editing features
 Effortlessly share, download, embed and publish
 Easily generate QR codes for your designs
 Accessible and WCAG-compliant
- SizeLetter (8.5 x 11 in)
- File typePNG, PDF, PowerPoint
- Planfree
Looking to make a striking impression with your presentation on website analytics? Our Website Session Duration Histogram Chart Template is just what you need! This clean and visually engaging template is designed to help you effortlessly showcase data on user engagement. Whether you're highlighting session durations or analyzing visitor behavior, this template makes the process straightforward. Customize it as much as you need - add your brand's colors, tweak the sizes, and choose the perfect photos or icons from our free stock libraries to tailor the design to your needs. This template is the ideal design to promote and get the word out, making it easier than ever to present complex data with confidence in Venngage.
Related Chart Templates
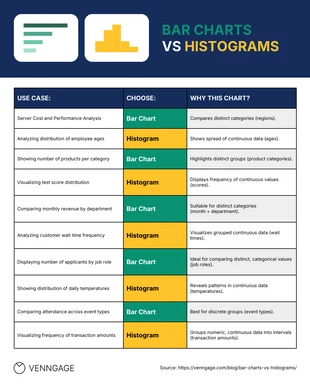
table charts
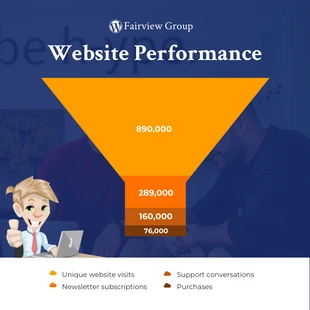
funnel charts
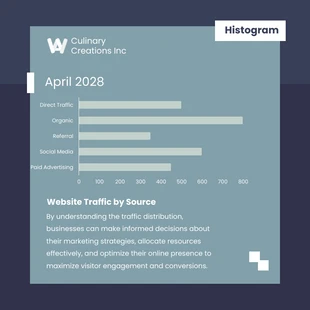
histogram charts
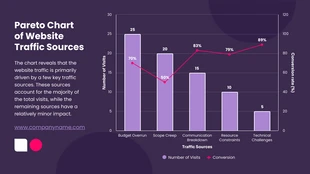
pareto charts
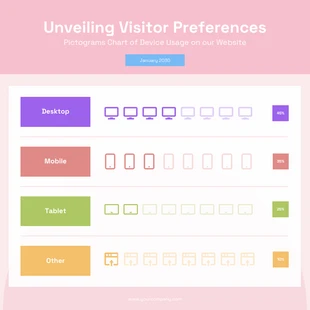
pictogram charts
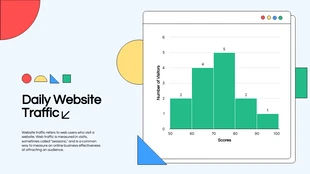
histogram charts
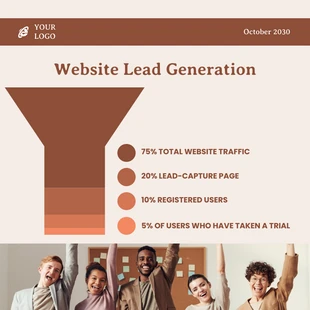
funnel charts
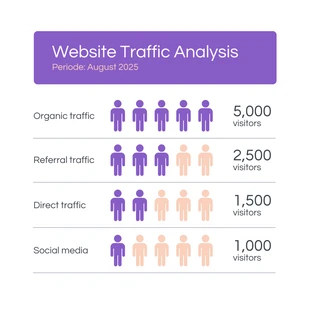
pictogram charts
histogram charts
histogram charts
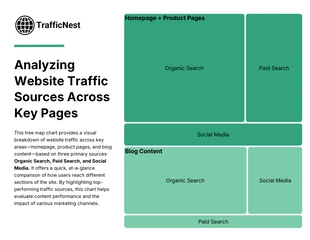
tree map charts
histogram charts