
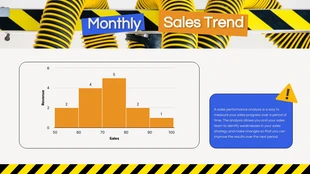
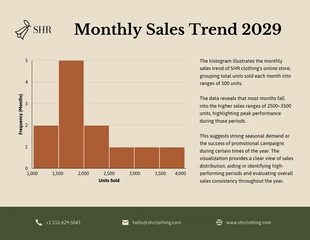
Monthly Sales Histogram Chart
Unleash Your Creativity: Design Your Personalized Monthly Sales Histogram Chart

 100% customizable templates
 Millions of photos, icons, charts and graphics
 AI-powered editing features
 Effortlessly share, download, embed and publish
 Easily generate QR codes for your designs
 Accessible and WCAG-compliant
- SizeLetter (11 x 8.5 in)
- File typePNG, PDF, PowerPoint
- Planfree
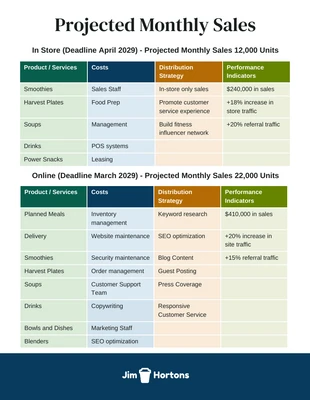
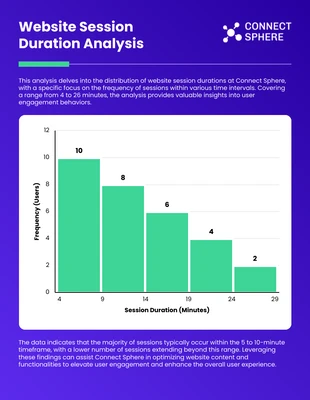
Looking to effectively communicate your sales data? Our Monthly Sales Histogram Chart Template is here to help! Perfect for showcasing your business's progress, this design allows you to clearly display monthly sales trends and patterns. It's an excellent tool for presentations, reports, or even just keeping your team in the loop. This template is the ideal design to promote and get the word out! Dive into customization options—you can adjust the colors to match your brand, tweak sizes for optimal presentation, and select the perfect photos or icons from our extensive free stock libraries to craft your perfect design. With Venngage, turning your sales data into a compelling visual story has never been easier. Bring your numbers to life and impress your audience with impactful visuals that speak volumes!
Related Chart Templates
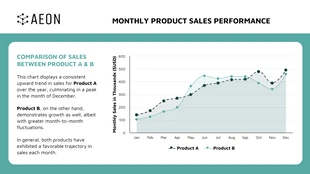
histogram charts
stacked charts
table charts
histogram charts
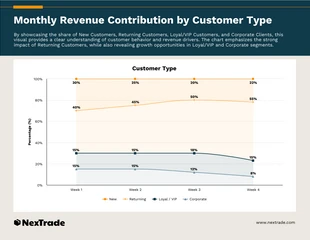
stacked charts
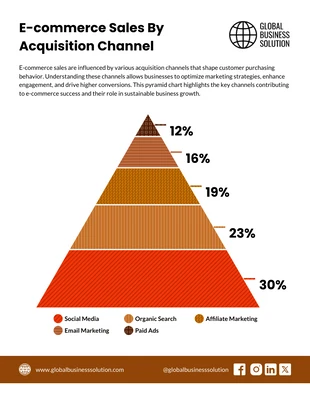
pyramid charts
histogram charts
area charts
histogram charts
stacked charts