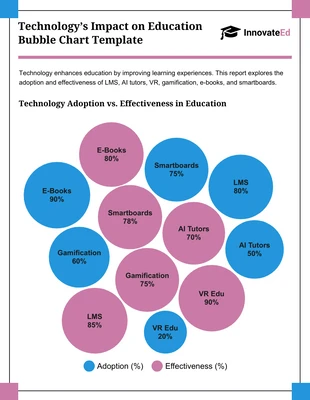
Customizable Bubble Chart for Data Visualization Template
Unleash Your Creativity: Design Your Own Dynamic Bubble Chart for Insightful Data Visualization

 100% customizable templates
 Millions of photos, icons, charts and graphics
 AI-powered editing features
 Effortlessly share, download, embed and publish
 Easily generate QR codes for your designs
- SizeCustom (1200 x 630 px)
- File typePNG, PDF, PowerPoint
- Planfree
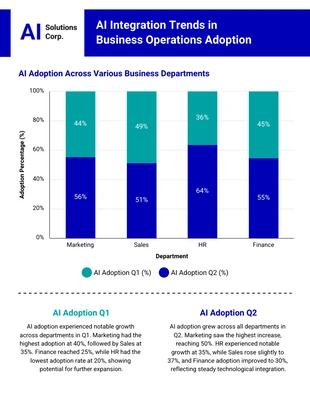
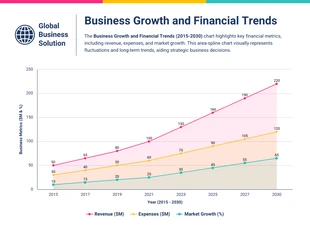
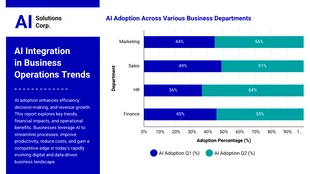
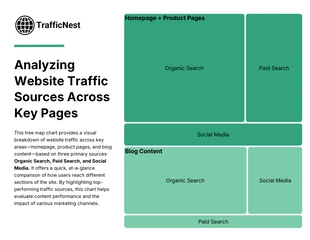
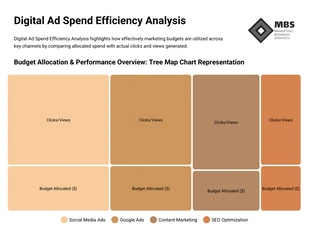
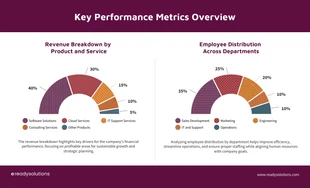
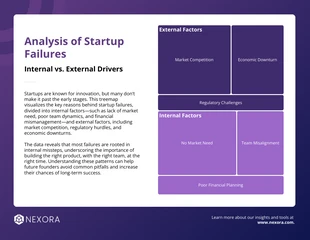
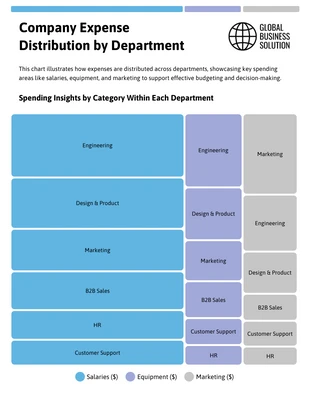
Looking to present your data with a bit of flair? Our Customizable Bubble Chart for Data Visualization Template is the perfect solution to make your data pop! This design is ideal for effectively communicating complex datasets in a visually engaging way. Whether you’re crafting a presentation for a corporate meeting or a school project, this template provides a creative edge. With Venngage’s easy-to-use editor, you can tweak every element to suit your needs—adjust colors, resize bubbles, or swap in icons and photos from our extensive free stock libraries. Make your data stand out and tell a compelling story with a few clicks. This template is the ideal design to promote and get the word out! Dive into a seamless customization experience and bring your data to life today.
Related Chart Templates
tree map charts
tree map charts
pie charts

bubble charts
tree map charts
tree map charts
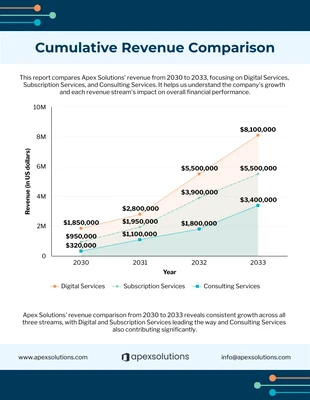
area charts
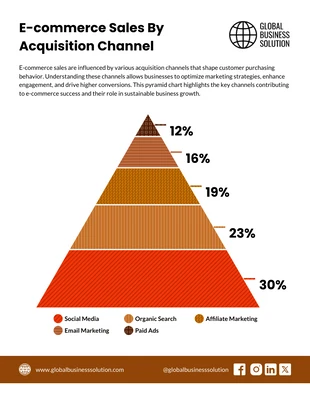
pyramid charts