
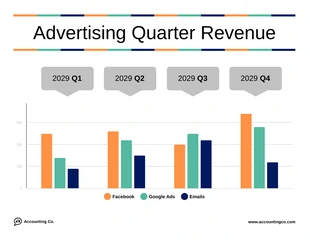
Simple Advertising Quarter Revenue Bar Graph Template
Get a bar graph template at Venngage and get the job done in no time. Simply try the bar graph example, very easy to edit.

 100% customizable templates
 Millions of photos, icons, charts and graphics
 AI-powered editing features
 Effortlessly share, download, embed and publish
 Easily generate QR codes for your designs
- SizeLetter (11 x 8.5 in)
- File typePNG, PDF, PowerPoint
- Planpremium
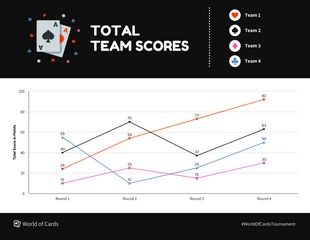
Bar graphs are very useful for comparing two or more sets of data. The height of each bar represents how many items fall into a certain category. Bar graphs can be used to compare things like the number of people who have a particular disease, or the number of voters who chose one candidate over another. The main benefit of using bar graph example is that they are easy to read and understand. They take up less space than other types of charts and graphs, so they're ideal for displaying large amounts of data in a small area. All you need to do is compare the heights of each bar in order to see how each set compares with the others. You'll need an account with Venngage in order to access the template editor and design library. Register with either your Gmail or Facebook address. When you're ready, modify this sample to your liking. Having said that, what happens if you have already created an account with Venngage? Just sign in and get started right away, that's all
Related Chart Templates
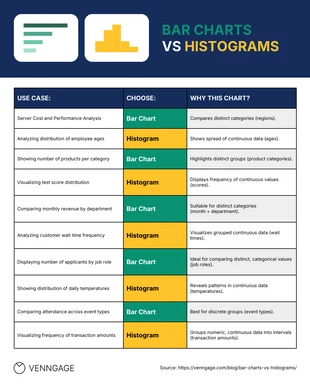
table charts
area charts
line charts

column charts
bar charts
stacked charts
bar charts
mixed charts
stacked charts