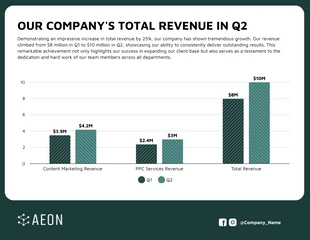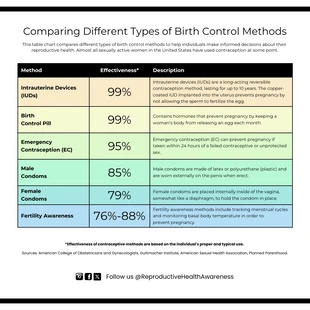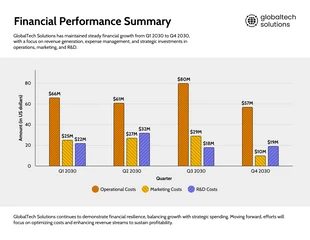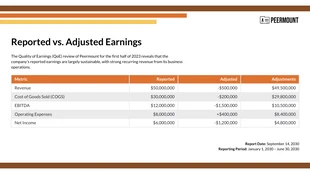
North American Business Analysis Bar Chart Template
Make business presentations, ace your reports, and level up your personal goals using this easy-to-edit blank 5 column chart template.
100% customizable templates
Millions of photos, icons, charts and graphics
AI-powered editing features
Effortlessly share, download, embed and publish
Easily generate QR codes for your designs
- Design stylemodern
- Colorsvibrant, light
- SizeLetter (11 x 8.5 in)
- File typePNG, PDF, PowerPoint
- Planfree
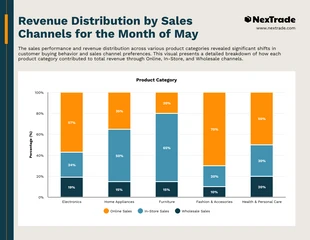
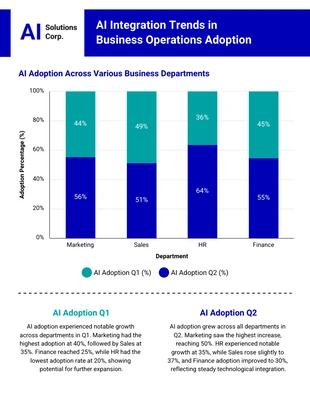
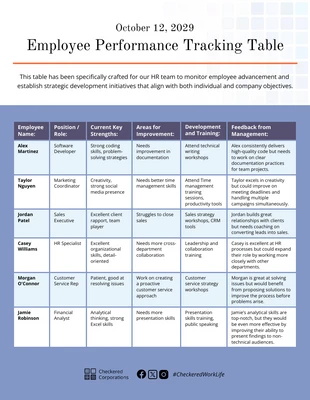
A blank 5 column chart is a template you can utilize to create various charts, including line graphs, bar charts, and pie charts. The template is designed to be easy to use and customize so that you can make the perfect chart for your needs. You can use these charts in business presentations; as such visual aids can help track sales data or compare different products over time. You can use this chart to track the number of products sold each month, help you identify trends, and make predictions about future sales. Another way to use this is to compare the performance of different employees. This side-by-side layout can help you identify areas where there is room for improvement. Students can also use this type of chart for school reports. Teachers can use this chart to compare various students' performance in class or track their progress over time. Researchers or administrators can also use this chart to compare the performance of different schools. Finally, you can use this chart for personal reasons, such as to monitor your water intake or fitness goals, to


