Free AI Pie Chart Generator
Transform data into clear, insightful pie charts with our AI-powered tool—ideal for simplifying trends, comparing categories, and enhancing presentations!
Browse through our AI-generated Pie Charts
AI-Powered Tools

How to write a prompt to generate the pie chart you want?
Define Your Data: Start by specifying the data categories or entities you want to visualize in the pie chart, such as sales distribution across four regions.
Specify Key Segments: Highlight the primary data points or segments you want emphasized, like ‘display the largest revenue source.
Clarify Purpose: Define the pie chart’s objective—whether it’s to compare categories, showcase proportions, or simplify complex data for clearer insights.

Sample prompts you can modify and use
“Generate a pie chart showing the percentage of budget spent across key departments: marketing, development, and operations.”
“Show a pie chart of customer satisfaction survey results categorized as Very Satisfied, Satisfied, Neutral, and Unsatisfied.”
“Create a pie chart comparing revenue shares across product categories: Electronics, Apparel, Groceries, Furniture, and Beauty.”
“Generate a pie chart that illustrates the breakdown of website traffic sources: Direct, Organic Search, Social Media, and Paid Ads.”
How can you create a pie chart in under 5 minutes?
Step 1: Define Your Data
Clarify the data you want to visualize. Identify the key categories or segments you need to showcase in the pie chart for quick and clear insights.
Step 2: Identify Key Metrics
Select the most important data metrics to highlight, such as market share, budget allocation, or customer demographics that align with your objective.
Step 3: Enter Your AI Prompt
Create a concise prompt for the AI, specifying the data categories, segments, and proportions you want in your pie chart.
Step 4: Customize Your Pie Chart
Use a tool like Venngage’s drag-and-drop editor to enhance the AI-generated pie chart. Adjust colors, labels, and branding to ensure it fits your style.
Step 5: Download and Share the Pie Chart
Review the pie chart for accuracy and clarity. Once it’s final, download it and seamlessly share it in your reports, presentations, or marketing materials.
Create Engaging Pie Charts with AI
Data doesn’t have to be overwhelming. With Venngage’s AI Pie Chart Generator, you can instantly transform complex information into clear, engaging visuals that communicate impact at a glance.
Whether you’re a marketer illustrating campaign results, a teacher simplifying classroom data, or an NGO presenting donor impact, our AI-driven tool creates charts that grab attention and inspire trust.
Generate Pie Charts
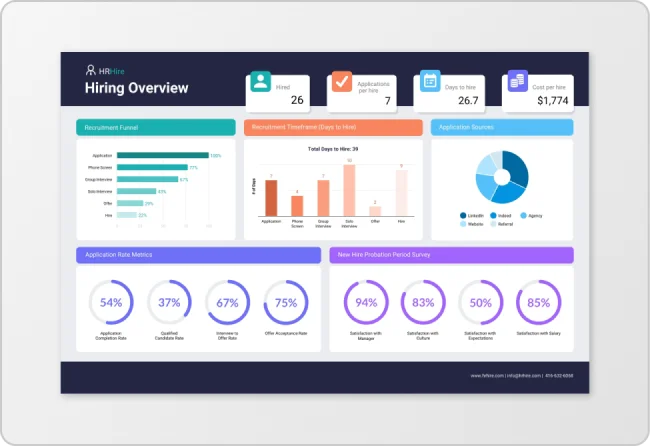
Use AI Pie Charts for Business and Financial Reporting
Business leaders need clarity when presenting numbers. With our AI chart generator, you can quickly visualize revenue streams, budget allocations, or market share in polished, professional pie charts.
From finance managers reporting to executives to startups pitching investors, AI ensures your visuals reinforce credibility, maintain brand consistency, and make data-driven insights easy to understand.
Generate Pie Charts
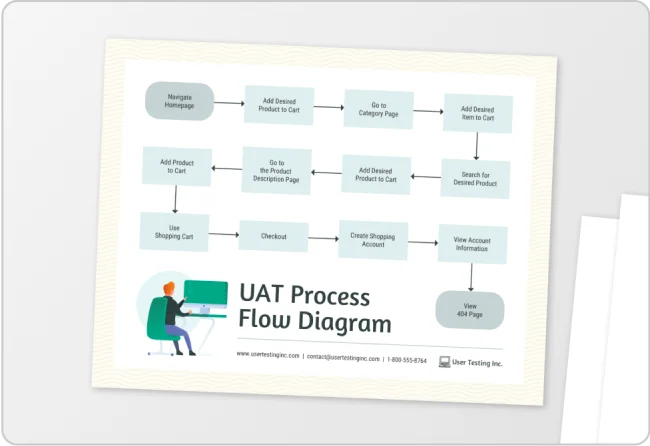
Analyze Team and Project Performance with AI Pie Charts
Tracking team output doesn’t need to be manual. With Venngage’s AI Pie Chart Generator, you can instantly see task distribution, resource allocation, and project milestones in a format your team actually understands.
Whether you’re a project manager overseeing cross-functional teams or an agency reporting to clients, AI-generated charts reveal trends, eliminate bottlenecks, and keep everyone aligned toward success.
Generate Pie Charts
Fuel Your Creativity with AI-Powered Design Tools
Venngage is your one-stop shop for creating impactful presentations, infographics, reports, and more. It's a favorite among professionals, educators, and marketers for a reason:
AI Branding Automation
Instantly extract brand colors, fonts, and styles. Auto-apply your logo and visual identity to every design for seamless brand consistency.

DesignAI Generator
Turn simple prompts into stunning professional visuals in seconds. Describe what you need in plain language and watch our AI generate layouts optimized for maximum visual impact.

AI Content Auto-Fill
Kickstart your design process in seconds. Choose a template and let our AI auto-fill it with relevant, on-brand content, ideal for streamlining workflow and boosting productivity.

AI Generated Icons and Images
Create unique visuals that perfectly match your content and style. Generate custom illustrations, icons and images that align perfectly with your brand.

AI Writer and Translation
Enhance clarity, rewrite content, and instantly translate text to create accessible, global-ready visuals.

Smart Accessibility AI
Ensure every project looks great and works for everyone. Use AI to write alt text check contrast, layout, and font readability, and export fully WCAG-compliant visuals and PDFs.

FAQs
Yes, the pie charts created with Venngage’s AI Pie Chart Generator are fully customizable. You can adjust elements, colors, text, and more to fit your specific needs.
Absolutely, Venngage offers a wide variety of pie chart designs to illustrate customer segmentation analysis, financial breakdown for investors, generate team performance reports, and more.
Yes, AI pie charts created using Venngage's AI Pie Chart Generator are copyright-free. You can use them for both personal and commercial purposes without any restrictions on copyright.
We offer a free plan so you can try out all our AI features without spending anything. If you want more advanced features like private sharing and auto branding, we've got Premium and Business plans available too.