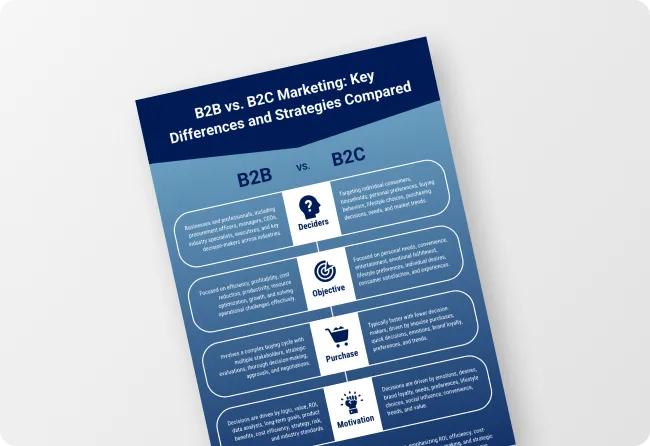
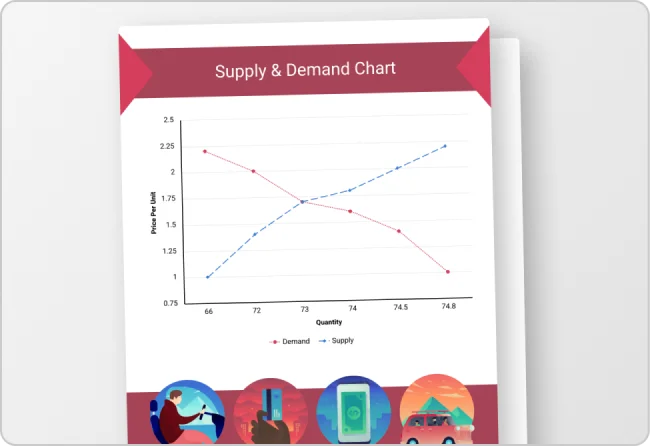
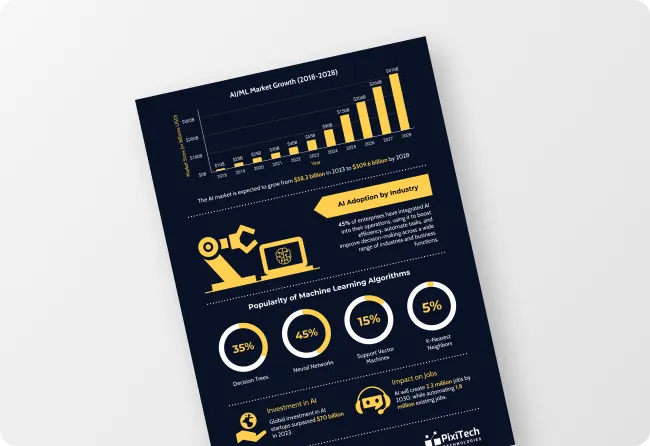
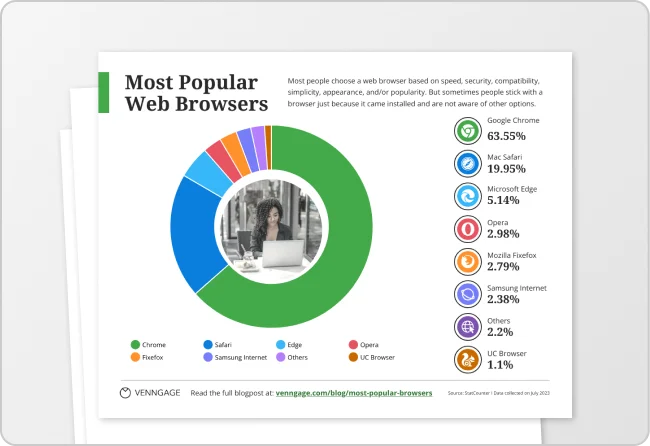
Free AI Data Infographic Generator
Turning complex data into visuals can be challenging, but our AI generator simplifies it. Just input a prompt and quickly create clear, impactful data infographics for your audience.
Browse through Data Infographic Templates
AI-Powered Tools
How to write a prompt that generates the data infographics you want?
Objective:Identify the infographic’s purpose, target audience, key insights, and takeaways to ensure clear and effective data presentation.
Key Details:Outline data points, visual style (charts, graphs, icons), and design elements (color, typography) for appealing, easy-to-understand visuals.
Format and Style:Combine data goals with visual elements in an AI prompt. Refine the output to align with your objectives and enhance clarity.
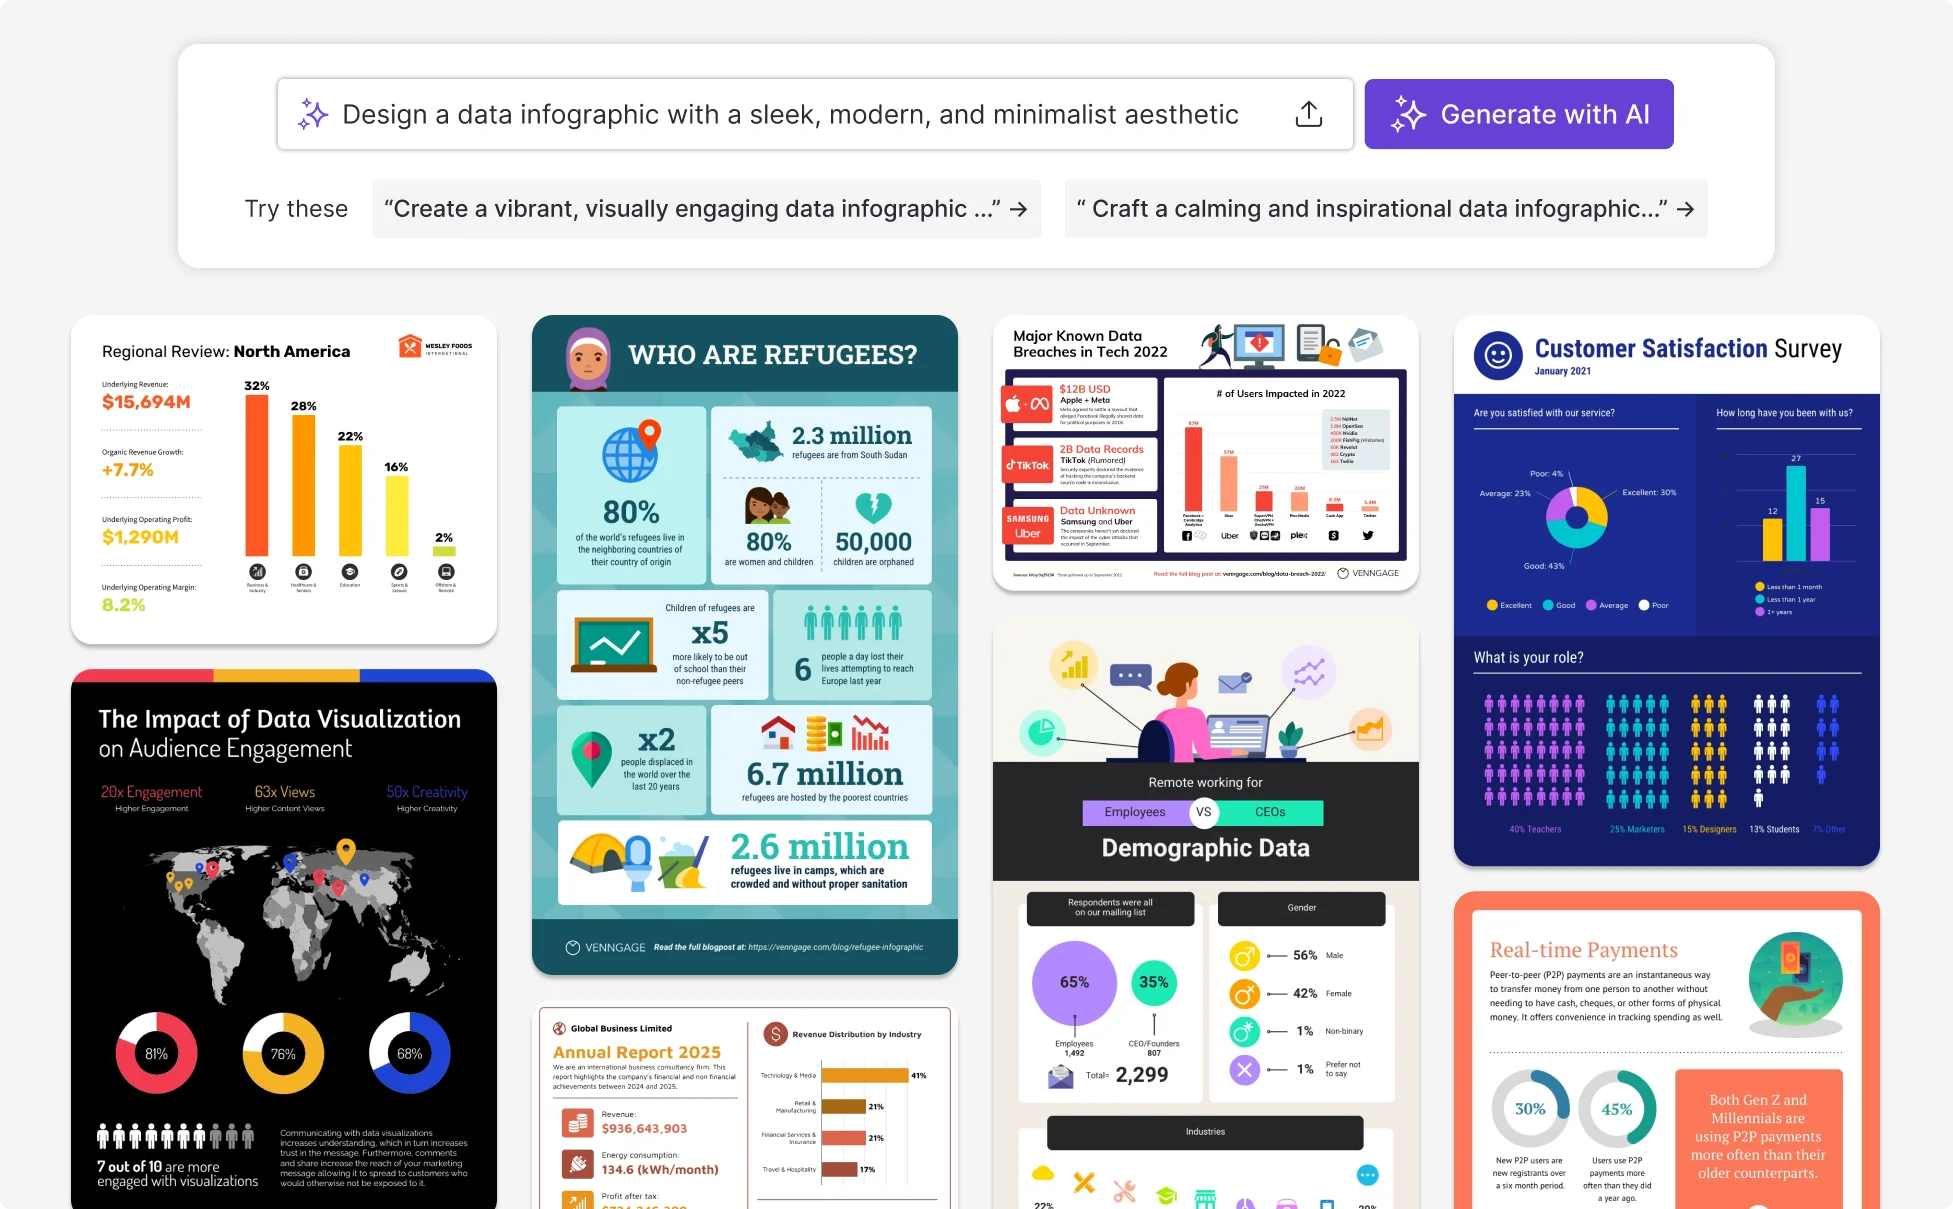
Sample prompts you can modify and use
“Product Launch Data Infographic: Design a sleek infographic with green and white tones, focusing on key product metrics using a clean, minimalist layout.”
“Travel Data Infographic: Create a vibrant infographic with travel stats, scenic images, and lively colors, evoking Bali’s spirit and blending data seamlessly.”
“Motivational Data Infographic: Craft a calming infographic with motivational stats on a serene background, using a blue and white palette for inspiration.”
“Food Recipe Data Infographic: Develop a warm infographic with food stats, images, and a cozy layout, highlighting ingredients, nutrition, and final dish visuals.”
How can you create a data infographic in under 5 minutes?
Step 1: Define Your Data Infographic Objectives
Identify the key objectives you want to achieve with your data infographic. Clearly outline the purpose, target audience, and main data points to ensure your infographic effectively communicates the intended message.
Step 2: Specify Data and Design Elements
Choose the critical data points, visual elements, and design aspects, such as charts, graphs, color schemes, and fonts. Ensure these elements align with your objectives and are visually appealing to your target audience.
Step 3: Craft Your AI Prompt
Develop a detailed AI prompt for your data infographic, specifying the layout, type of visualizations, color schemes, and data to be included. Clearly describe the theme and any particular features you want highlighted in the infographic.
Step 4: Review and Refine
Evaluate the initial AI-generated infographic, refining elements like data clarity, visual consistency, and overall design. Ensure the infographic is accurate, visually engaging, and aligned with your data communication goals.
Step 5: Finalize and Share
Confirm all elements of the infographic are correctly structured and comprehensive. Finalize the design, prepare the infographic for distribution, and ensure it’s ready to be shared with your intended audience.
Create Engaging Stories with AI-Powered Data Visuals
Turn complex datasets into clear, story-driven visuals with AI-generated infographics. Whether you’re a marketer showcasing campaign results, a teacher simplifying lessons, or a consultant explaining reports, your audience can instantly grasp the key message.
By highlighting only the most important insights through AI-driven charts and graphs, you make information accessible, engaging, and impossible to overlook.
Generate Data Infographic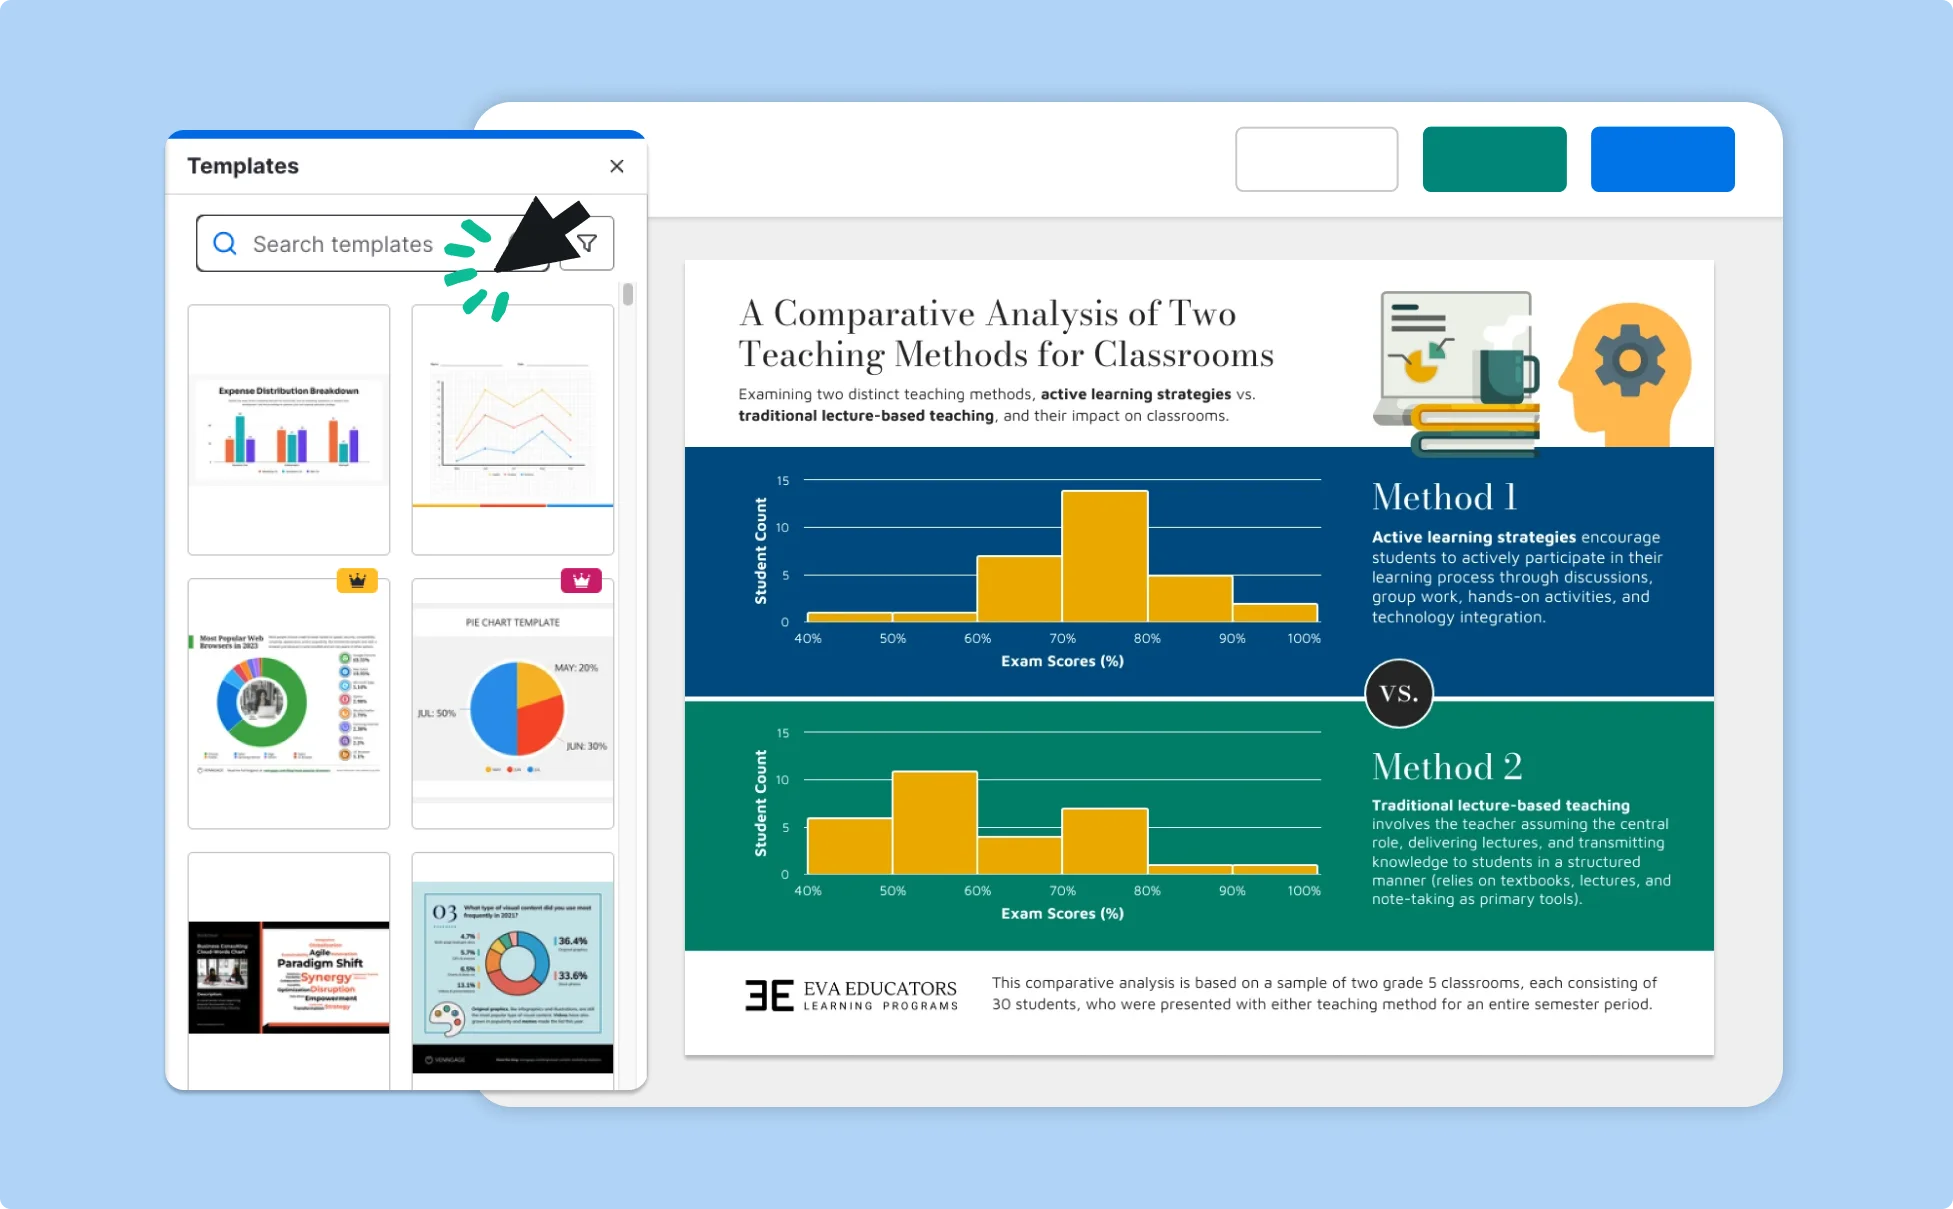
Boost Retention and Recall of Information with AI Infographics
AI-powered infographics make data stick by blending visuals with insights your audience won’t forget. Professionals in healthcare, finance, and education use them to simplify details and ensure key messages are remembered long after presentations end.
Consistent design, AI-recommended colors, and clear icons keep your data aligned with your brand, making every chart not just informative, but unforgettable.
Generate Data Infographic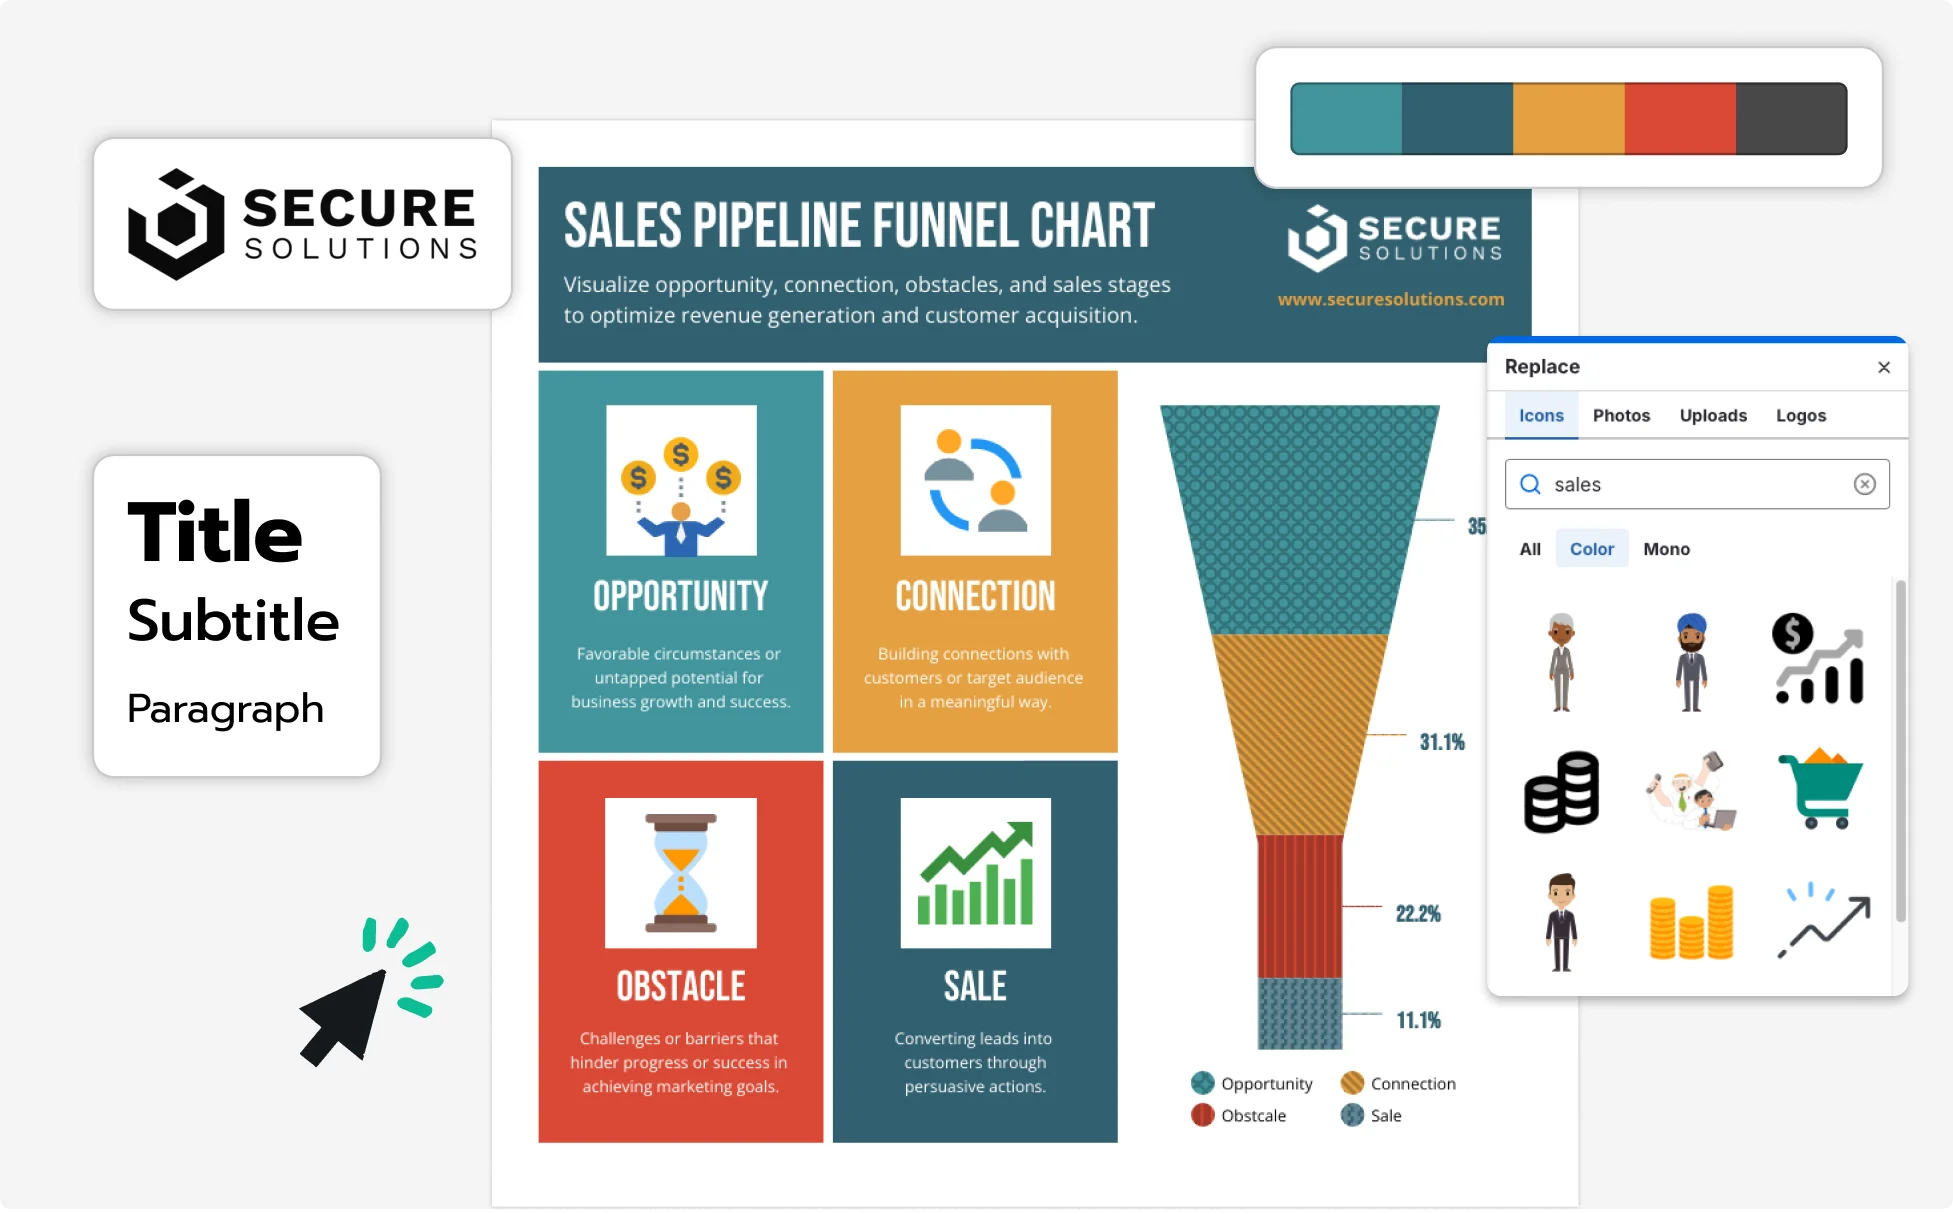
Improve Data Interpretation and Decision-Making with AI
Raw numbers can overwhelm, but AI data visualization turns them into intuitive visuals that guide better decisions. Business leaders, policy makers, and researchers can instantly interpret trends, identify opportunities, and act with confidence.
From dashboards to pitch decks, AI-generated visuals ensure your data is not only accurate but also professionally presented and aligned with your brand identity.
Generate Data Infographic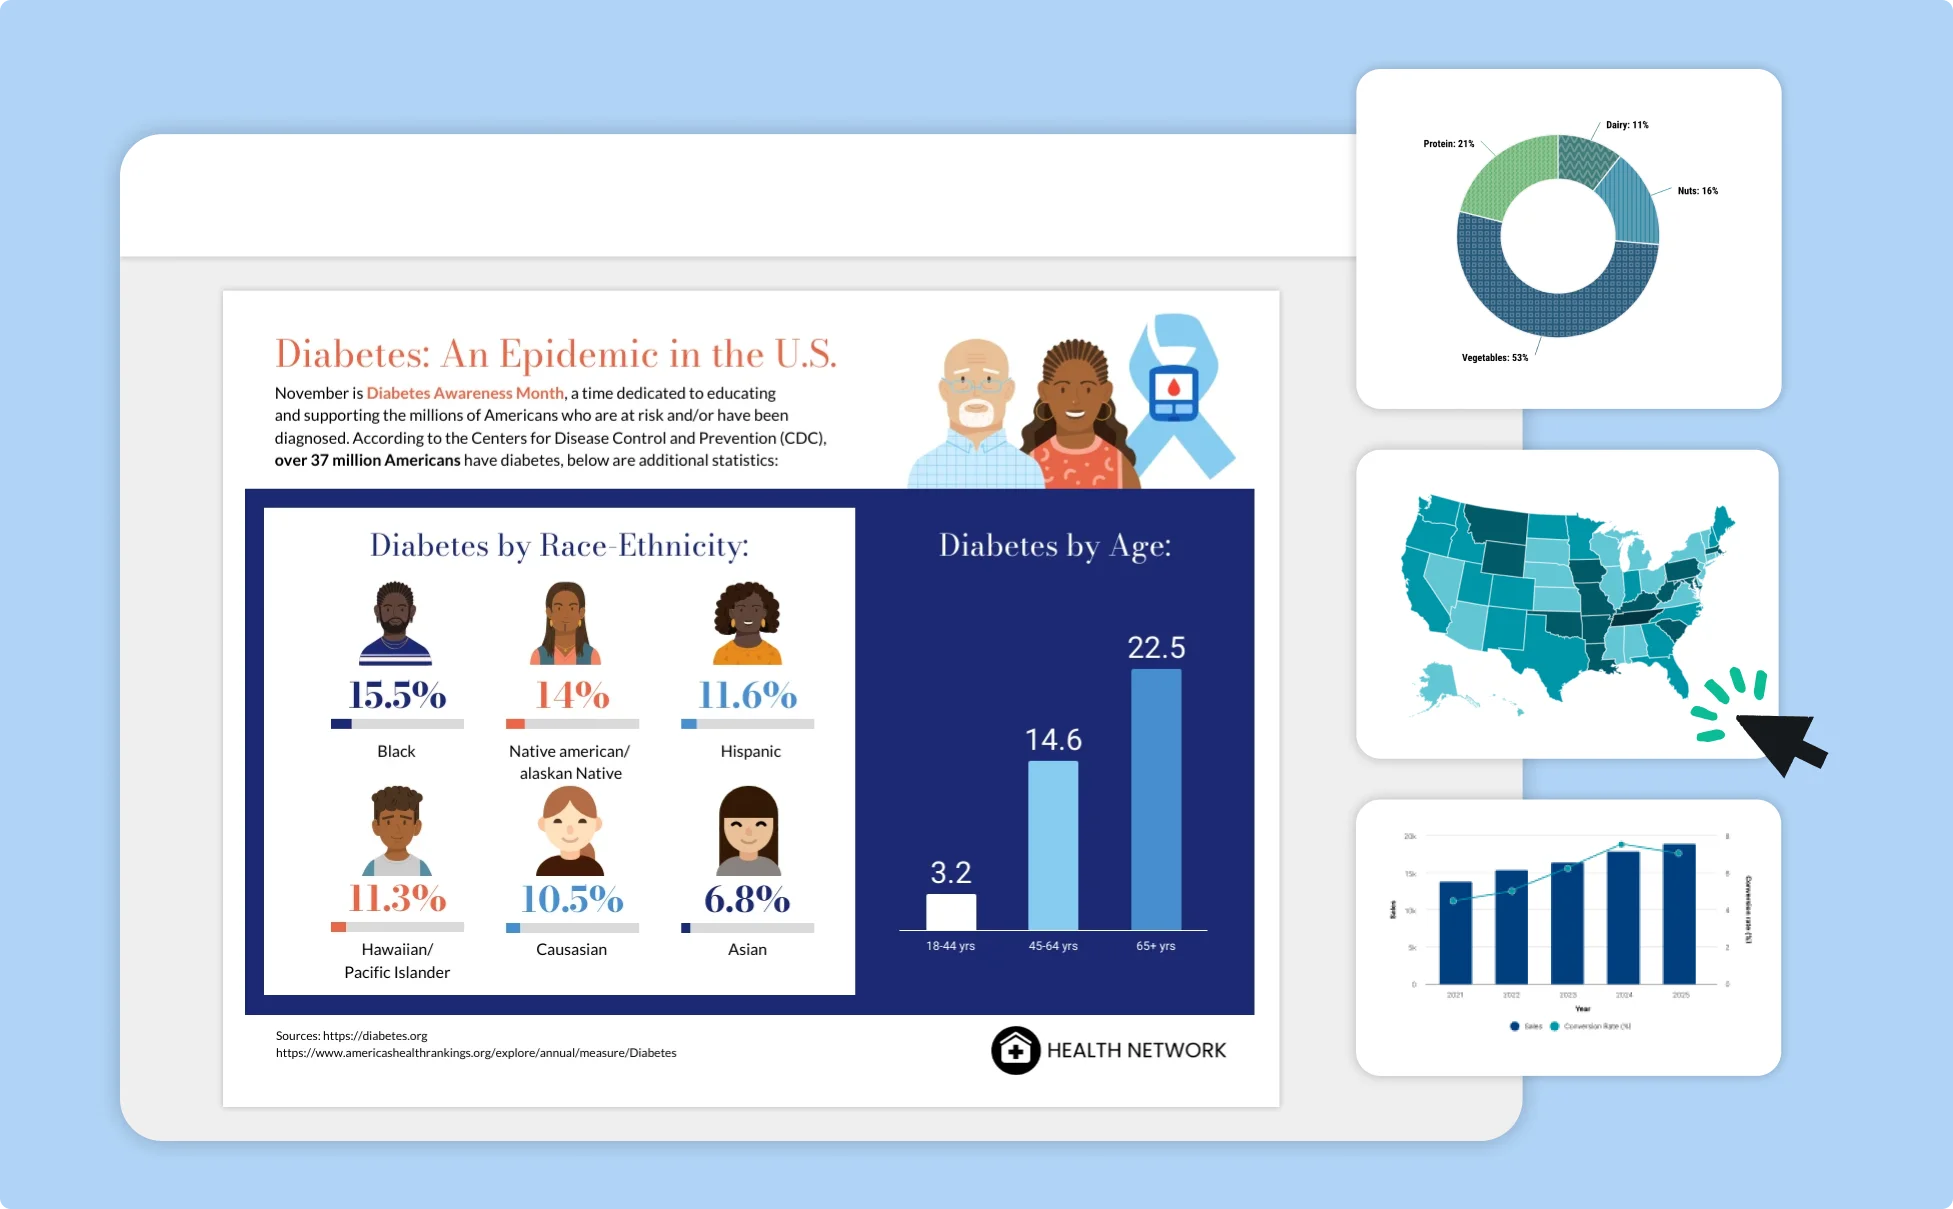
Fuel Your Creativity with AI-Powered Design Tools
Venngage is your one-stop shop for creating impactful presentations, infographics, reports, and more. It's a favorite among professionals, educators, and marketers for a reason:
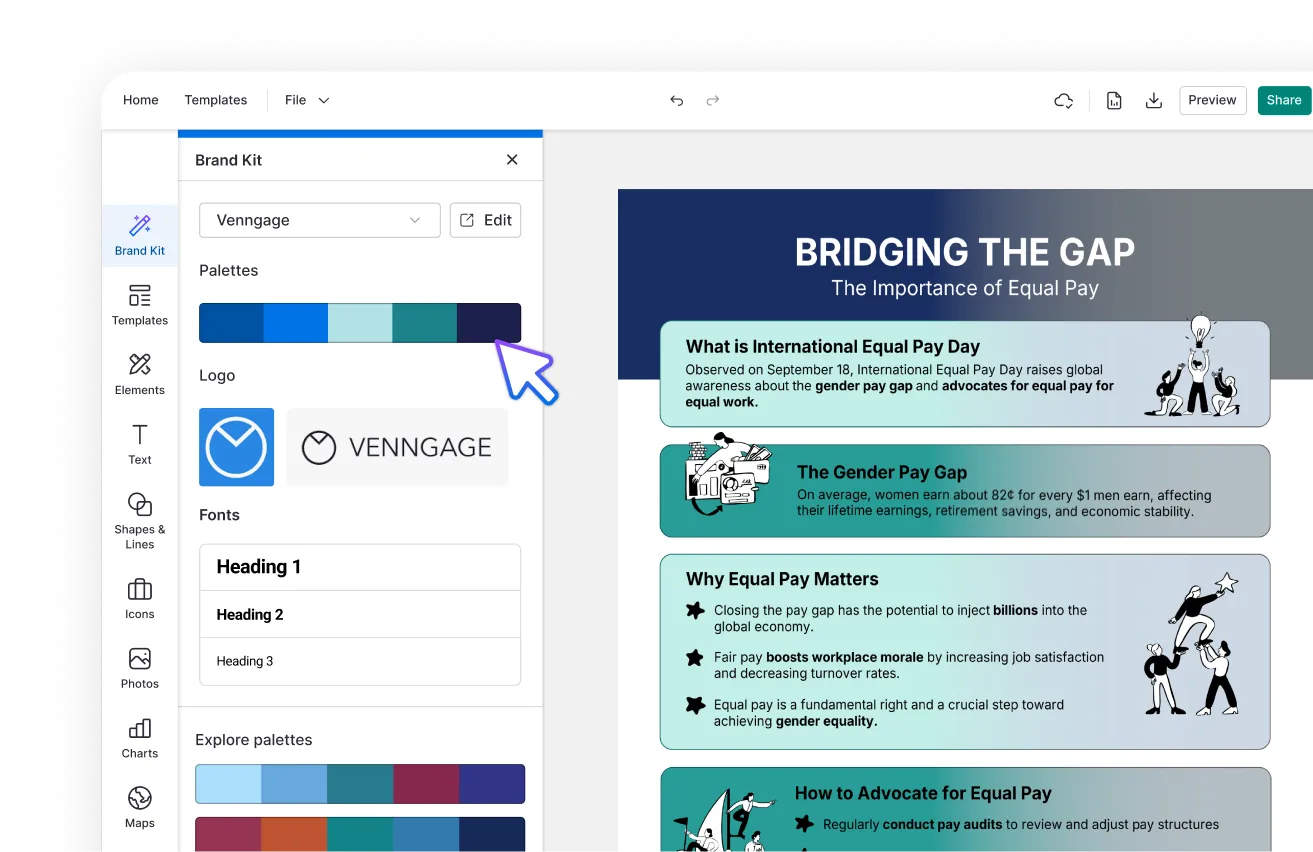
AI Branding Automation
Instantly extract brand colors, fonts, and styles. Auto-apply your logo and visual identity to every design for seamless brand consistency.
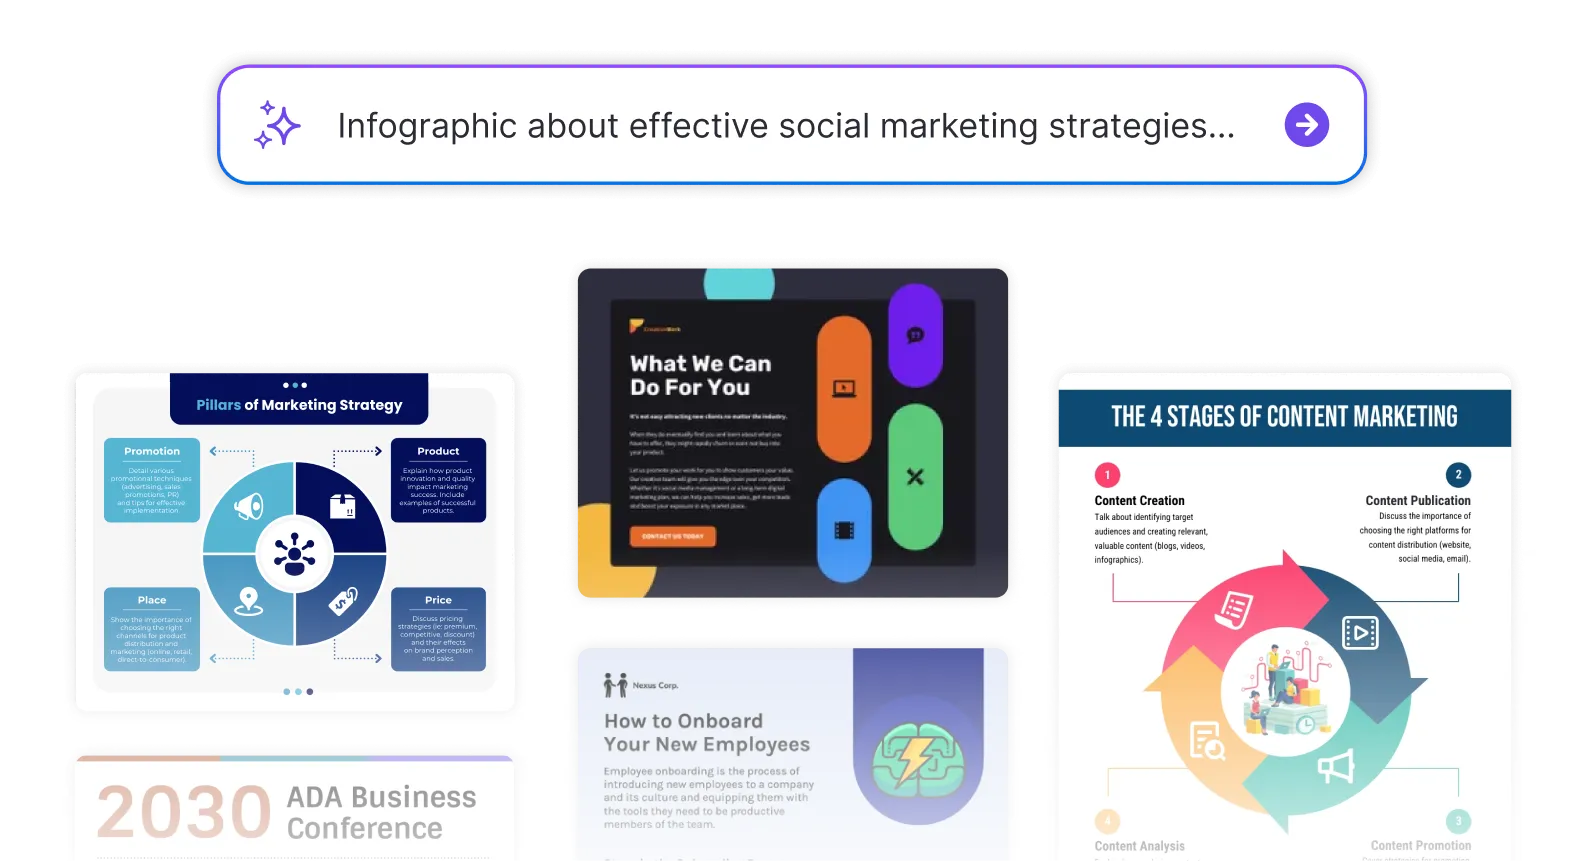
DesignAI Generator
Turn simple prompts into stunning professional visuals in seconds. Describe what you need in plain language and watch our AI generate layouts optimized for maximum visual impact.
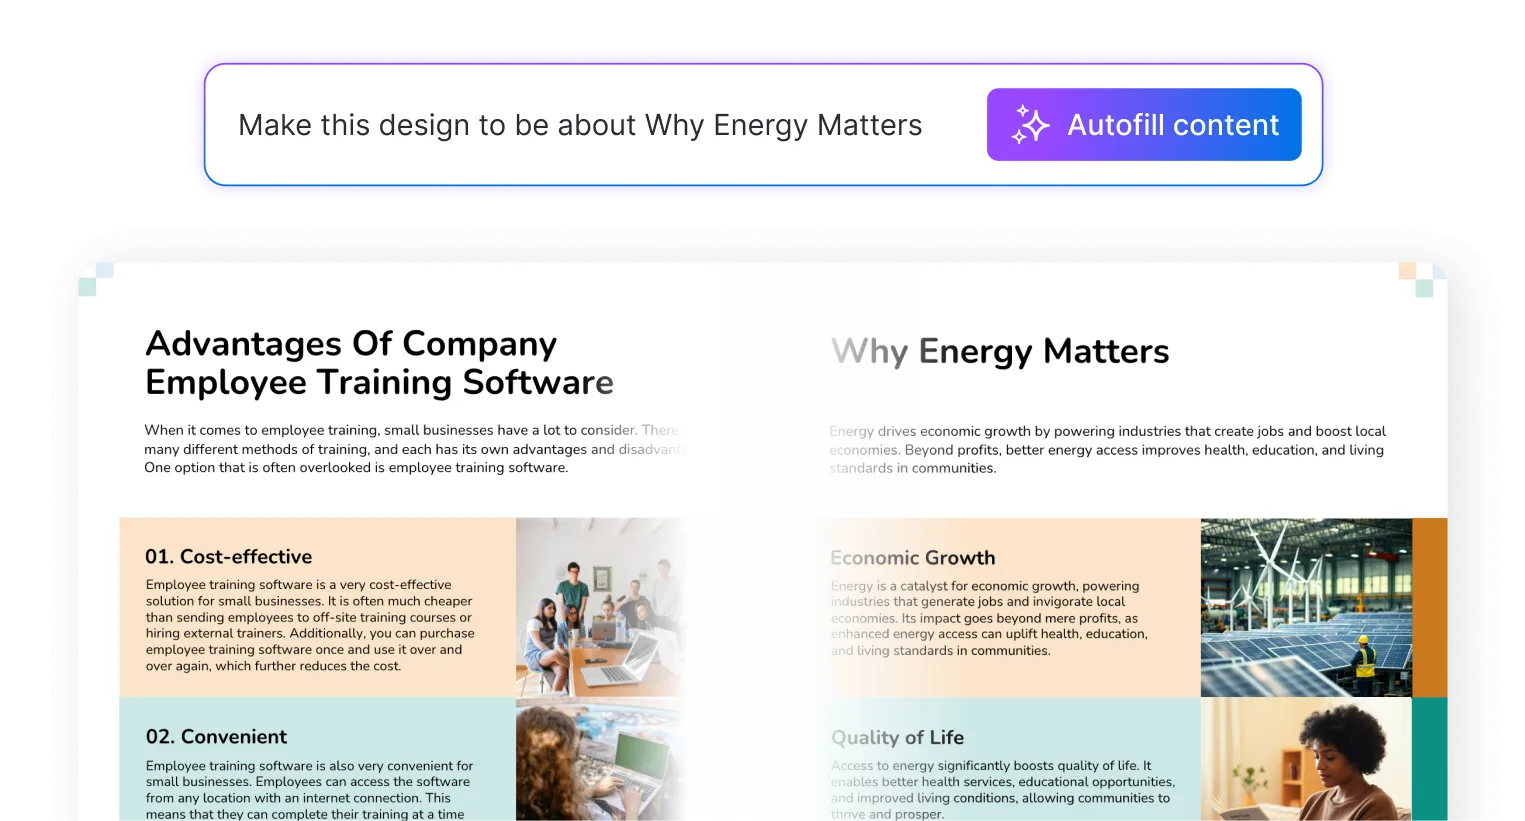
AI Content Auto-Fill
Kickstart your design process in seconds. Choose a template and let our AI auto-fill it with relevant, on-brand content, ideal for streamlining workflow and boosting productivity.
AI Generated Icons and Images
Create unique visuals that perfectly match your content and style. Generate custom illustrations, icons and images that align perfectly with your brand.

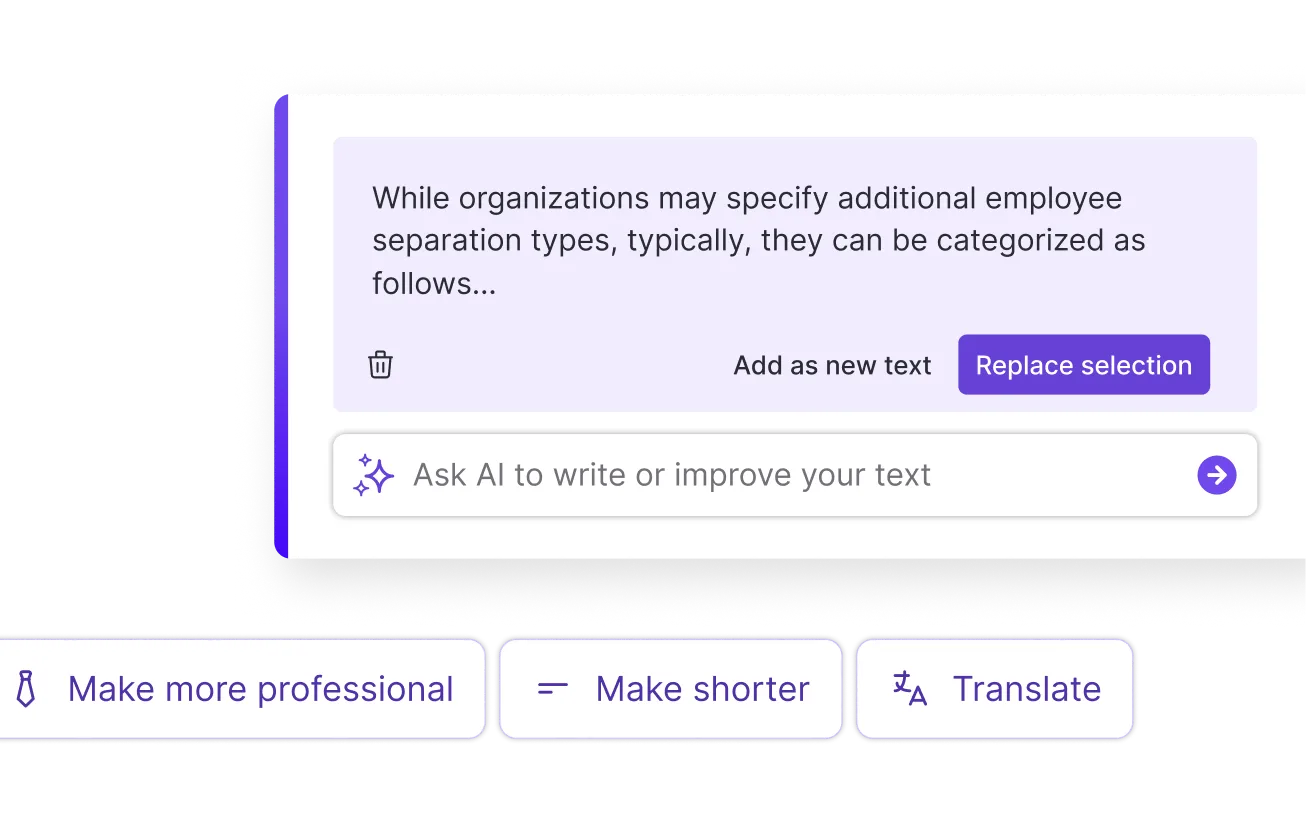
AI Writer and Translation
Enhance clarity, rewrite content, and instantly translate text to create accessible, global-ready visuals.
Smart Accessibility AI
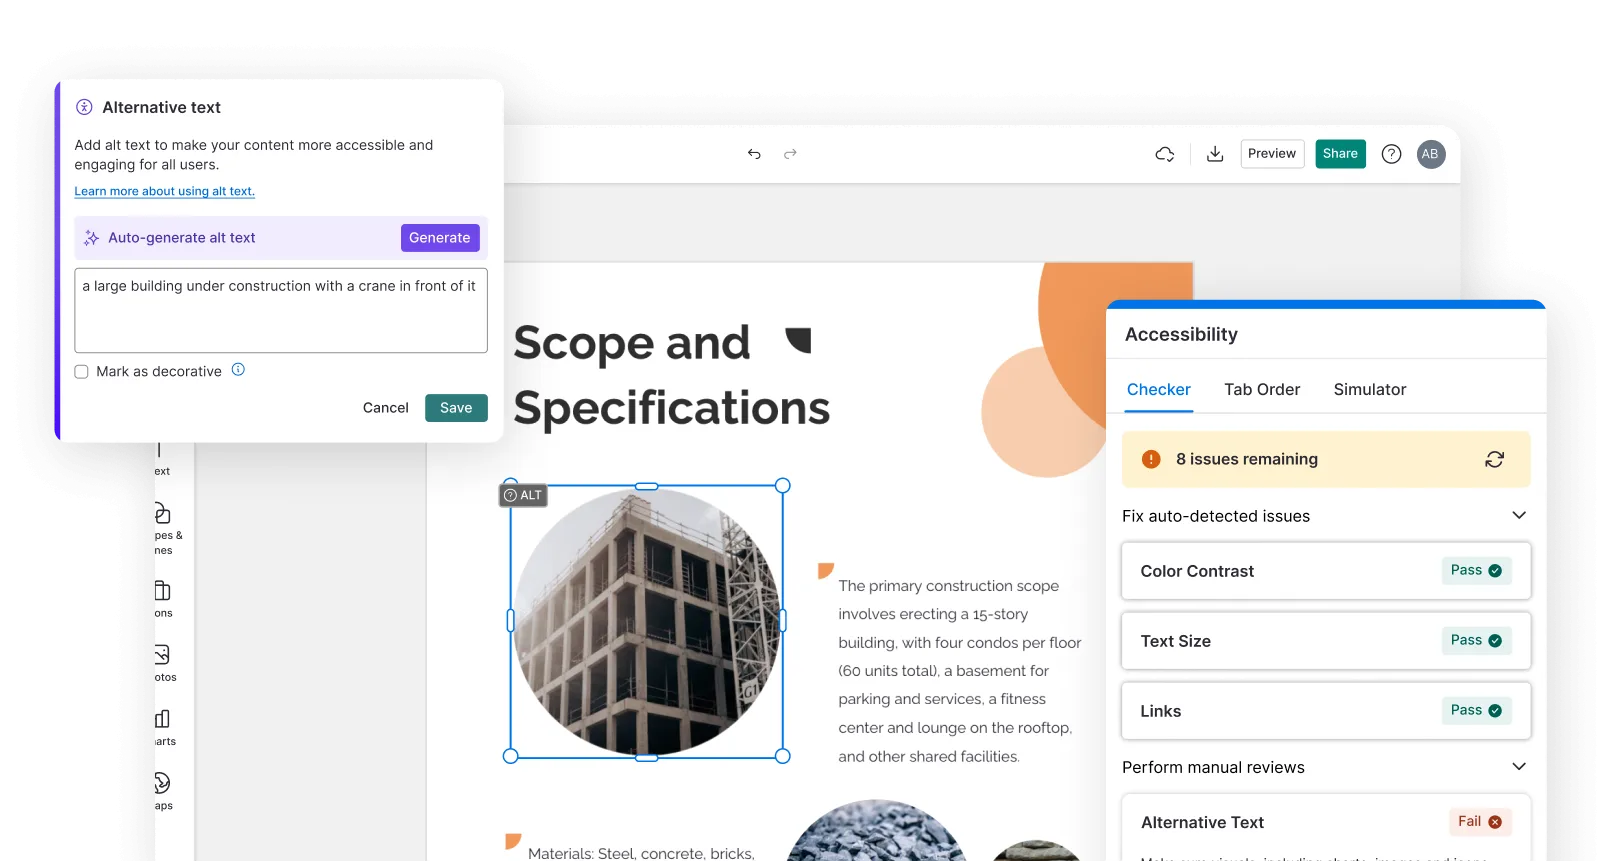
Ensure every project looks great and works for everyone. Use AI to write alt text check contrast, layout, and font readability, and export fully WCAG-compliant visuals and PDFs.
FAQs
Yes, you can fully customize all AI-generated templates on Venngage's platform.
Yes, Venngage offers a wide variety of data infographic designs to suit different needs and preferences. Whether you're looking for something sleek and modern, or more detailed and data-focused, you'll find numerous options to choose from in our extensive template library.
Yes, the AI-generated data infographics created using Venngage's tools are copyright-free. You can use them for both personal and commercial purposes without any restrictions on copyright. However, it's always good practice to ensure that any externally sourced content you include is also cleared for use.
We offer a free plan so you can try out all our AI features without spending anything. If you want more advanced features like private sharing and auto branding, we've got Premium and Business plans available too.

