Free AI Statistics Generator
Quickly generate accurate and relevant statistics to enhance your content, boost credibility, and engage your audience—all with just a few clicks.
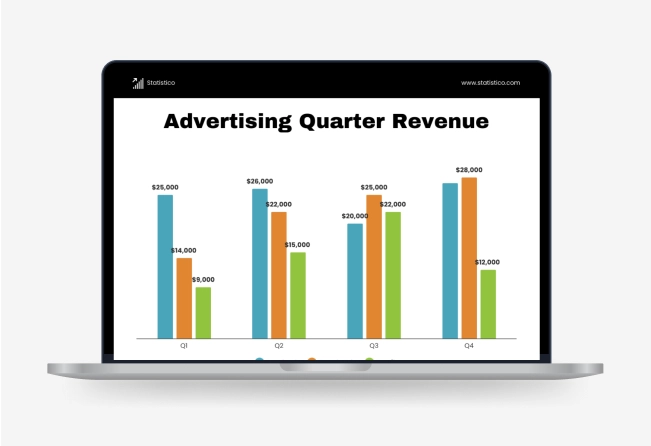
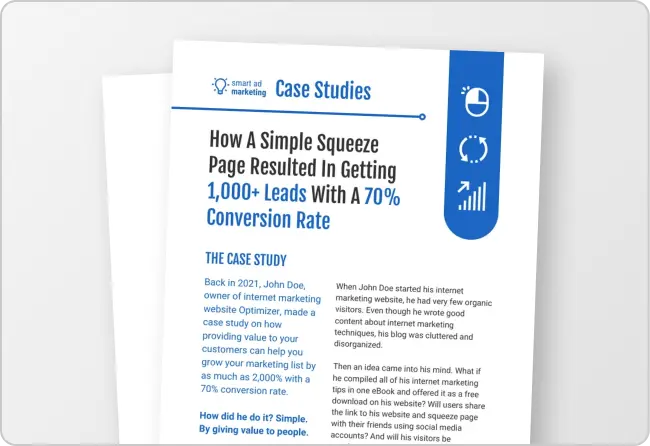
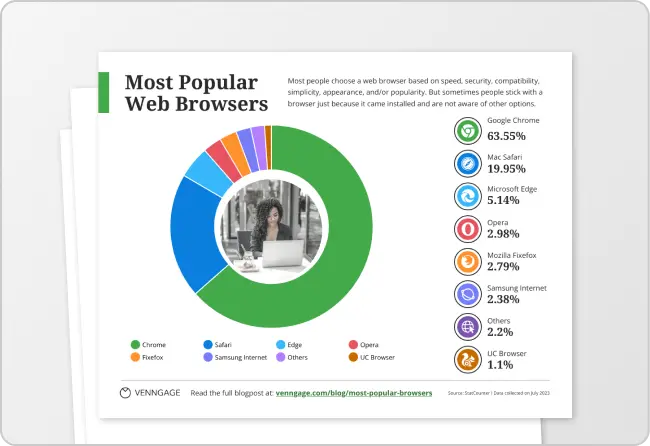
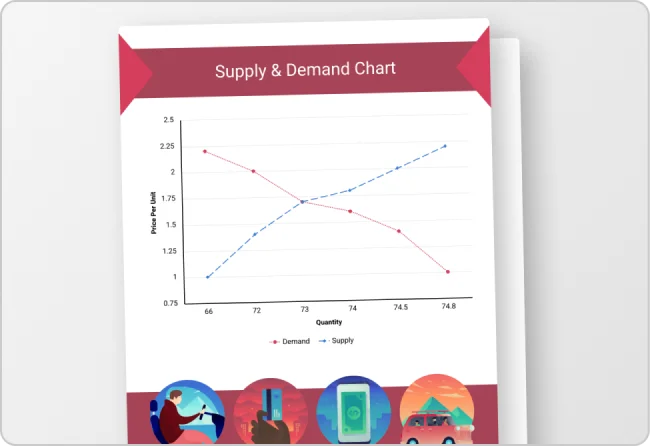
Visualize your data with statistical infographics
Explore popular designs
How to write a prompt that generates the instruction sheet you want?
Define the Topic: Start by clearly stating the subject or area you need statistics for. This helps ensure the data generated is relevant to your needs.
Specify Key Data Points: Mention the specific data or trends you want to include, like percentages, comparisons, or industry benchmarks, so the sheet is focused and informative.
Review for Accuracy and Clarity: Once the statistics are generated, take a moment to review them. Ensure they’re accurate, relevant, and easy to understand, so your audience can trust the insights.

Sample prompts you can modify and use
“Market Trends: Generate statistics on the latest trends in [industry], including market growth, consumer behavior, and key demographic insights.”
“Product Performance: Create statistics comparing the performance of [product] in terms of sales, customer satisfaction, and market share.”
“Economic Data: Generate key economic statistics for [country/region], such as GDP growth, unemployment rates, and inflation trends.”
“Social Media Insights: Create statistics on social media engagement, including follower growth, post reach, and interaction rates for [platform].”
How to generate accurate statistics using AI
Step 1: Define The Topic
Start by clearly stating the subject or area for which you need statistics. The more specific you are, the more accurate the results will be.
Step 2: Specify the Data Type
Identify the kind of data you need, such as percentages, averages, trends, or comparisons, to ensure the AI generates relevant statistics.
Step 3: Use Reliable Sources
Ensure the AI tool pulls from reputable and verified data sources.
Step 4: Generate the Statistics
Let the AI tool process the information and generate the statistics based on the details you’ve provided.
Step 5: Review for Accuracy
Once the statistics are generated, carefully check the results for accuracy and relevance.
Fast and Accurate Statistics Generation Made Easy
Let Venngage’s AI-powered statistics generator do the heavy lifting for you. Instead of spending time manually collecting and organizing data, simply input a few details, and the tool quickly generates accurate, relevant stats for your needs—whether it's for market research, performance analysis, or any other data-driven task.
This allows you to focus on refining your strategy and making decisions, while the tool takes care of gathering and presenting the data, saving you both time and effort.
Generate Statistics
Elevate Your Data with Beautiful Designs from Venngage’s Suite
Venngage makes it super easy to visualize your stats in a way that’s not only clear but also visually engaging. With just a few clicks, you can turn raw data into beautiful charts, graphs, and infographics that really make your numbers pop.
Having that visual element makes all the difference in making the data feel more accessible and impactful, especially when you're presenting to your team or clients.
Generate Statistics
Effortless Sharing for Teams, Clients, and Presentations
Venngage offers a variety of sharing options that make distributing your designs quick and easy. Whether you download your work as a PDF, PNG, or PPT, or share it directly via a private link or QR code, you have the flexibility to choose what works best for you.
This is especially important for professionals, teams, and clients who need seamless access to high-quality designs across various platforms. It ensures that your work remains professional and is easily accessible, whether you’re sharing internally or externally.
Generate Statistics
Fuel Your Creativity with AI-Powered Design Tools
Venngage is your one-stop shop for creating impactful presentations, infographics, reports, and more. It's a favorite among professionals, educators, and marketers for a reason:
AI Branding Automation
Instantly extract brand colors, fonts, and styles. Auto-apply your logo and visual identity to every design for seamless brand consistency.

DesignAI Generator
Turn simple prompts into stunning professional visuals in seconds. Describe what you need in plain language and watch our AI generate layouts optimized for maximum visual impact.

AI Content Auto-Fill
Kickstart your design process in seconds. Choose a template and let our AI auto-fill it with relevant, on-brand content, ideal for streamlining workflow and boosting productivity.

AI Generated Icons and Images
Create unique visuals that perfectly match your content and style. Generate custom illustrations, icons and images that align perfectly with your brand.

AI Writer and Translation
Enhance clarity, rewrite content, and instantly translate text to create accessible, global-ready visuals.

Smart Accessibility AI
Ensure every project looks great and works for everyone. Use AI to write alt text check contrast, layout, and font readability, and export fully WCAG-compliant visuals and PDFs.

FAQs
Absolutely. All AI-generated templates on Venngage's platform are fully customizable, allowing you to personalize colors, layouts, images, and more to match your unique vision.
Yes, Venngage offers a wide variety of statistical infographic designs to suit different needs and preferences. Whether you're looking for something sleek and modern, or more detailed and data-focused, you'll find numerous options to choose from in our extensive template library.
Yes, the AI-generated statistics are based on reputable data sources, ensuring accuracy and reliability. However, it’s always a good idea to review the results and make sure they align with your specific needs and goals.
We offer a free plan so you can try out all our AI features without spending anything. If you want more advanced features like private sharing and auto branding, we've got Premium and Business plans available too.