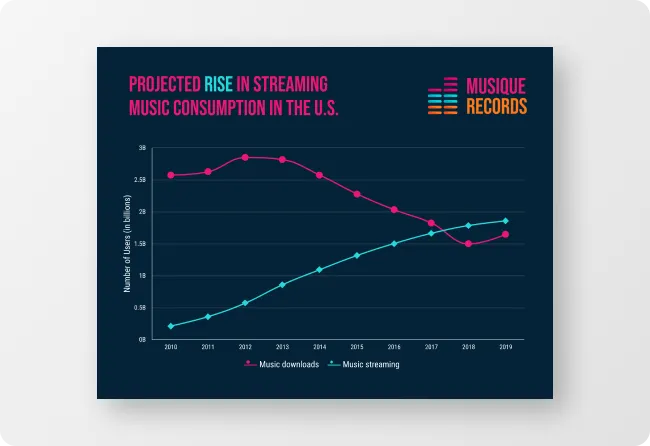
Free AI Graph Generator
Creating compelling graphs to showcase your insights can be challenging and time-consuming. Struggling with design and accuracy can hinder your impact. With our AI graph generator, simply enter an effective prompt, and we'll handle the rest. Now, making your insights stand out is easier than ever!
Browse through Graph Templates
AI-Powered Tools
How to write a prompt that generates the graphs you want?
Define Your Data: Define your data type, format, and goal of the graph, whether it's identifying trends, making comparisons, or understanding distributions.
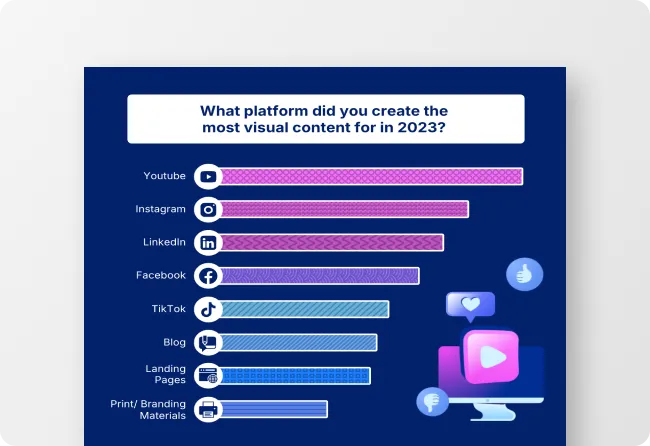
Choose Graph Type: Select an appropriate graph type to generate based on the story you want to tell, such as line graph, bar chart, pie chart, scatter plot, or another type.
Specify Formatting: Refine your graph by specifying formatting details like axis labels, color schemes, titles, and highlighting specific data points to emphasize key insights.
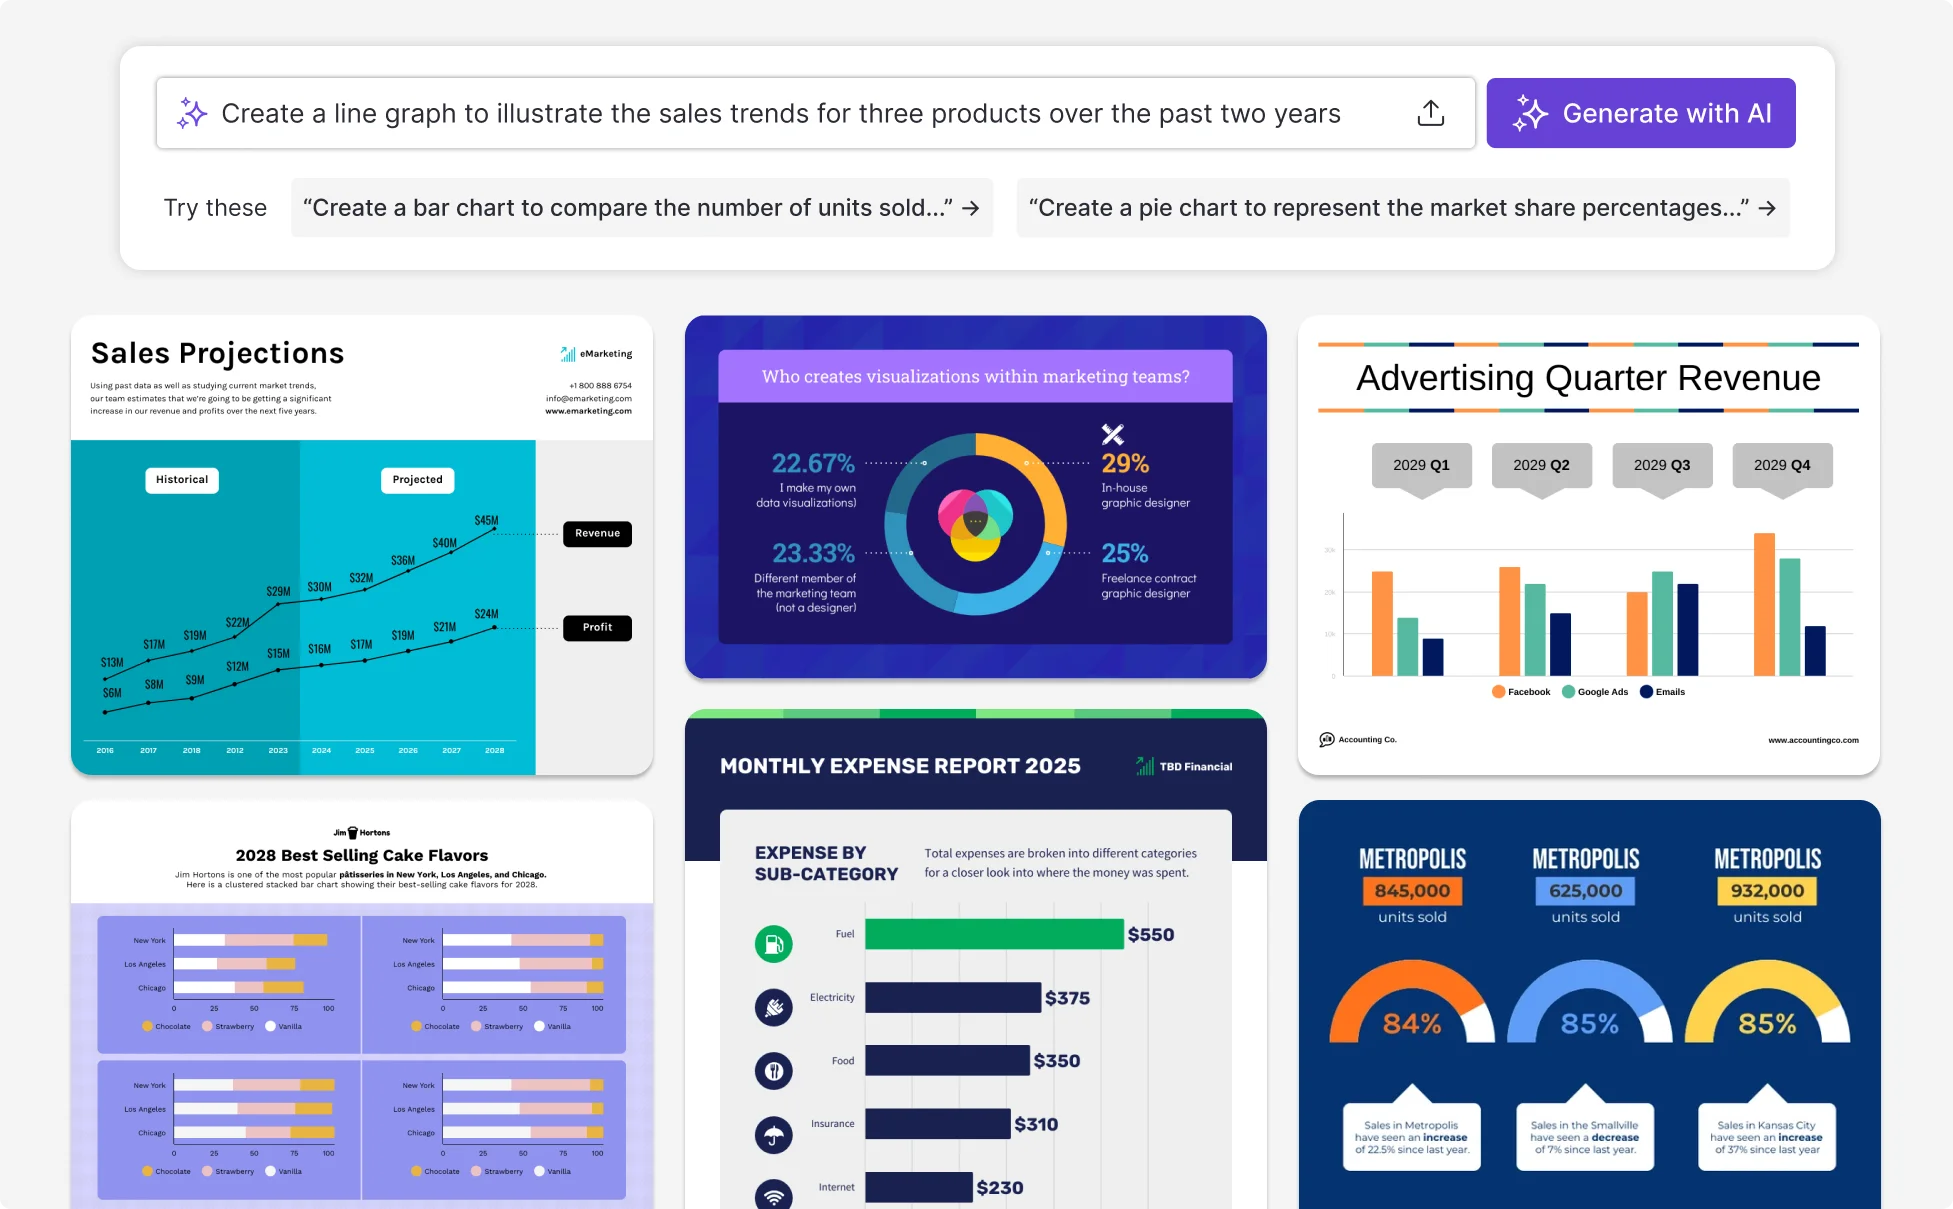
Sample prompts you can modify and use
“Create a bar graph comparing monthly sales of four products (A, B, C, D) from January to June. Use distinct colors and label axes clearly.”
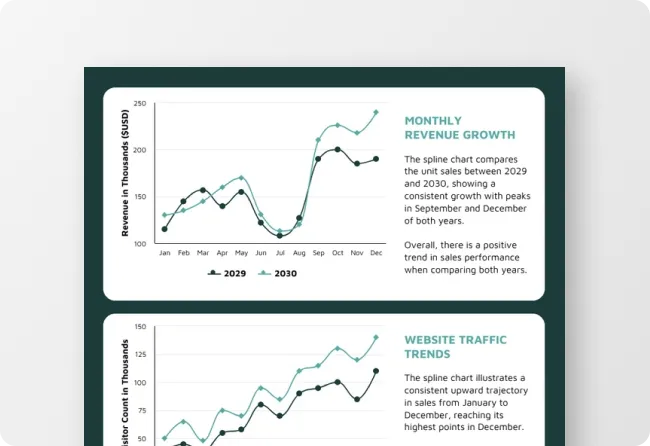
“Generate a line graph showing annual revenue growth from 2013 to 2023. Include a trend line and label axes appropriately.”
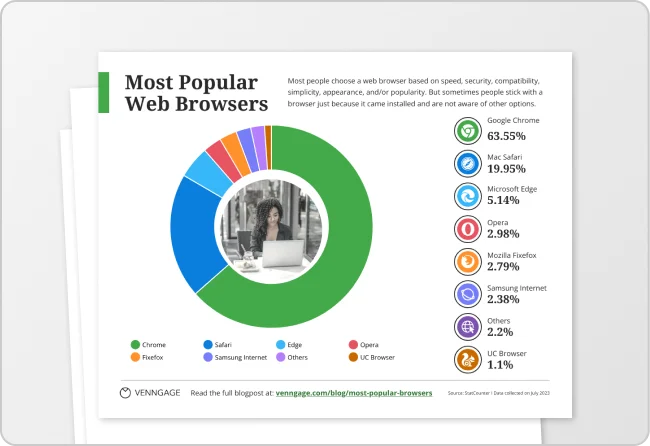
“Design a pie chart displaying market share of smartphone brands (A, B, C, D, E). Use contrasting colors and label each slice with percentage.”
“Generate a scatterplot to show the relationship between advertising expenditure and sales revenue over 12 months. Include a trend line and label axes clearly.”
How to create a graph using AI
Step 1: Define Your Objectives
State the core objectives of your graph and outline its purpose, the target audience, and key message(s) to ensure effective visualization.
Step 2: Define Graph Type and Design
Select a graph type for your data and define design elements like color scheme and to ensure your graph is visually appealing and effectively conveys your message.
Step 3: Craft Your AI Prompt
Craft a clear and detailed prompt that includes information about graph type, design elements, color scheme, and data to be visualized.
Step 4: Review and Refine
Once the AI generates your graph, review the draft and make necessary adjustments to ensure it reflects your goal and communicates the message you want to share.
Step 5: Finalize and Share
After editing your AI-generated graph, confirm all elements are correct and then finalize it to ensure it is ready for distribution.
Instantly Generate AI Graphs That Elevate Your Insights
Data storytelling is easier when your visuals are clear and compelling. Venngage’s AI graph generator helps analysts, educators, and business leaders transform complex datasets into professional, brand-aligned visuals that make your message stand out.
Simply upload your data, set your preferences, and let AI produce graphs that highlight your key points. Sign up free and present insights with clarity, confidence, and impact.
Generate Graphs with AI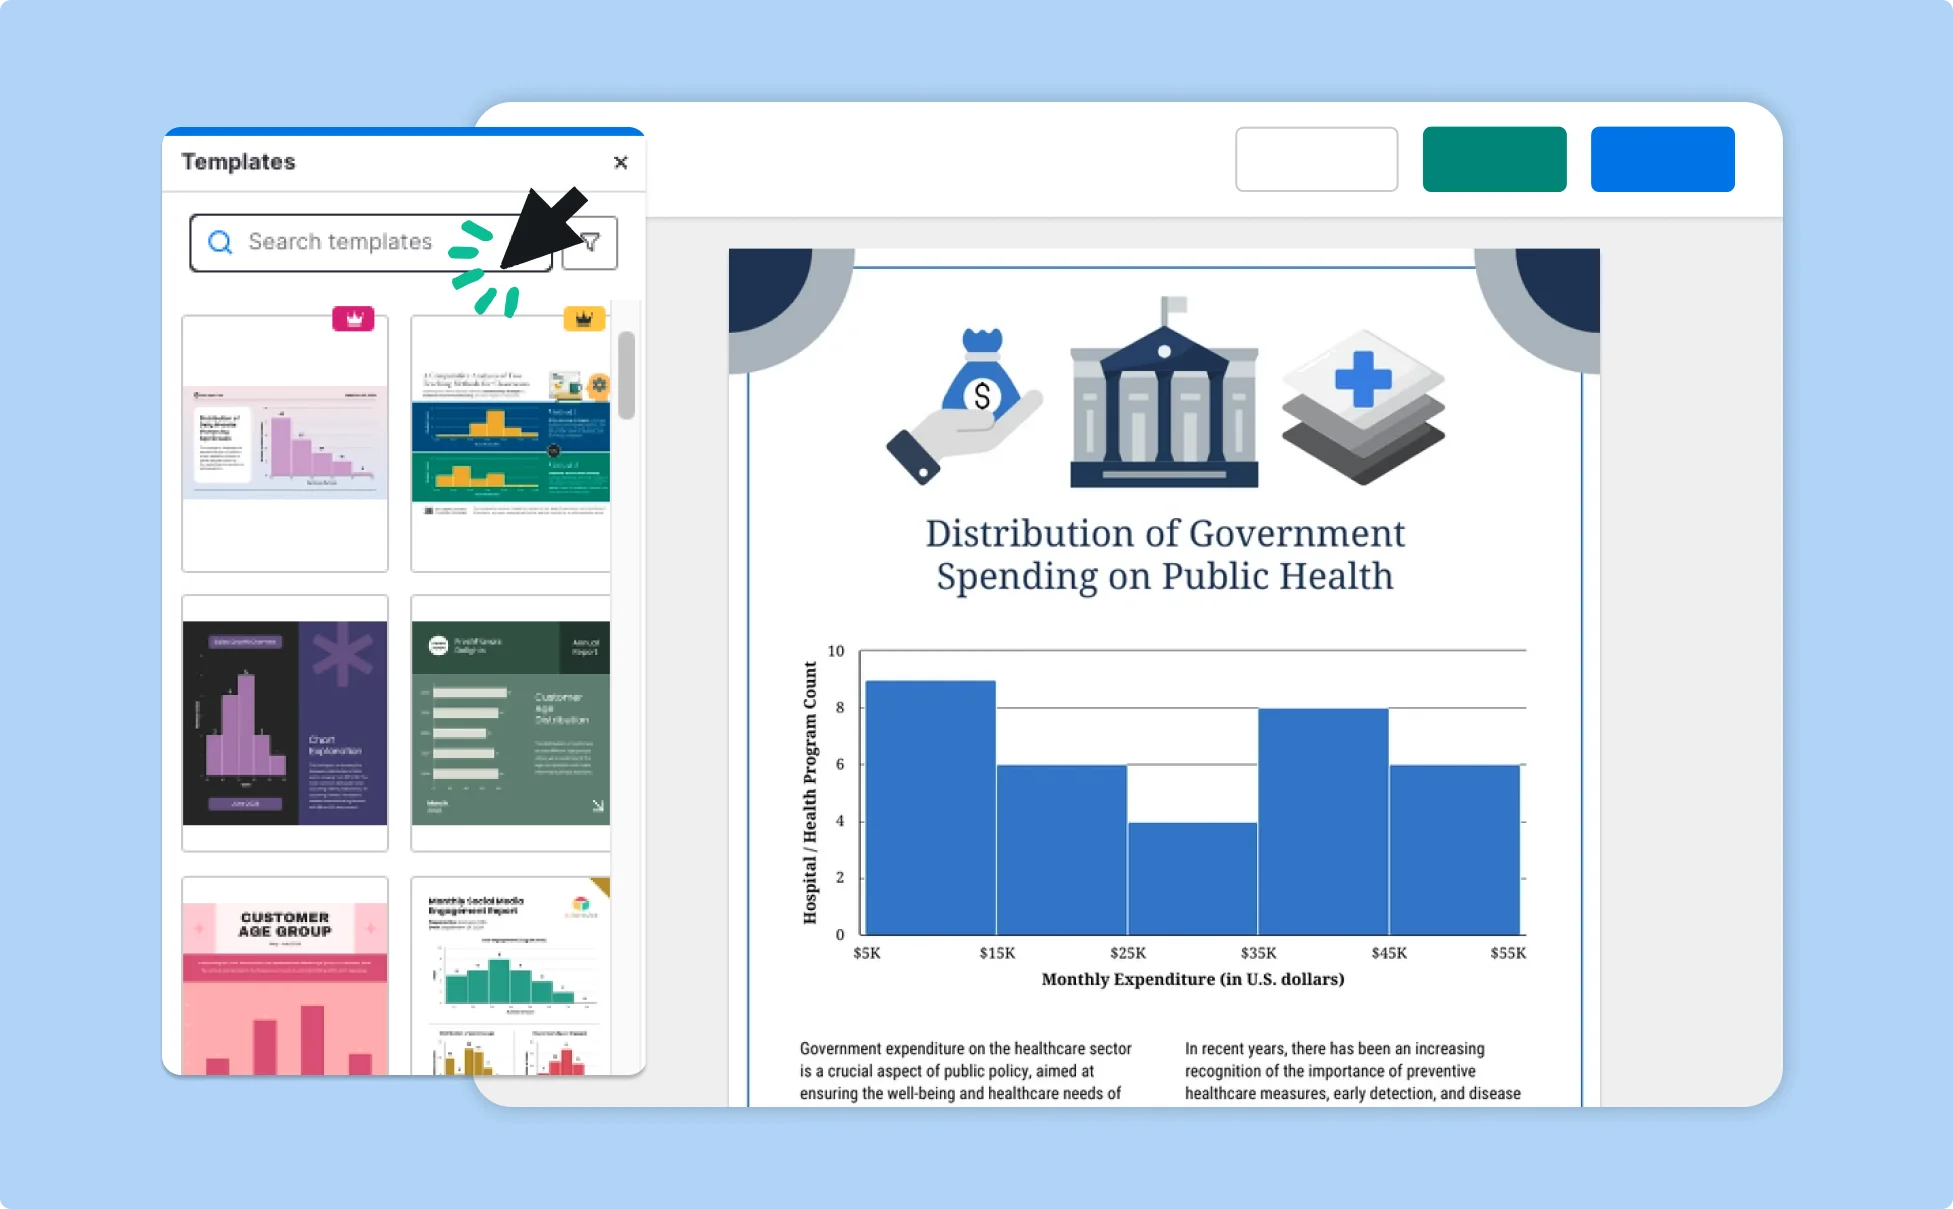
Save Hours with AI Graph Creation and Seamless Data Integration
Skip the time-consuming formatting. Venngage’s AI-powered graph maker allows marketers, research teams, and financial planners to create high-quality, on-brand visuals in minutes—no technical expertise needed.
With our intuitive editor, integrating and customizing data is effortless, ensuring accuracy and visual consistency. Sign upfor free to produce professional graphs faster and focus on the insights that matter.
Generate Graphs with AI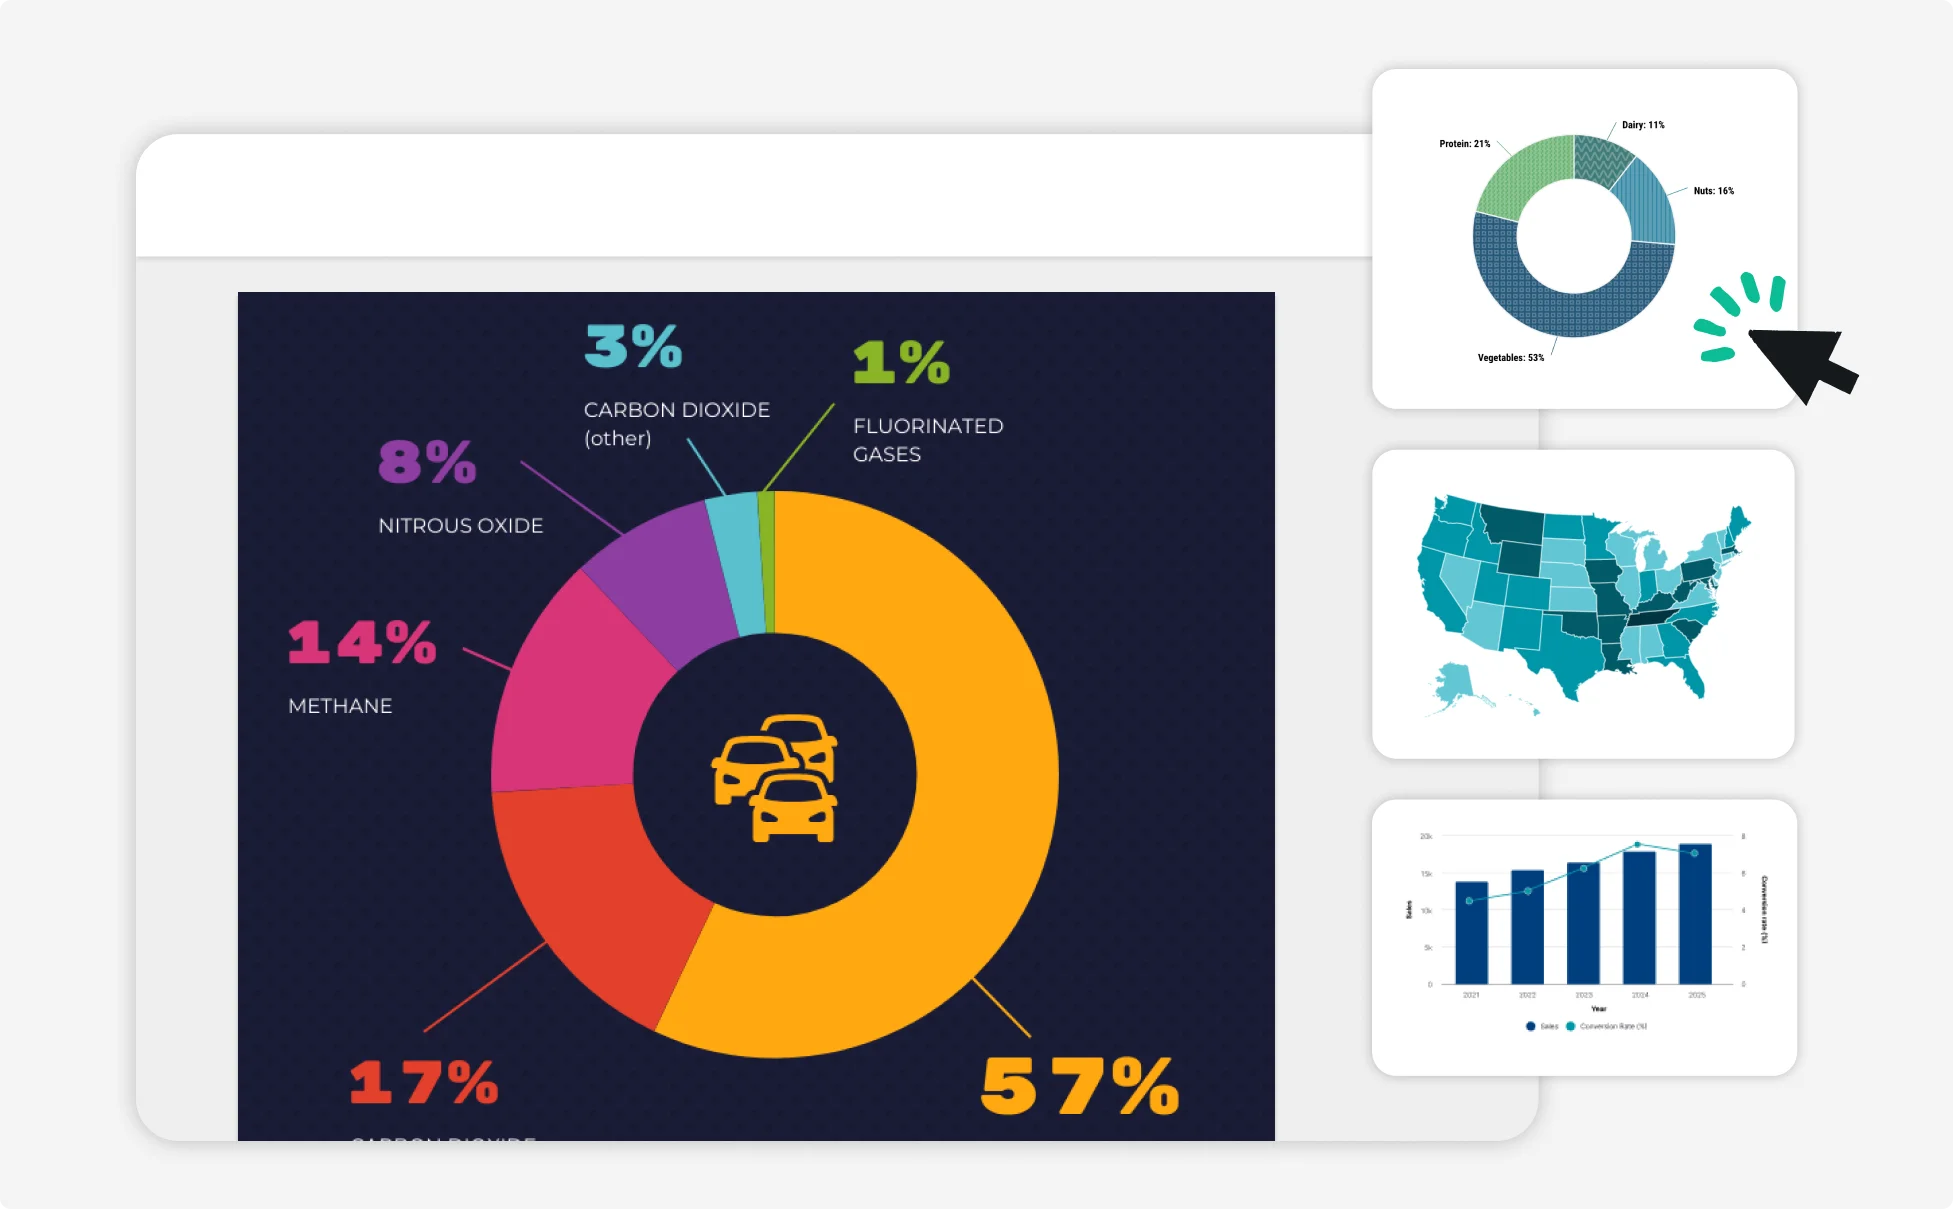
Turn Data into Engaging, AI-Generated Visuals
Make graph creation less of a chore and more of a creative process. With Venngage’s AI graph generator, teachers, nonprofits, and corporate teams can turn statistics into accurate, captivating visuals in minutes.
Our user-friendly platform combines powerful AI design with seamless data integration for a smooth, enjoyable experience.
Generate Graphs with AI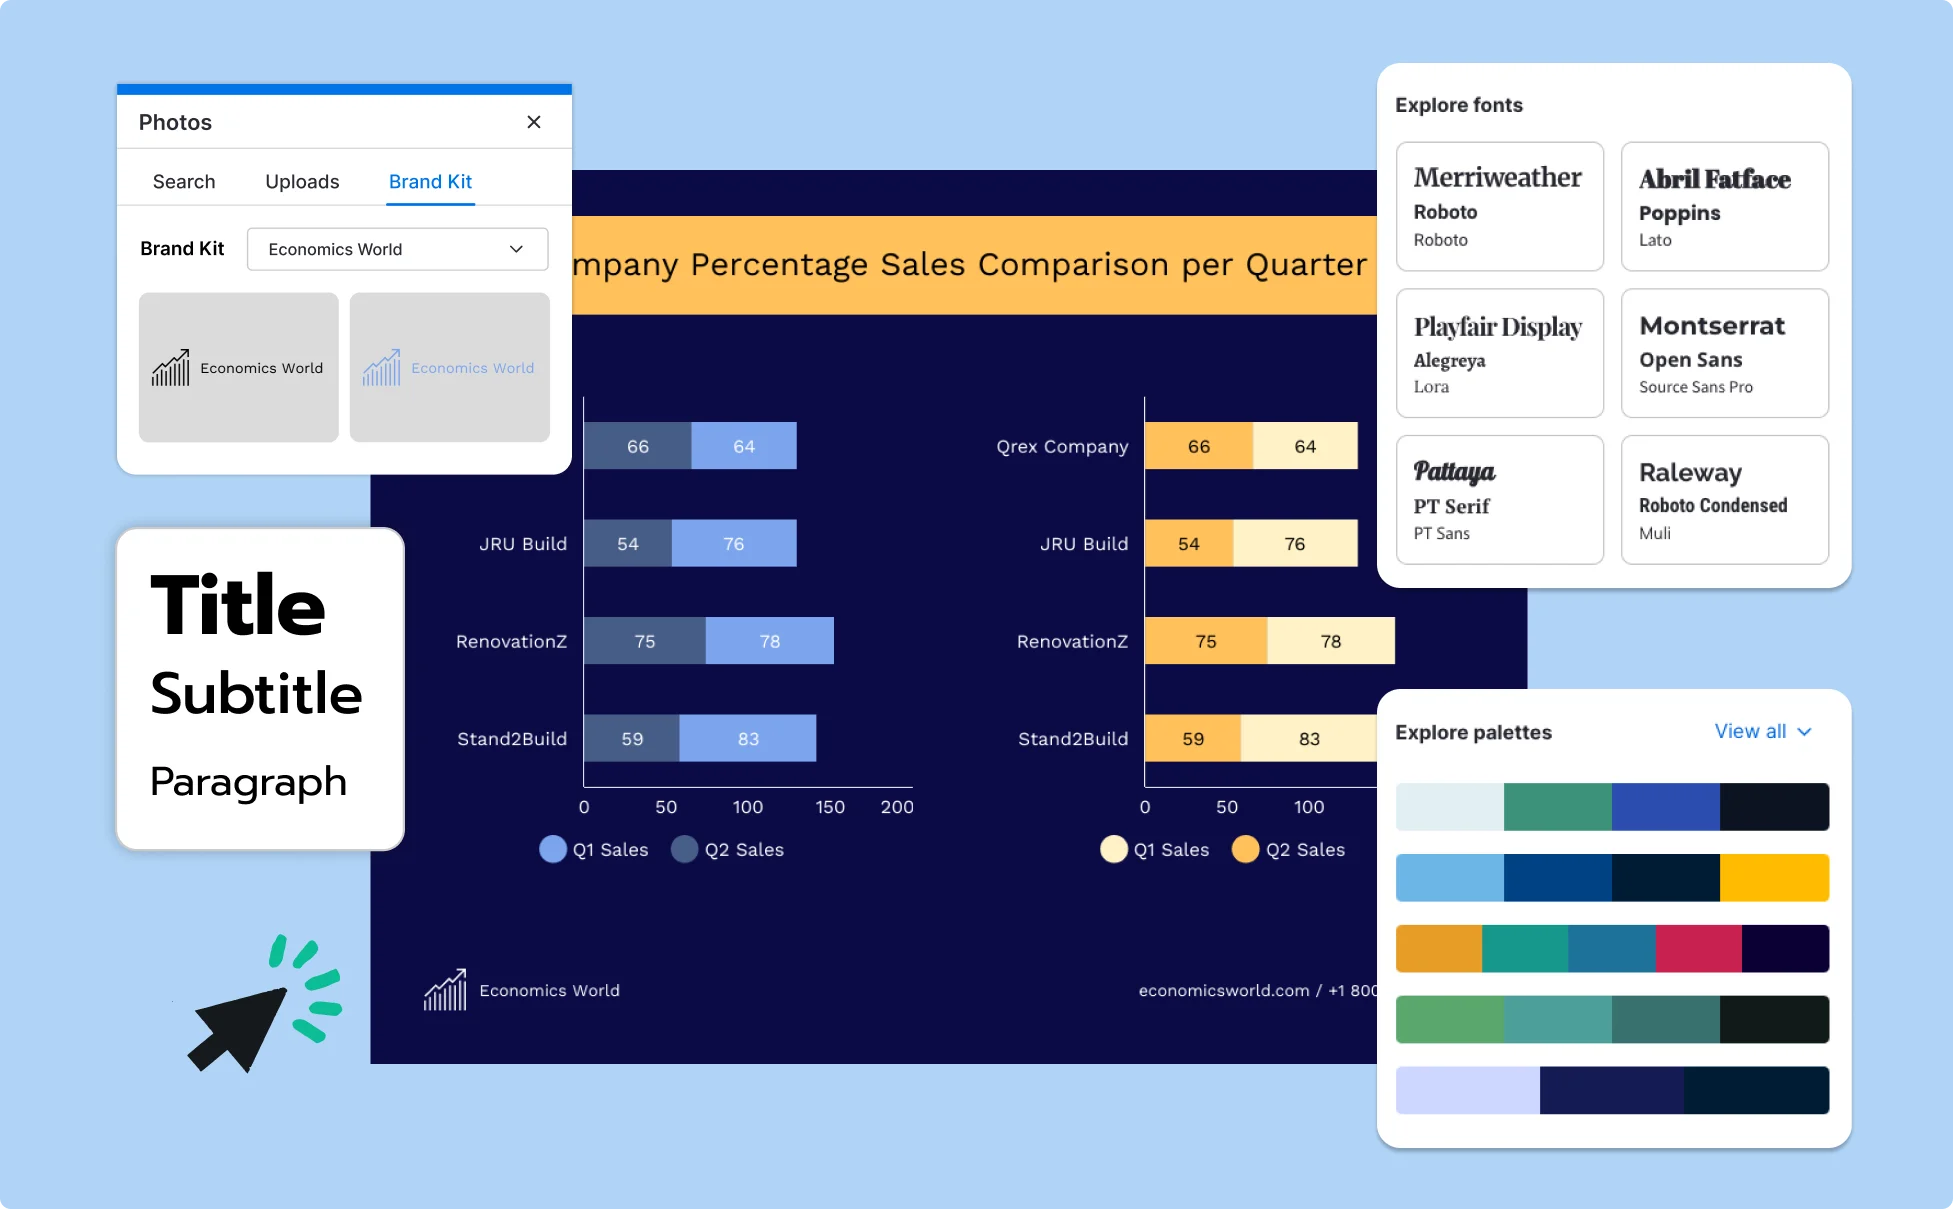
Fuel Your Creativity with AI-Powered Design Tools
Venngage is your one-stop shop for creating impactful presentations, infographics, reports, and more. It's a favorite among professionals, educators, and marketers for a reason:
AI Branding Automation
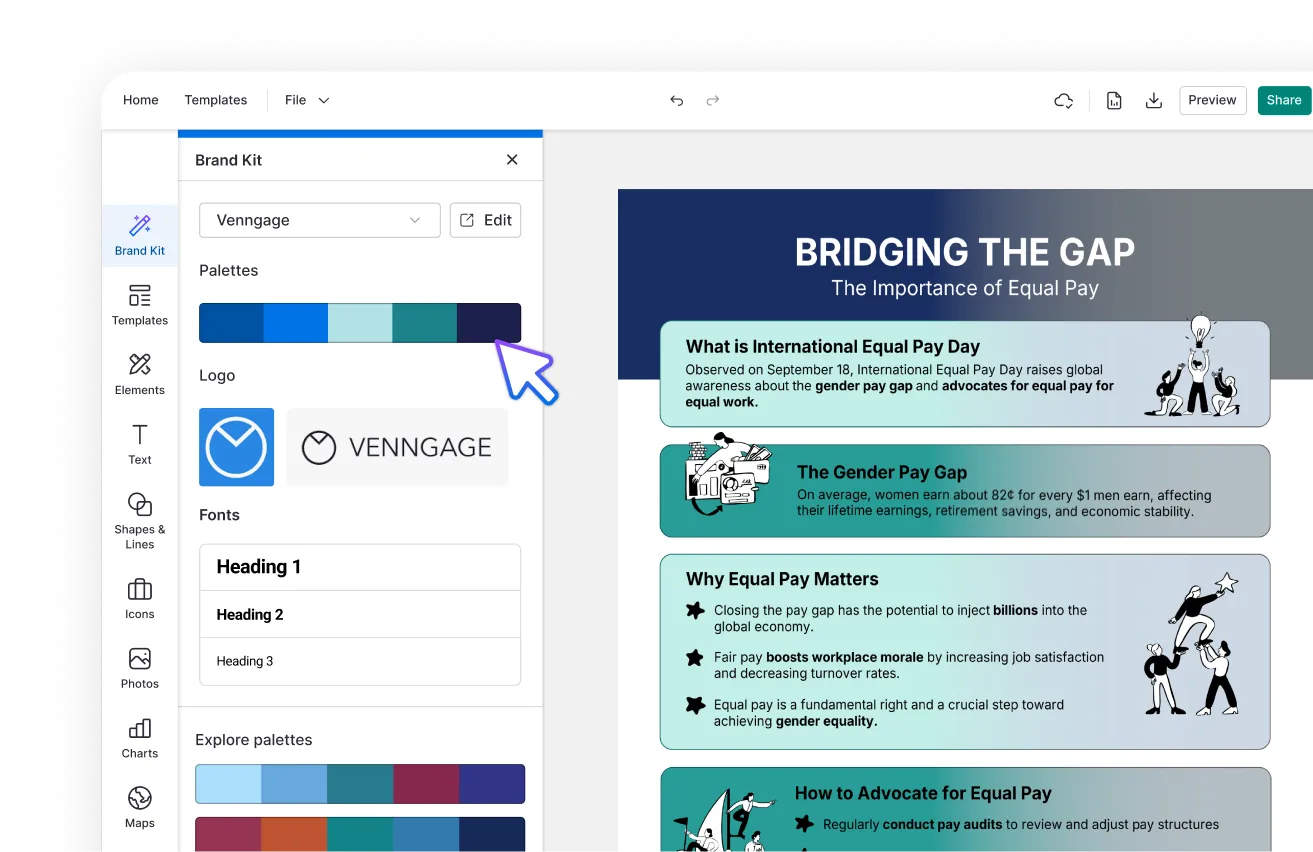
Instantly extract brand colors, fonts, and styles. Auto-apply your logo and visual identity to every design for seamless brand consistency.
DesignAI Generator
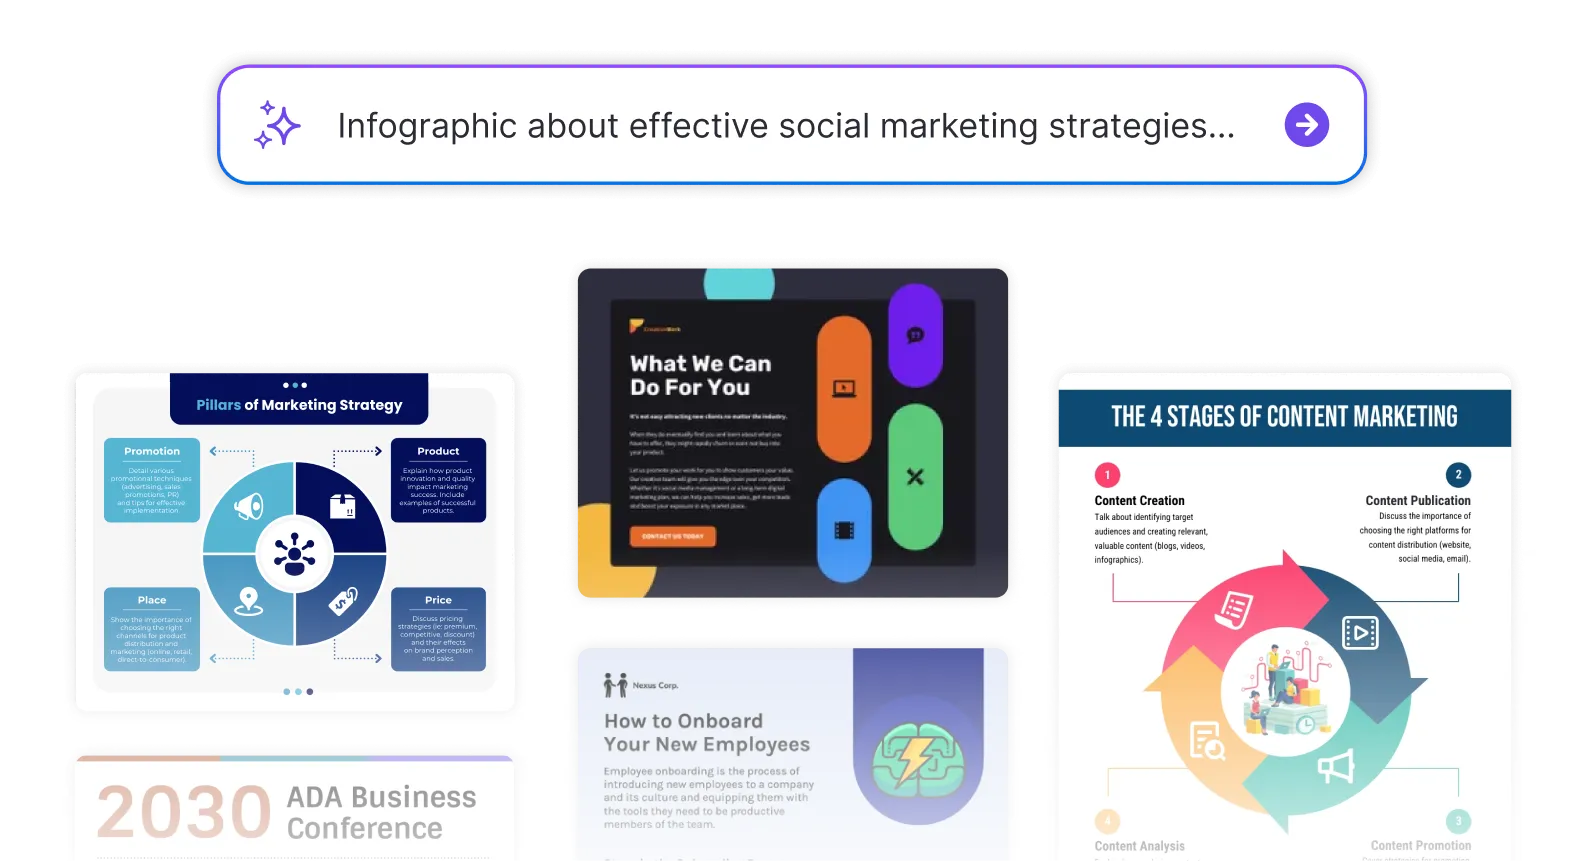
Turn simple prompts into stunning professional visuals in seconds. Describe what you need in plain language and watch our AI generate layouts optimized for maximum visual impact.
AI Content Auto-Fill
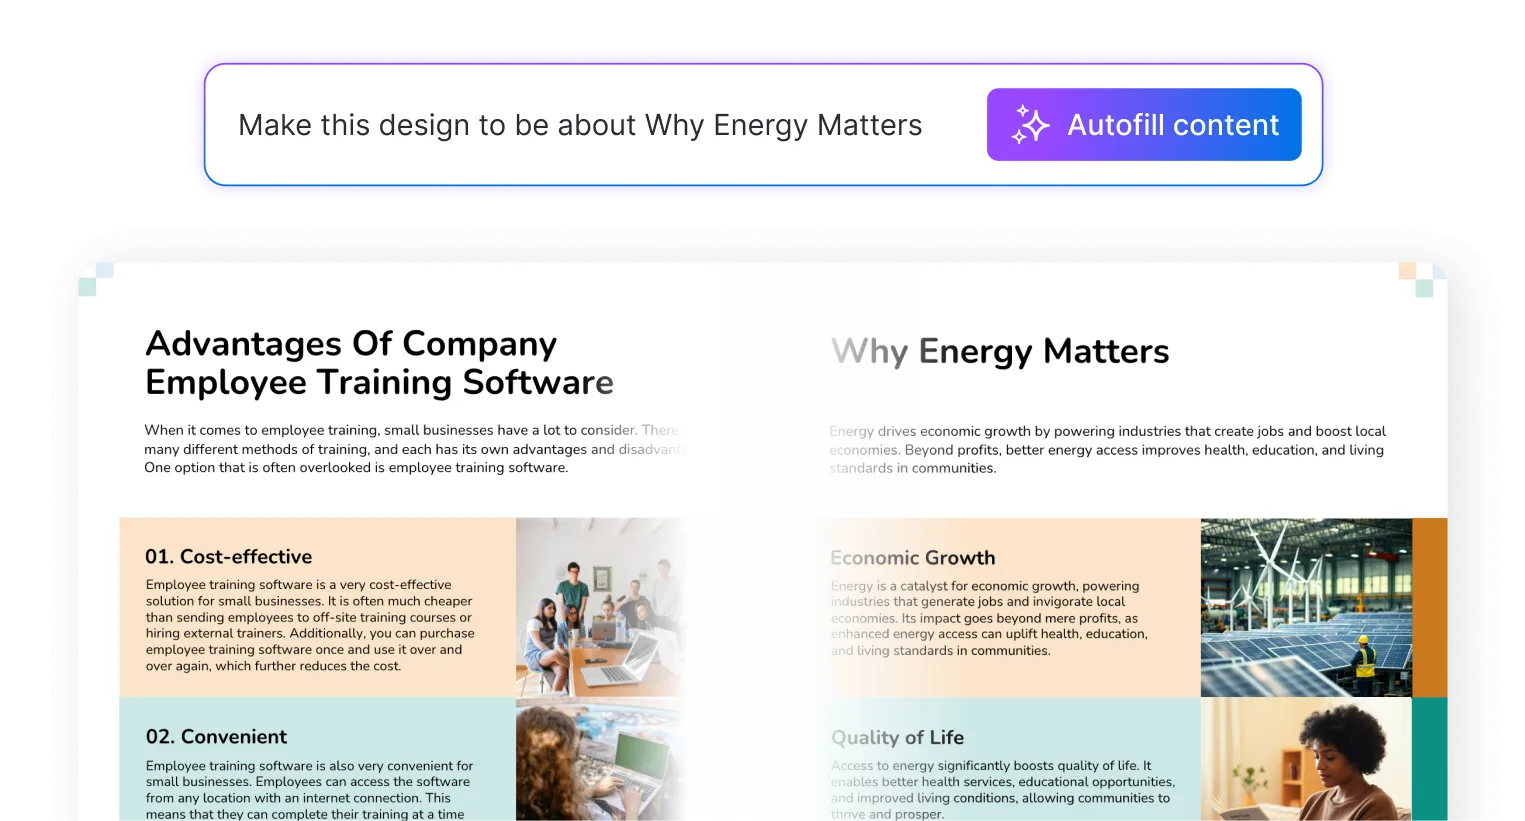
Kickstart your design process in seconds. Choose a template and let our AI auto-fill it with relevant, on-brand content, ideal for streamlining workflow and boosting productivity.
AI Generated Icons and Images
Create unique visuals that perfectly match your content and style. Generate custom illustrations, icons and images that align perfectly with your brand.

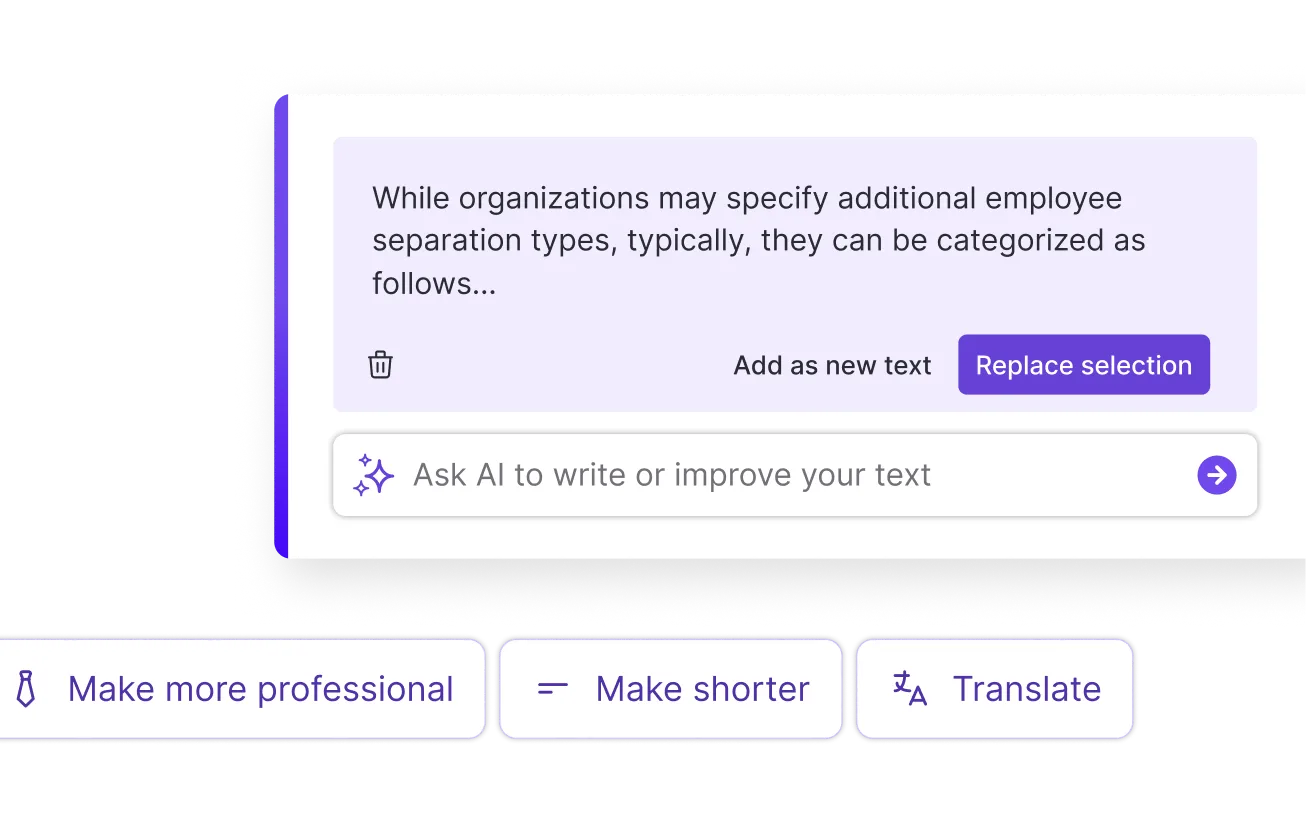
AI Writer and Translation
Enhance clarity, rewrite content, and instantly translate text to create accessible, global-ready visuals.
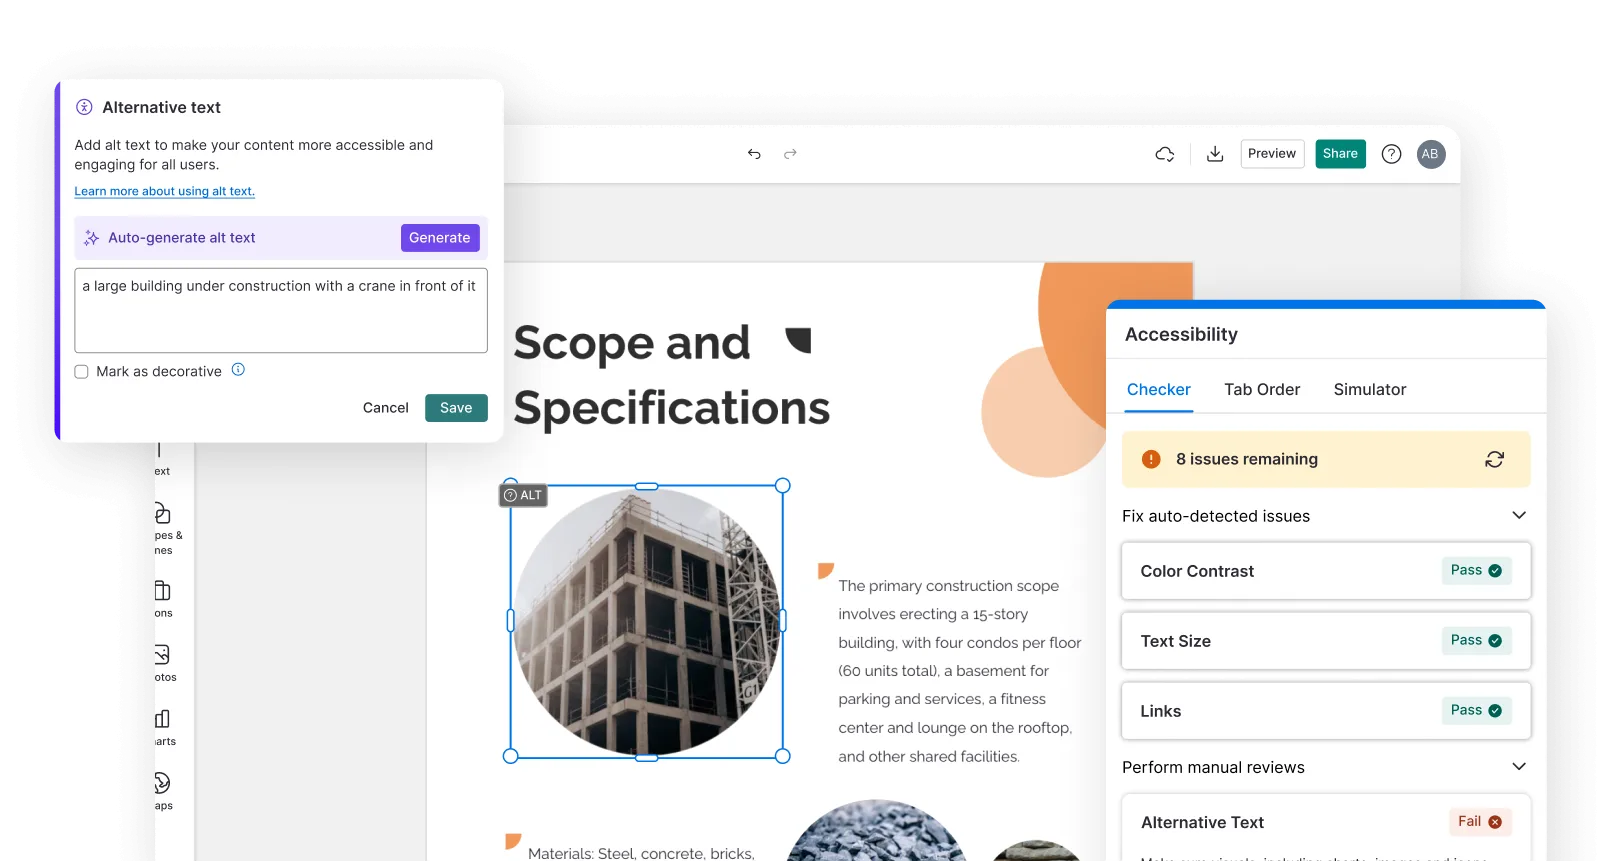
Smart Accessibility AI
Ensure every project looks great and works for everyone. Use AI to write alt text check contrast, layout, and font readability, and export fully WCAG-compliant visuals and PDFs.
FAQs
Yes, you can fully customize all AI-generated templates on Venngage's platform.
Yes, Venngage offers a wide variety of graphs designs to suit different needs and preferences. Whether you're looking for something sleek and modern, or more detailed and data-focused, you'll find numerous options to choose from in our extensive template library.
Yes, the AI-generated graphs created using Venngage's tools are copyright-free. You can use them for both personal and commercial purposes without any restrictions on copyright. However, it's always good practice to ensure that any externally sourced content you include is also cleared for use.
We offer a free plan so you can try out all our AI features without spending anything. If you want more advanced features like private sharing and auto branding, we've got Premium and Business plans available too.
