
Donut Chart Marketing Stats Template
Communicate important data such as market segments and growth trends with this Donut Chart Marketing Stats Template from Venngage.

 100% customizable templates
 Millions of photos, icons, charts and graphics
 AI-powered editing features
 Effortlessly share, download, embed and publish
 Easily generate QR codes for your designs
 Accessible and WCAG-compliant
- Design stylemodern, fun
- Colorslight
- SizeCustom (816 x 780 px)
- File typePNG, PDF, PowerPoint
- Planfree
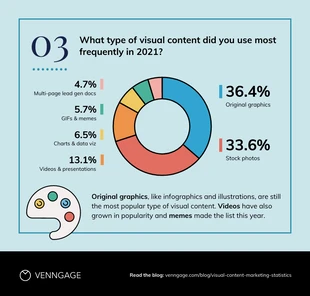
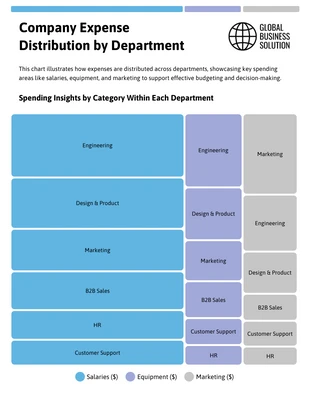
If you are in need of a method to simplify complex information, data, or statistics about your company, using a visually-engaging material such as a chart can help. And when it comes to segmenting important market statistics, donut pie charts are one of the best ways to display your information. If you don’t have enough experience in creating high-quality, professional charts for business, don’t fret. This donut chart marketing stats template from Venngage is designed to help you relay complex business statistics in a visually appealing, easy to understand manner. Pie charts are graphical representations of information, data, or statistics that uses segments or “slices” to show relative proportions compared to the whole. The total value of all the segments in a pie chart, when added together, is 100%. Thus, if you are looking for a way to represent a part of the whole, using donut-shaped pie charts is one of the most effective ways to do it. Companies and businesses who create their own pie charts to display data to their customers and stakeholders have a distinct advantage over those who
Related Chart Templates
stacked charts
pie charts
pie charts
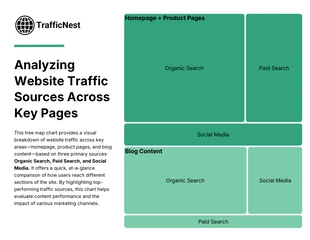
tree map charts
tree map charts
tree map charts
tree map charts

column charts

pie charts
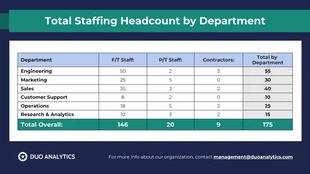
table charts
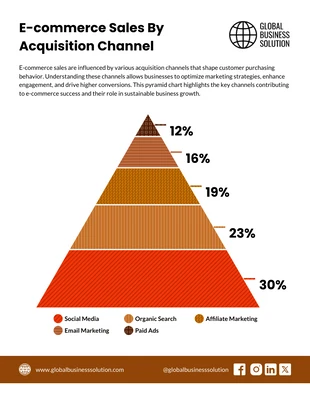
pyramid charts
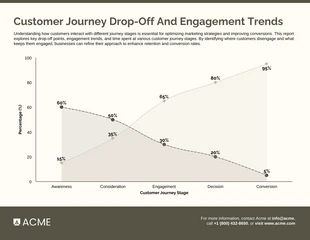
area charts