
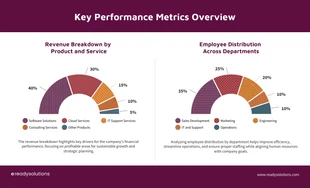
Visual Content Maketing Half Donut Pie Chart Template
Show important data, comparisons, growth trends, and more with this customizable Half Donut Chart Marketing Stats Template from Venngage.

 100% customizable templates
 Millions of photos, icons, charts and graphics
 AI-powered editing features
 Effortlessly share, download, embed and publish
 Easily generate QR codes for your designs
- Design stylemodern, fun
- Colorslight
- SizeCustom (816 x 635 px)
- File typePNG, PDF, PowerPoint
- Planpremium
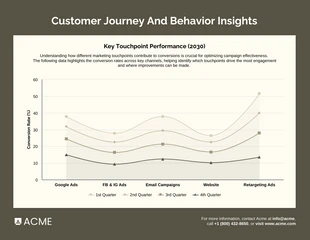
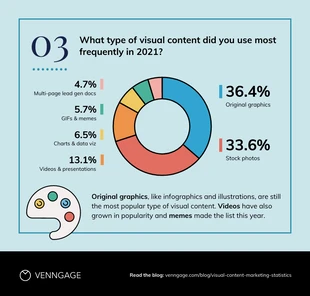
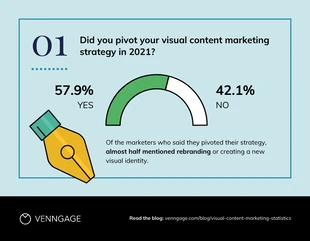
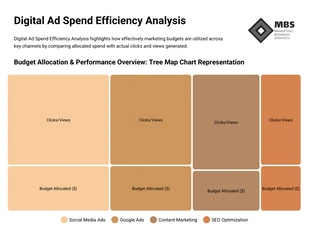
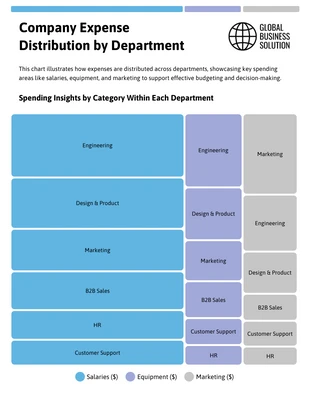
Do you need to create a visual representation of important data such as trends, growth rates, comparisons, percentages, and more? Are you looking for an efficient and effective way to communicate complex information to your audience without having to resort to walls of text? If your answer to these questions is yes, then you need a pie chart to help simplify your complex information. And if you are not skilled at creating high-quality and professional charts on your own, this half donut chart marketing stats template can help you get started on the right path. Pie charts are graphical representations of data that use segmentation or “slices” to show relationships between different variables. Unlike linear charts or bar graphs that show growth trends between each variable, pie charts are used to show a percentage of a variable as part of the whole. Pie charts are effective when used as a segmentation tool. For example, if you want to show the percentage of marketing budget for your company every year, you can use a pie chart to show how much of your
Related Chart Templates
stacked charts
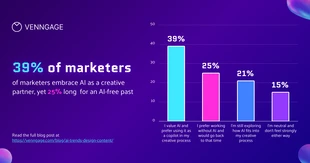
pie charts
pie charts
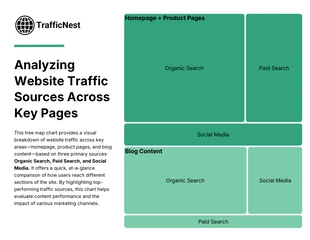
tree map charts
tree map charts
tree map charts
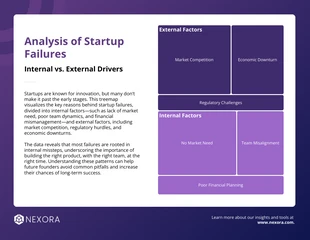
tree map charts
column charts

pie charts
pie charts
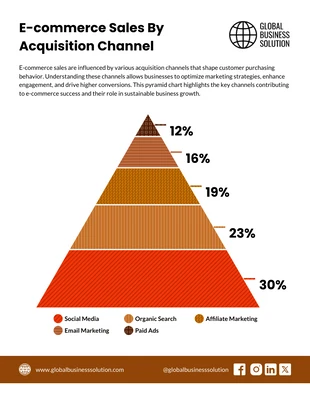
pyramid charts
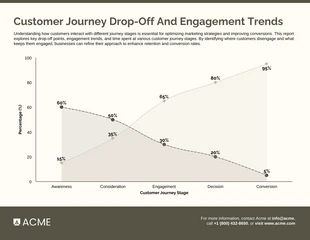
area charts