
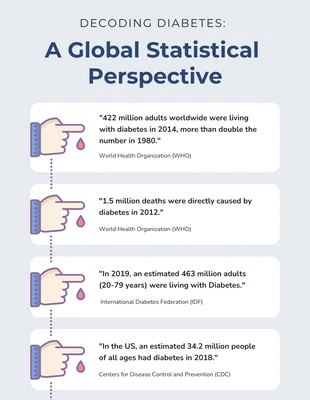
Diabetes Statistics Infographic Template
Create a statistics infographic about one of the most common diseases affecting people today. Use this Diabetes Statistics infographics from Venngage.

 100% customizable templates
 Millions of photos, icons, charts and graphics
 AI-powered editing features
 Effortlessly share, download, embed and publish
 Easily generate QR codes for your designs
- Design stylemodern
- Colorsvibrant
- SizeLetter (11 x 8.5 in)
- File typePNG, PDF, PowerPoint
- Planfree
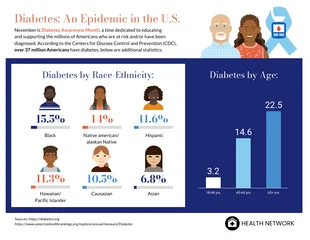
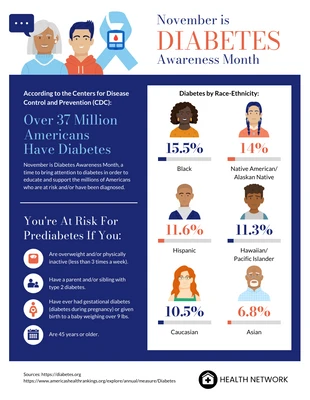
Sharing crucial information with your audience can be a challenging task. However, there are ways to grab your readers' attention and make them want to learn more about a certain topic. The secret? Make the information accessible, easy to understand, and less complicated. If your goal is to learn more about diabetes and its effects on the human body, as well as the different diabetes stats by race-ethnicity, then customizing this Diabetes Statistics chart is the answer to your problem. Within minutes, you can spread awareness about this topic and create your own diabetes chart through Venngage’s online template editor. Using a chart is one of the most effective ways to spread awareness and information in a manner that is easy to understand. Instead of using long text paragraphs or complex numbers to describe your data, you can simply use a bar chart to get your message across. Visually engaging marketing tools such as bar charts are not only easy to understand, but they are easy to remember as well. Because charts are designed to simplify complex information, these visual representations of
Related Infographic Templates
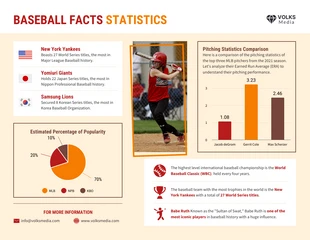
baseball infographics
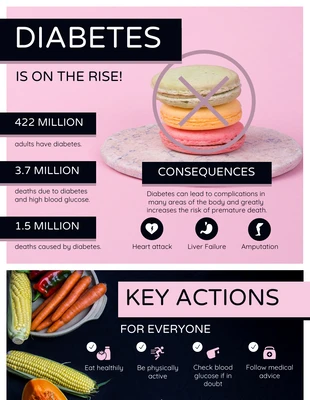
health infographics
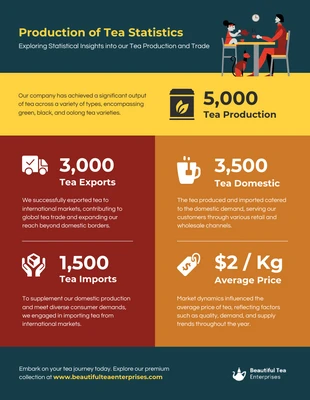
tea infographics
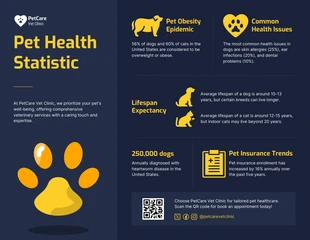
pet infographics

cartoon infographics
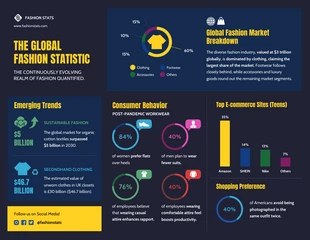
fashion infographics
informational infographics
statistical infographics
health infographics
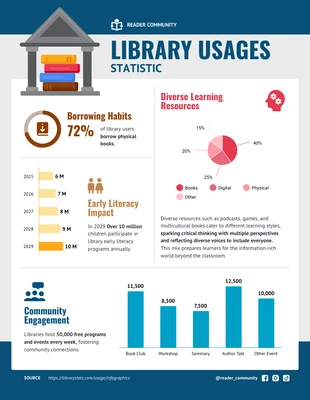
library infographics
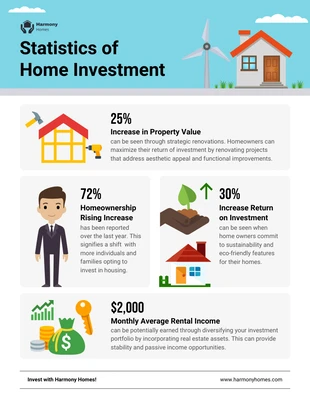
house infographics
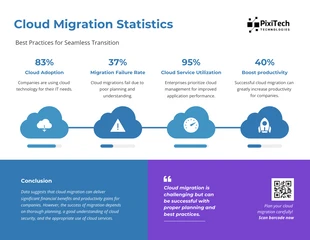
cloud infographics