
Ebony Clay Visualizing Data in LMS Infographic Template
Make a classic dark visualizing data in LMS infographic by simply editing this dark visualizing data in LMS infographic template.

 100% customizable templates
 Millions of photos, icons, charts and graphics
 AI-powered editing features
 Effortlessly share, download, embed and publish
 Easily generate QR codes for your designs
- Design stylemodern
- Colorsdark
- SizeCustom (816 x 3900 px)
- File typePNG, PDF, PowerPoint
- Planfree
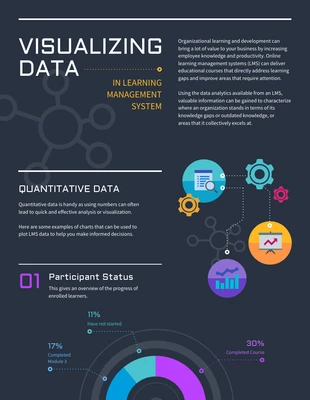
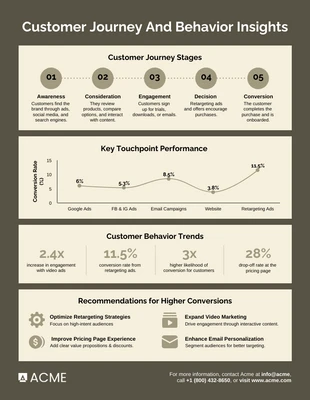
By leveraging big data analytics, educational institutions can get a better handle of what their students want and how they learn. Using the collected information, institutions can improve study programs and make learning more relevant. The Dark Visualizing Data in LMS Infographic template is an effective visual aid which you could use to educate your learners about the value of big data analytics. This infographic template seeks to describe the modus operandi of big data analysis and how it can impact a student's learning journey – by opening doors to new possibilities, by addressing issues comprehensively, and by delivering targeted feedback. Create a professional dark visualizing data in LMS infographic using Venngage’s dark visualizing data in LMS infographic template. You don’t need to be a designer, have design experience, or download any design tools to customize this dark visualizing data in LMS infographic. Design a professional dark visualizing data in LMS infographic using Venngage’s dark visualizing data in LMS infographic template. Click create to get started with this Linkedin infographic template. All you have to do is learn how to use the
Related Infographic Templates
statistical infographics
health infographics
circle infographics
statistical infographics
marketing infographics
statistical infographics
product infographics
research infographics
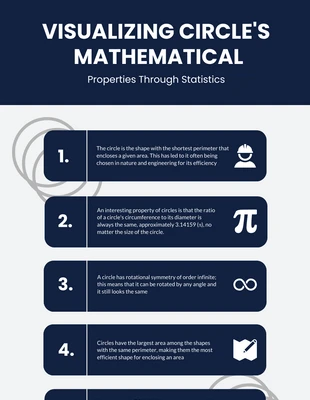
circle infographics
list infographics
health infographics
circle infographics