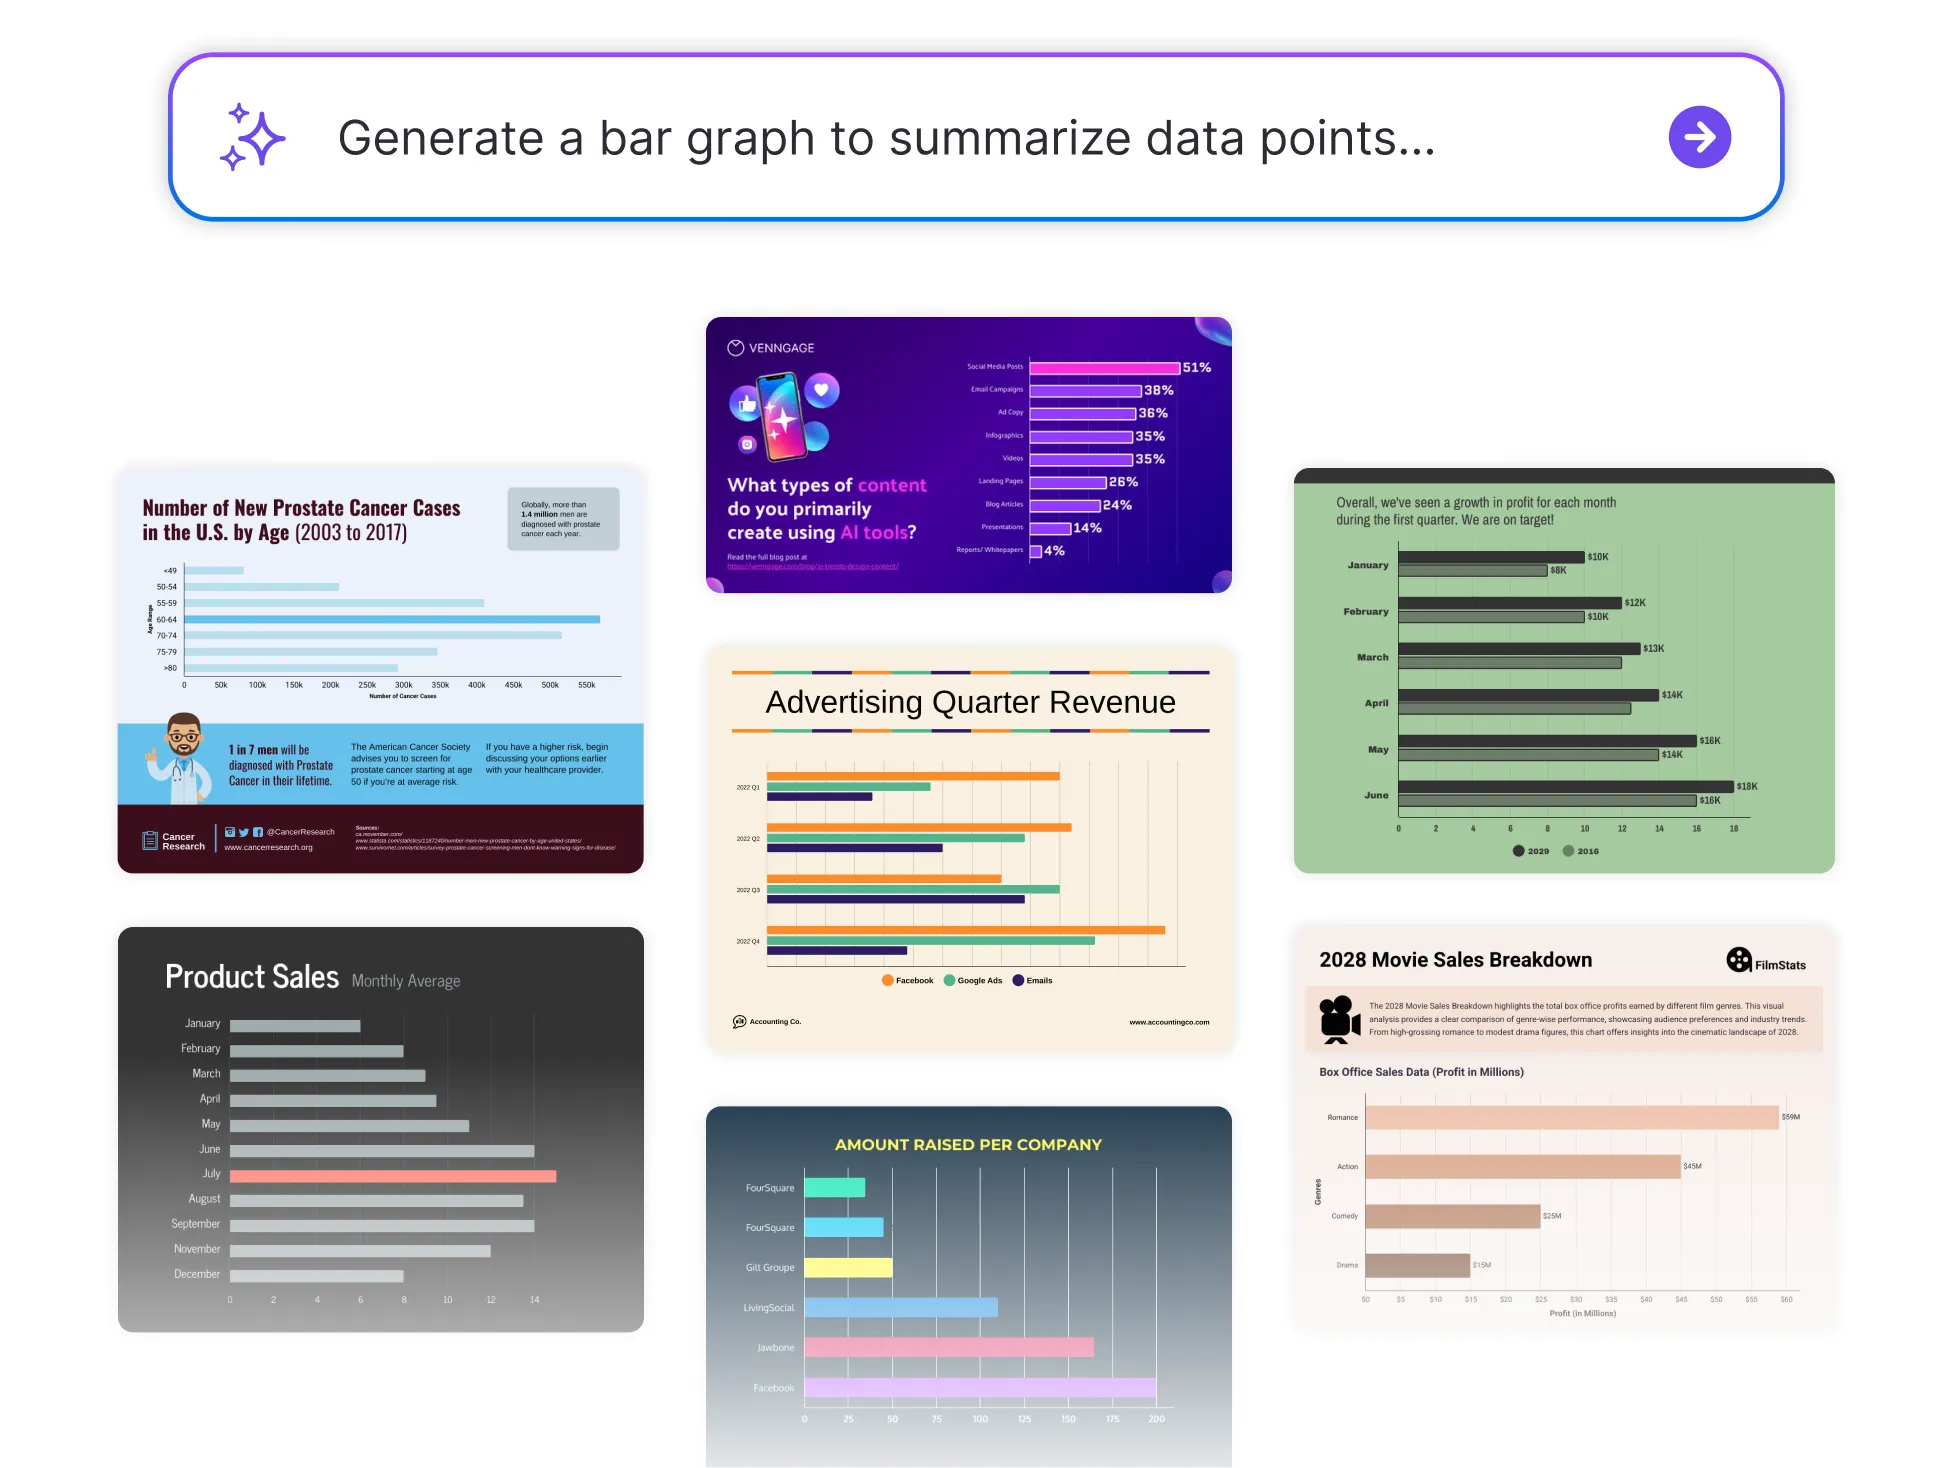
Free AI Bar Graph Generator
Create clear, compelling bar graphs in just a few clicks.
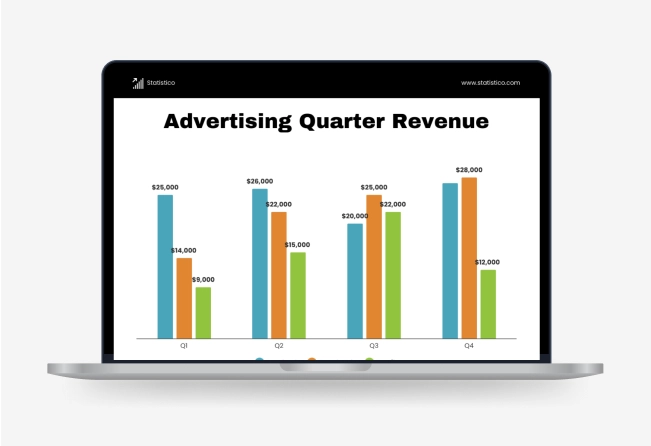
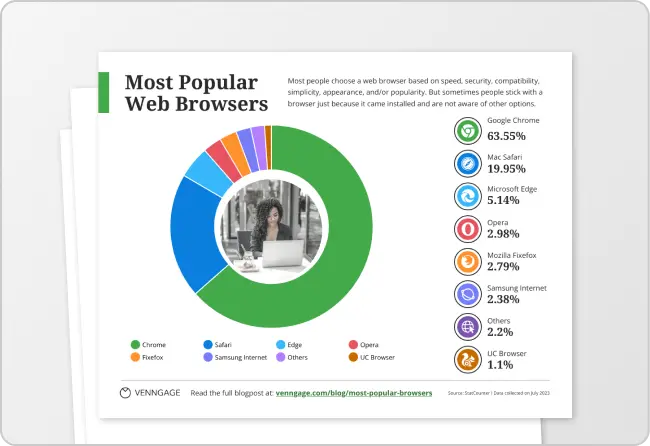
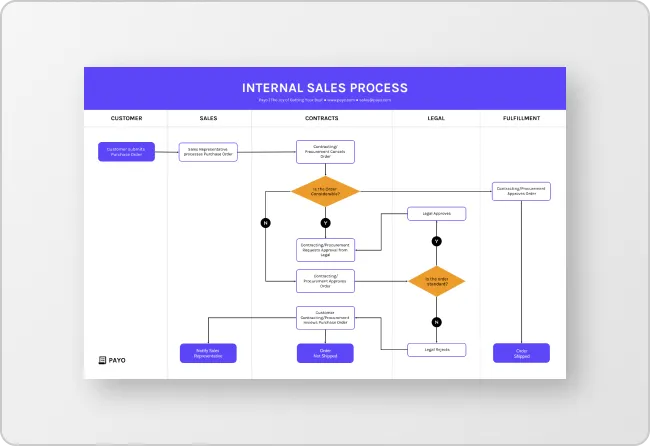
Browse Through More Bar Graph Templates
Popular AI Design Generators

How to Create a Bar Graph in Under 5 Minutes
Step 1: Enter Your Data or Paste Text
Start by entering your categories and values directly, paste raw data from a spreadsheet, or import a CSV file or Google Sheets link. You can also type a quick summary of what you want visualized and let AI handle the rest.
Step 2: Let AI Generate Your Bar Graph
Venngage’s AI generator instantly transforms your input into a clean, accurate bar graph—no design or formatting needed.
Step 3: Refine the Labels and Values
Quickly adjust axis titles, category names, or data points to match your message better.
Step 4: Customize the Look
Use the drag-and-drop editor to tweak colors, fonts, and styles. Apply your Brand Kit to keep it consistent with your reports or presentations.
Step 5: Download or Share Instantly
Export your bar graph as an image, PDF, or link—ready to drop into slides, dashboards, or emails.
For Professionals Turning Data Into Clear Reports
Sifting through spreadsheets is one thing, explaining them is another. Venngage’s Bar Graph Generator helps you instantly transform raw data into clean, professional visuals that are easy to present and easier to understand.
Perfect for sharing insights in reports, dashboards, or team meetings. Just input your data and let the generator do the rest.
Generate a Bar Graph
Marketers Looking to Visualize Insights
From email open rates to paid ad performance, marketing data tells a story—but only if it’s easy to follow. Venngage’s Bar Graph Generator helps you turn campaign metrics into clean, visual summaries that highlight what’s working.
Whether you're sharing results with clients, leadership, or your team, you’ll create graphs that make impact without extra design work.
Generate a Bar Graph
Educators Turning Data into Visual Learning
Need to make information stick? Venngage’s Bar Graph Generator helps you transform classroom data, quiz results, or lesson summaries into easy-to-read visuals, perfect for engaging students and simplifying complex topics.
Just type in your content, and create a bar graph your class will actually understand.
Generate a Bar Graph
Generate Bar Graphs In Seconds With Our AI Bar Graph Generator

Visualize Your Data in Seconds
Just enter your values or paste your text—Venngage’s AI transforms it into a clean, accurate bar graph without manual setup.

Built for Clarity and Impact
Bar graphs are automatically formatted for readability, so your audience gets the message quickly—whether you’re sharing results, trends, or comparisons.

Customize Every Detail
With Venngage’s drag-and-drop editor, you can easily tweak colors, fonts, and labels to match your content, goals, or audience.

Keep Everything On-Brand
Apply your logo, brand colors, and fonts in one click using the Brand Kit, perfect for team reports, client decks, and internal documents.

No Design Experience Needed
Whether you're an analyst, educator, or business owner, you don’t need design tools or templates—Venngage makes graph creation simple and stress-free.

Export and Share Instantly
Download your bar graph as an image, PDF, or link. Drop it into a report, presentation, or email wherever you need it to make your data stand out.
Fuel Your Creativity with AI-Powered Design Tools
Venngage is your one-stop shop for creating impactful presentations, infographics, reports, and more. It's a favorite among professionals, educators, and marketers for a reason:
AI Branding Automation
Instantly extract brand colors, fonts, and styles. Auto-apply your logo and visual identity to every design for seamless brand consistency.

DesignAI Generator
Turn simple prompts into stunning professional visuals in seconds. Describe what you need in plain language and watch our AI generate layouts optimized for maximum visual impact.

AI Content Auto-Fill
Kickstart your design process in seconds. Choose a template and let our AI auto-fill it with relevant, on-brand content, ideal for streamlining workflow and boosting productivity.

AI Generated Icons and Images
Create unique visuals that perfectly match your content and style. Generate custom illustrations, icons and images that align perfectly with your brand.

AI Writer and Translation
Enhance clarity, rewrite content, and instantly translate text to create accessible, global-ready visuals.

Smart Accessibility AI
Ensure every project looks great and works for everyone. Use AI to write alt text check contrast, layout, and font readability, and export fully WCAG-compliant visuals and PDFs.

FAQs
Absolutely. All AI-generated bar graphs on Venngage's platform are fully customizable, allowing you to personalize colors, designs, images and more to match your unique vision.
Yes, there are a variety of design generators available on Venngage. Along with the AI Bar Graph Generator, Venngage offers tools to create infographics, social media posts, reports, and more. These AI design tools are easy to use and customizable, helping you generate professional visuals quickly to match your style and needs.
Yes, the AI-generated bar graphs created using Venngage's tools are copyright-free. You can use them for both personal and commercial purposes without any restrictions on copyright. However, it's always good practice to ensure that any externally sourced content you include is also cleared for use.
We offer a free plan so you can try out all our AI features without spending anything. If you want more advanced features like private sharing and auto branding, we've got Premium and Business plans available too.
With Venngage's Bar Graph Generator, you can create vertical bar graphs, horizontal bar charts, stacked bar charts, and grouped bar graphs. Choose the chart type that best fits your data — stacked bar charts are great for showing parts of a whole, while grouped bar graphs let you compare data across different categories side by side.
Yes! You can add data to your bar graph by typing values directly, pasting text, or importing data from a CSV file or Google Sheets. Venngage supports multiple ways to input data, so you can create charts from any data source quickly and easily.
While there are many chart makers available, Venngage's AI Bar Graph Maker stands out by combining AI-powered generation with professional design tools, Brand Kit integration, and easy customization. You can create accurate bar graphs in seconds free and without any design experience needed. Export your charts as images, PDFs, or shareable links.