Free AI Diagram Generator
Translating data into meaningful insights can be challenging. While diagrams help visualize data effectively, designing them can be daunting. With our AI-powered generator, creating diagrams is incredibly easy. Simply provide a detailed prompt, and voila—your perfect diagram is ready!
Browse through more diagrams
AI-Powered Tools


How to write a prompt that generate the diagrams you want?
Be Specific and Clear: Specify the type of diagram (e.g., bar graph, pie chart) and include key details like axes labels, data points, and categories to ensure accuracy.
Include Detailed Instructions: Provide detailed instructions for design, such as colors, trend lines, time frames, or units, to ensure the AI tailors the sketch to your exact requirements.
State the Purpose and Context: Explain the diagram's goal and how it will be used so the AI can design it to effectively convey your message with maximum clarity. This is especially helpful for diagrams that need to align with your application.

Sample prompts you can modify and use
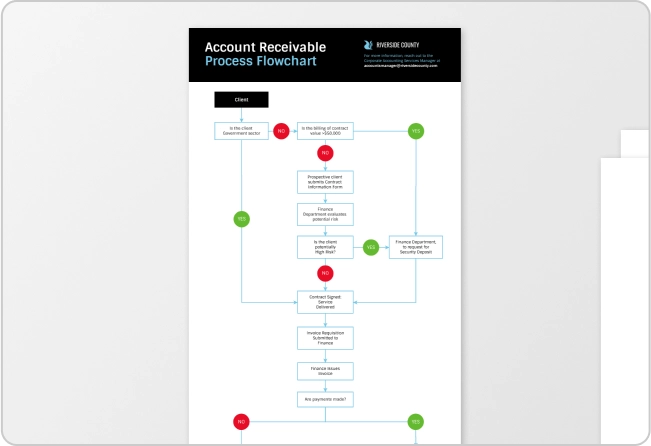
“Create a flowchart showing the steps of the customer onboarding process from registration to product use.”
“Generate a tree diagram outlining the company hierarchy, from the management down to individual team leads.”
“Build a Gantt chart that outlines the project timeline for launching a new product, including key milestones and deadlines.”
“Create a flowchart outlining the stages of a plant's growth cycle, from seed germination to full maturity.”
How to create a diagram using AI
Step 1: Define Your Diagram Objectives
Establish the purpose, target audience, and key information the diagram will convey. This step should clearly articulate the intended use, such as visualizing data, mapping processes, or comparing concepts.
Step 2: Specify Key Design Elements
Choose the appropriate shapes, structure, symbols, and layouts for the diagram. Decide on the orientation (vertical or horizontal) and select a color scheme that enhances readability and aligns with any branding requirements.
Step 3: Craft Your AI Prompt
Construct a detailed prompt for creating the diagram, including specific requests for data points, labels, and design elements like colors and shapes. Mention any annotations, legends, or specific formatting details that need to be included to ensure the algorithm interprets your requirements accurately.
Step 4: Review and Refine
Evaluate the initial draft of the diagram to ensure it meets the objectives and is easy to understand. Make adjustments to improve the logical flow, visual layout, and overall clarity.
Step 5: Finalize and Share
Confirm that all details are accurate and the design is polished. Prepare the diagram for presentation or distribution, ensuring it’s formatted correctly for the intended platform or network.
Create Diagrams That Elevate Your Reports and Captivate Your Audience
From internal updates to executive decks, Venngage’s AI Diagram Generator turns your insights into professional visuals in seconds.
Simply enter a prompt and let AI generate flowcharts, mind maps, org charts, and more, tailored to your content and brand.
Generate Diagrams
Work Smarter with AI-Powered Diagram Generation
Stop losing hours to manual design. Whether you're building reports, mapping out workflows, or simplifying complex ideas, Venngage’s AI Diagram Generator turns your input into clear, professional visuals fast.
Easily collaborate with your team, boost productivity, and deliver diagrams that don’t just look good but make your message stick.
Generate Diagrams
Unlock Fresh Ideas with AI-Generated Diagram Designs
Spark creativity and bring your content to life. Venngage’s AI Diagram Generator turns your data into compelling visuals that engage, inform, and impress. From mind maps to flowcharts, each diagram is thoughtfully crafted to help you see your message in a whole new way.
Tailored to your needs and ready in seconds, our AI helps you explore ideas, enhance reports, and deliver presentations that stand out for all the right reasons.
Generate Diagrams
Fuel Your Creativity with AI-Powered Design Tools
Venngage is your one-stop shop for creating impactful presentations, infographics, reports, and more. It's a favorite among professionals, educators, and marketers for a reason:
AI Branding Automation
Instantly extract brand colors, fonts, and styles. Auto-apply your logo and visual identity to every design for seamless brand consistency.

DesignAI Generator
Turn simple prompts into stunning professional visuals in seconds. Describe what you need in plain language and watch our AI generate layouts optimized for maximum visual impact.

AI Content Auto-Fill
Kickstart your design process in seconds. Choose a template and let our AI auto-fill it with relevant, on-brand content, ideal for streamlining workflow and boosting productivity.

AI Generated Icons and Images
Create unique visuals that perfectly match your content and style. Generate custom illustrations, icons and images that align perfectly with your brand.

AI Writer and Translation
Enhance clarity, rewrite content, and instantly translate text to create accessible, global-ready visuals.

Smart Accessibility AI
Ensure every project looks great and works for everyone. Use AI to write alt text check contrast, layout, and font readability, and export fully WCAG-compliant visuals and PDFs.

FAQs
Yes, you can fully customize all AI-generated templates on Venngage's platform.
Yes, Venngage offers a wide variety of diagram designs to suit different needs and preferences. Whether you're looking for something sleek and modern, or more detailed and data-focused, you'll find numerous options to choose from in our extensive template library.
Yes, the AI-generated diagrams created using Venngage's tools are copyright-free. You can use them for both personal and commercial purposes without any restrictions on copyright. However, it's always good practice to ensure that any externally sourced content you include is also cleared for use.
We offer a free plan so you can try out all our AI features without spending anything. If you want more advanced features like private sharing and auto branding, we've got Premium and Business plans available too.