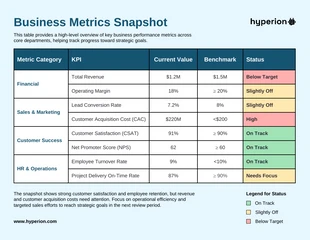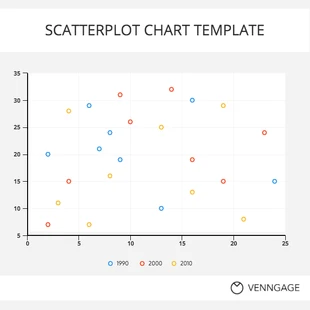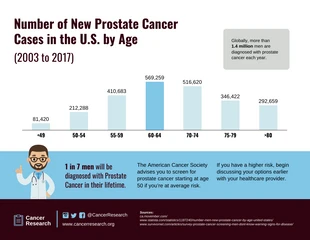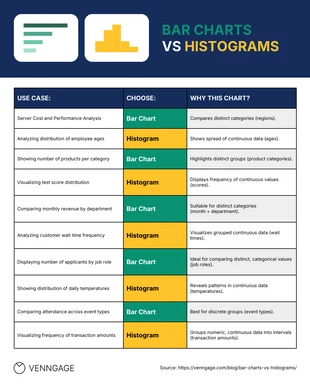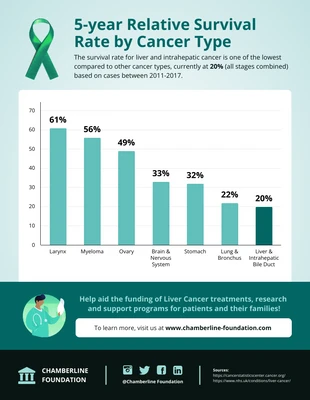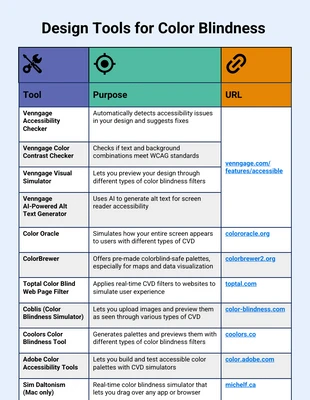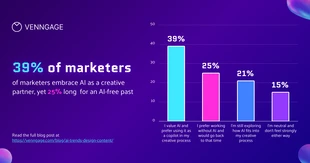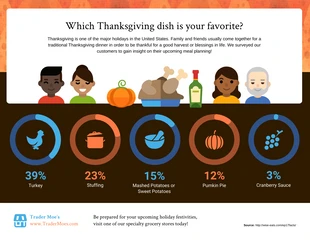
Survial Rate by Cancer Type Bar Chart Template
Customize this template to create an informative Liver Cancer Chart. Edit the text or modify the chart to make it easier for people to visualize data.
100% customizable templates
Millions of photos, icons, charts and graphics
AI-powered editing features
Effortlessly share, download, embed and publish
Easily generate QR codes for your designs
- Design stylemodern
- Colorslight
- SizeLetter (8.5 x 11 in)
- File typePNG, PDF, PowerPoint
- Planfree
Charts make it possible for people to visualize data. Aside from giving everyone a clear picture of how things really are, charts also make it easier for people to recall information. The reason being, remembering images is a lot easier than remembering a long block of text. Research is crucial when creating a chart because it’s important to ensure that people get the right information when they look at it. Case in point is this Liver Cancer Chart from Venngage. Since it’s informative and it presents numbers so clearly, people learn a lot just by looking at it. If you wish to create your own Liver Cancer Chart, the first thing you need to do is sign up for a free Venngage account. Just click the blue button at the top right corner of your screen and type in your email address, Gmail account, or Facebook profile on the space provided. Venngage pro tip: you are at liberty to replace the chart on this template. There are dozens of chart types in the design library, and all of them are fully

