
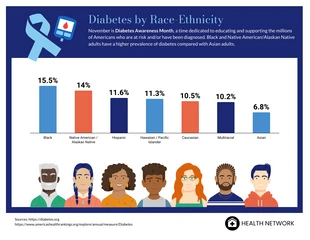
Diabetes by Race-Ethinicity Stats Template
Want to share your knowledge about diabetes? Then use this Diabetes Stats to create a chart detailing numbers about diabetes.

 100% customizable templates
 Millions of photos, icons, charts and graphics
 AI-powered editing features
 Effortlessly share, download, embed and publish
 Easily generate QR codes for your designs
- Design stylemodern
- Colorsvibrant
- SizeLetter (11 x 8.5 in)
- File typePNG, PDF, PowerPoint
- Planpremium
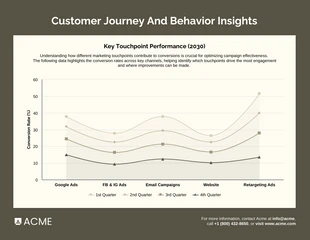
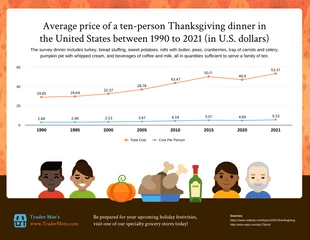
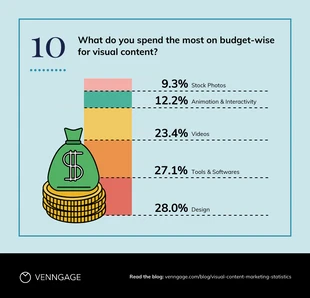
Sharing complex information can be a challenging thing, especially with the short attention span of people. It can be difficult to grab your reader's attention and make them want to learn more about a certain topic, but there are ways to do it effectively. The secret is to make the information easy to understand and less complicated. This is where using visual tools such as bar graphs come in handy. If you want to learn more about diabetes and its effects on the human body, as well as race-ethnicity breakdowns for diabetes statistics, then customize this Diabetes Stats template for your needs. Through Venngage’s online template editor, you can quickly design and share a diabetes chart with your readers to spread awareness about this important topic. The bar chart is a popular and effective way to present complex data in a format that is easy to understand. Instead of using long text paragraphs or complex numbers that are tedious to read, you can use visual bar charts to simplify the message that you want to share. Because they are designed to simplify complex
Related Chart Templates
stacked charts
pie charts
bar charts
bar charts
line charts
stacked charts
stacked charts
area charts