
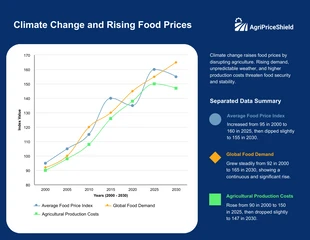
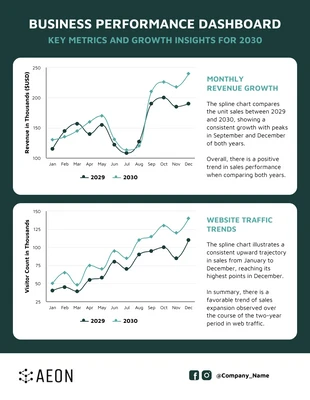
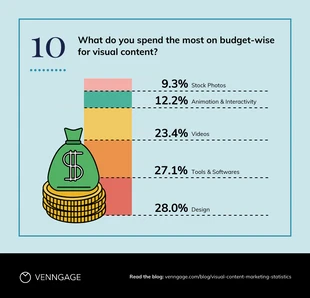
Visual Content Budget Stacked Bar Template
Show important data, comparisons, growth trends, and more with this customizableThermometer Graph Marketing Stats Template. Create an account today!

 100% customizable templates
 Millions of photos, icons, charts and graphics
 AI-powered editing features
 Effortlessly share, download, embed and publish
 Easily generate QR codes for your designs
- Design stylemodern, fun
- Colorslight
- SizeCustom (816 x 785 px)
- File typePNG, PDF, PowerPoint
- Planpremium
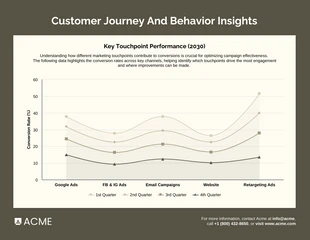
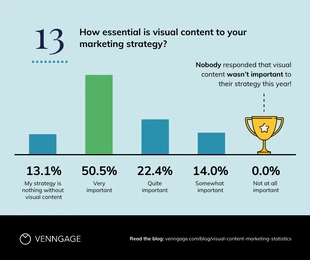
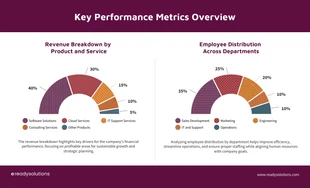
The Thermometer Graph Marketing Stats Template is a template that can be used by business owners and marketers to track the performance of their marketing campaigns. This template allows businesses to easily see how well their marketing campaigns are doing by comparing them to a benchmark or target goal. The template also shows how many people have been reached with each campaign and how much money has been spent on each campaign. The Thermometer Graph Marketing Stats Template is a great way to show the progress of your marketing efforts over time. This graph is commonly used in business, but it can also be useful for personal use. The template shows a set of data as a thermometer that changes color depending on how high or low the values are. The template comes with many different options, including custom colors and text. Our Thermometer Graph Marketing Stats Template is a great way to show your marketing stats in a fun, colorful way. This template is easy to edit and use. You can change the colors or text without any hassle. The layers
Related Chart Templates
stacked charts
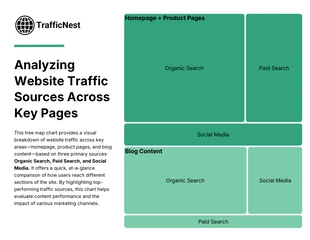
tree map charts
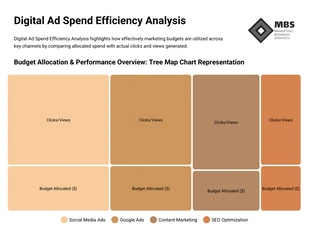
tree map charts

column charts
bar charts
stacked charts
pie charts
pyramid charts
area charts