
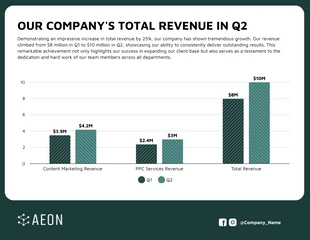
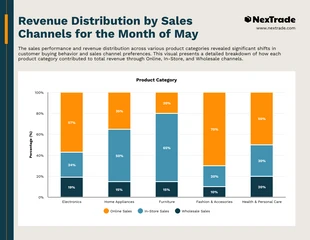
Digital Marketing Services Bar Chart Template
Visualize your data like never before by creating a Clustered Column Chart that makes trends and patterns easy to see and understand!

 100% customizable templates
 Millions of photos, icons, charts and graphics
 AI-powered editing features
 Effortlessly share, download, embed and publish
 Easily generate QR codes for your designs
- SizeLetter (11 x 8.5 in)
- File typePNG, PDF, PowerPoint
- Planpremium
A Clustered Column Chart is often used by analysts and researchers to visually represent data that is broken down into categories or groups. This chart type is particularly effective for comparing multiple variables within each category or group. Businesses, marketing teams, and financial institutions are some examples of organizations that may use Clustered Column Chart. These charts can easily analyze and present data related to sales figures, market research, customer demographics, or financial performance. Without a doubt, a Clustered Column Chart can provide valuable insights into patterns and trends within the data. These charts allow stakeholders to make informed decisions based on the information presented in the graph.
Related Chart Templates
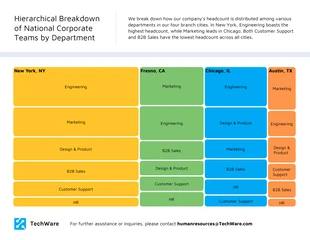
tree map charts

column charts
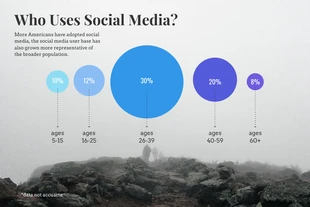
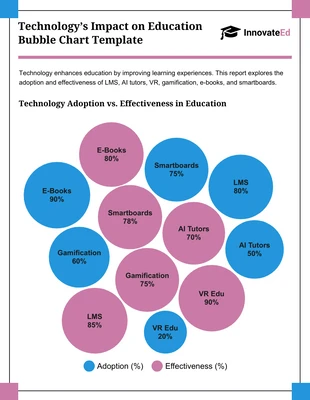
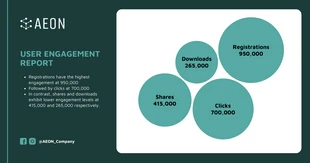
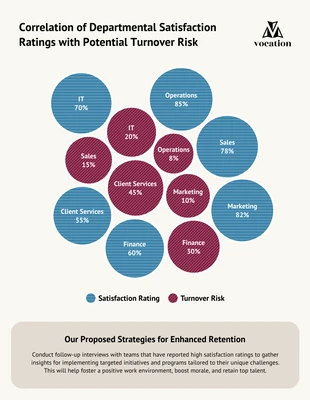
bubble charts

bubble charts
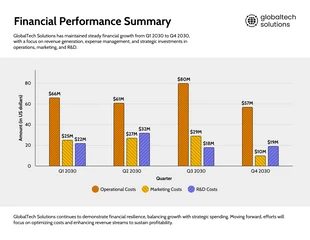
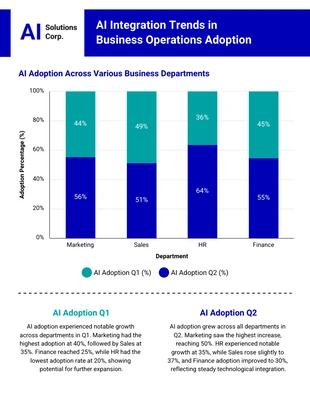
column charts
column charts
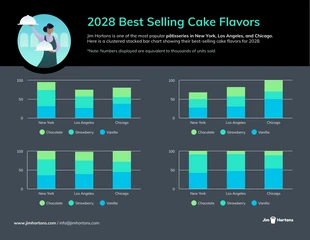
stacked charts
stacked charts
bubble charts