


Everyone loves a good story. They entertain, educate, and inspire by tapping into our emotions and imagination. But what happens when you combine a good story with data and visuals?
You get data storytelling — the process of telling a story with data to communicate insights and drive decision-making.
Data storytelling enables business leaders who don’t have time to find insights in complex data to make better business decisions. And with data widely available today, data storytelling is a necessary marketing skill.
And the secret to good data storytelling is good data visualization, using tools like infographics to transform complex data into engaging and easily understandable visuals that tell a story.
Here are some stats worth considering:
- The most common data storytelling challenges companies face are lack of skills (49%), non-data literacy (48%), and limited time for developing data stories (47%)
- Data-driven storytelling can increase sales by 30% and boost the engagement rate to 300%.
Ready to learn how your organization can leverage the power of data storytelling to drive better decision-making, improve operational efficiency, and unlock new growth opportunities?
Stick around till the end of this post. But if you want to start creating beautiful data stories right away, head over to our Infographic Maker or infographic templates to start creating right away – no design skills are required!
Click to jump ahead:
- Why data storytelling matters for businesses
- Key elements of effective data storytelling
- Venngage: Your data storytelling partner
- Best practices for business infographics
Why data storytelling matters for businesses (especially for non-technical audiences)
Data storytelling matters for businesses because it bridges the gap between data and insights. .
This is especially important for non-technical audiences with decision-making power who will respond better to information that is digestible, relatable, memorable, and persuasive. This is a better way to drive buy-in and action.
It’d be fair to say, ignoring data storytelling means leaving money at the table.
Just a heads up, adding data in Excel and creating a graph is NOT data storytelling. Definitely, don’t expect non-technical audiences to be enthusiastic with charts like these in your presentations or reports.

You have to dig a little deeper and find the story within the data. And once you do, you have to find a way to present it in a visually appealing format.
Remember these three principles of good data storytelling:
- Data
- Visuals
- Narrative

Bridge the communication gap
Data storytelling helps bridge the communication gap because it taps into the power of visual communication to provide meaning and relevance to data that might be otherwise hard to grasp.
To be more precise, data storytelling helps bridge the communication gap in the following ways:
- Create connections: Data visualization presents data in a format that is engaging for audiences with diverse backgrounds.
- Uncover hidden patterns: Reveal trends and relationships within data that might be overlooked in raw numerical form.
And visual communication is something most companies today cannot ignore.
“I make sure to intersperse long text with stock photos to break the scroll at worst, infographics at best. Of course, the latter requires more time and when I want to respond to a timely topic, I won’t spend time creating long visual content, but a short video reaction can be just as valuable, and sometimes the natural, barely edited style goes down better. We’re over the hyper-polished content; raw content is trending!”
Nadine Heir from Write Wiser on how they use visual communication in their work.
Drive actionable insights for decision makers
By transforming data into easy-to-understand visuals (infographics, charts, graphs), investing in data storytelling can deliver a better ROI because you make the lives of people tasked to make decisions every day easier.
This is because data storytelling presents information in a way that allows anyone to see trends, patterns, and insight that may otherwise be missed or overlooked. Not everyone is an Excel guru or knows how to use complicated software to derive insights.
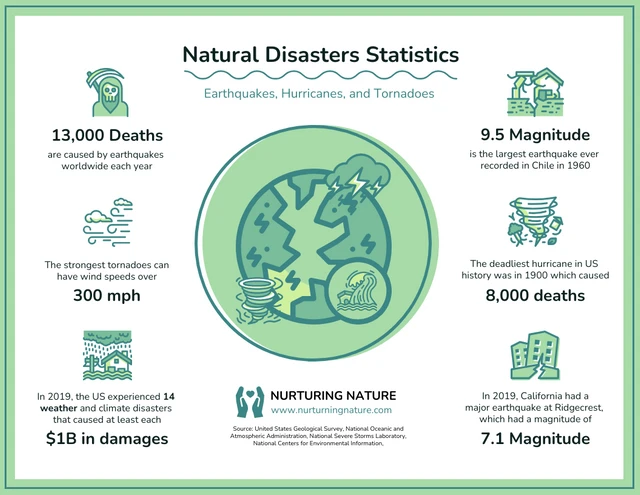
For example, ask any C-level executive if they’d rather see an infographic like this that breaks down issues within the travel industry or raw numbers and boring charts. You wouldn’t get many takers for the latter.

Given how important data storytelling is decision-making at an organizational level, we spoke to the brand director of ELEHEAR to learn how the company uses visuals to aid decision-making.
“As brand director at ELEHEAR, a tech startup focusing on innovative hearing aid technologies, I have consistently leveraged visual tools to simplify complex processes and improve intra-organizational communication.
When it comes to our Marketing campaigns, we implement a combination of charts and diagrams to convey the scale, reach, and performance of our initiatives across various channels. Here, visuals help us interpret massive volumes of data in a way that’s cogent and meaningful. In contrast, for our ITSM processes, we’ve found that visual interfaces in automation tools can sometimes over-simplify and hide important undercurrents. We’ve observed that a well-constructed graph or chart can spotlight patterns and trends that are otherwise easy to overlook.”
Elyn-Aisin Lim, the brand director of ELEHEAR
Build trust and transparency
Clear and concise data visualization is essential for fostering trust and transparency within organizations.
When data is presented in a visually compelling and understandable way, it builds credibility and confidence among stakeholders.
As the saying goes, “trust is earned, not given” and transparent data communication is a cornerstone of this process.
But don’t take it from us.
“As an attorney and a CPA with over 30 years of experience in the financial sphere, I find visuals, such as graphs, charts, and infographics, essential in streamlining complex processes. In my practice at Wyoming Trust & LLC Attorney, these tools have proven more favorable than some automation tools, mostly due to the detail, clarity, and enhanced understanding they offer.
We use visual tools in multiple areas within our processes. Firstly, for our estate planning process, we utilize flowcharts to explain the legal structures to our clients. This helps to simplify the intricate processes of wealth strategy planning and asset protection. Secondly, during our legal services delivery, we integrate diagrams to illustrate litigation procedures, which significantly eases complex federal court, bankruptcy, and securities cases. Lastly, within our internal financial reporting, graphs, and charts come in handy to analyze and display financial trends and potential areas of improvement.
In summation, visuals handle the task of effective communication impeccably – they decode complexities, personalize the data, and enable faster comprehension. I believe visual tools can indeed boost the efficiency and transparency of various business processes.”
Mark Pierce, Founder & CEO of Wyoming Trust & LLC Attorney
Key elements of effective data storytelling (simplified for non-technical audiences)
Selecting the right data is the bread and butter of effective storytelling.
Inundating audiences with unnecessary details will always dilute the core message and make it difficult for non-technical audiences to grasp the main message.
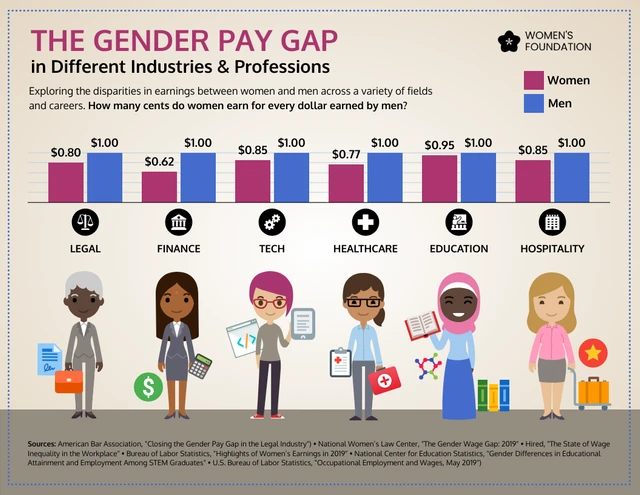
For example, this infographic effectively communicates the gender pay gap to a non-technical audience without overwhelming them. It’s easy to see differences across industries with a simple glance.
Data selection and analysis (focus on impact)
Trying to create a story with data is challenging with the amount of information available today. How do you decide which datasets are relevant to the story you want to tell?
Start by identifying who your audience is, what they most care about, what their goals are, what they currently know, what decisions need to be made and what additional knowledge might help them make the decisions that will help them achieve their goals.
Some ways you can figure out what your target audience cares about include:
- Run surveys: Create targeted surveys to gather information about your audience’s knowledge, preferences, and needs.
- Conduct interviews: Conduct in-depth interviews with key stakeholders to understand their perspectives and challenges.
Once you know what your audience cares about, it’s time to look for data that answers those questions. For example, if you want to inform audiences about the effectiveness of a marketing campaign, you’ll want to look for data around click-through rates and conversion rates, not data on product development.
Also, it’s good practice to source data from reputable sources. Public data from government entities, academic research, and established leaders in analysis are all good places to look because not only is the data easily accessible but transparent and verifiable.
Here’s a checklist you can follow to identify the right data:
- Define your objective: Outline the reason you want to tell a story. What do you want your audience to learn or understand?
- Identify key metrics: Determine which metrics relate to your objective.
- Filter out irrelevant data: Review every data point you consider and check if it relates to your objective. If a data point doesn’t help you achieve your objective, it’s irrelevant.
- Look for trends and patterns: Focus on data that shows clear trends or patterns. These will be easier for your audience to understand and relate to.
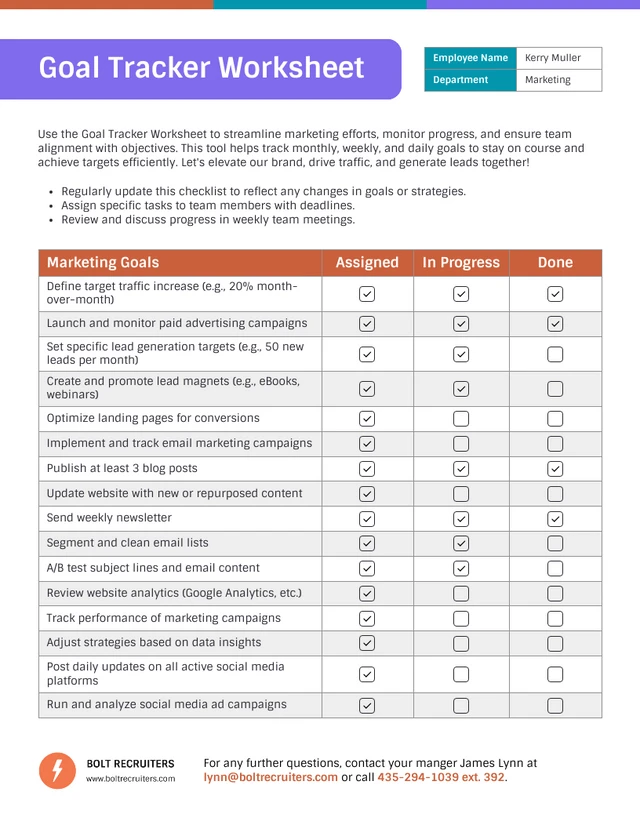
If that sounds like a lot of steps to remember, here’s a secret tip. Use a tracking checklist template to stay on course throughout the data selection and analysis process:
Setting the narrative (make the structure relatable)
Once you have data to work with, it’s time to create a compelling story around it.
Most of us are already used to a traditional story arc, with a beginning, middle, and end. So when you want to tell a data story, don’t just jump straight into the numbers.
Introduce the topic first, then get into the data, and end with a call-to-action. Otherwise, you’ll end up presenting a basic report or presentation.
One way to ensure you actually tell a story with data is to use a problem-solution framework that focuses on business challenges non-technical audiences can relate to.
Here’s why a problem-solution narrative is effective in data storytelling:
- Relatable: It starts with identifying a common problem (something non-technical audiences are well-versed with).
- Reduces cognitive load: Audiences know what to expect (a solution backed by data).
- Focuses on impact: By emphasizing the problem, this framework highlights the importance of the solution.
For example, consider a common scenario such as a company wanting to improve customer satisfaction.
Using the problem-solution framework, the company might present the following narrative.
- Identify the problem: declining customer satisfaction scores.
- Show the extent of the problem You can then present data highlighting the extent of the issue, such as specific metrics showing a drop in customer satisfaction over the past year.
- Introduce solution Next, introduce the solution by showcasing the steps taken to address the problem, such as implementing a new customer service training program or introducing a customer feedback system.
Visual appeal (Prioritize simplicity)
In data storytelling, visuals make or break your ability to communicate insights and engage a non-technical audience.
For this reason, your visual creations need to be:
- Appropriate for the data
- Well-labeled
- Not misleading
It doesn’t matter whether you’re creating infographics, flowcharts, presentations, mind maps, or anything else. The key is to follow design principles like use of color and visual hierarchy to draw attention and make information can be consumed by skimming.
Just look at this infographic comparing the Olympic Games coming to Paris after a century. It’s able to communicate indirectly how the Games have grown without saying it explicitly.

Related: How to Use Visual Communication: Definition, Examples, Templates
To ensure your infographic is clear, concise, and impactful, focus on these design principles:
- Simplicity: Prioritize essential information and avoid clutter.
- Visual hierarchy: Guide the viewer’s eye by using size, color, and placement to emphasize key points.
- Consistency: Maintain a consistent style throughout the infographic, from fonts and colors to layout and visual elements.
- White space: Allow ample white space to improve readability and prevent overcrowding.
- Color psychology: Use colors strategically to evoke emotions and enhance understanding.
- Typography: Select legible fonts and use appropriate font sizes for headings and body text.
Venngage: Your data storytelling partner for non-technical professionals
Do you want to level up visual communication and data storytelling within your organization, but not sure how to do it?
Trust Venngage – a simple and powerful design solution for business communications and data storytelling. Venngage helps businesses transform boring raw data into visual masterpieces and you don’t need design skills to use the tool.
Here are some reasons to choose Venngage as your data storytelling partner!
Intuitive templates designed for busy executives


Easy customization (no technical skills required)
No matter the template you choose on Venngage, it’s easy to customize it to suit your needs without any coding or design expertise.
Here are all the cool things you can do in Venngage:
- Replace images in templates with your own by either uploading or browsing our in-editor library of diverse images, icons, and graphics.
- Change the text, icons, or graphics within the template.
- Add your brand colors to vision boards with a single click using My Brand Kit (available only for Business users).
- Download and print vision boards created in Venngage (Business users only).
For a more in-depth overview of how to make infographics in Venngage, also give this video a watch.
Collaboration features for teams (streamlined communication)
Venngage offers two powerful collaborative tools: Team and Groups. With Team or Groups, users can:
- Share designs with Members in your organization,
- Collaborate on designs in real time,
- Organize and manage user access to shared designs,
- Give and receive feedback on shared designs, and
- Invite guests to view shared designs.
With your Venngage Business account, you can easily invite and manage your team members to collaborate on a design, all in real time.
Best practices for business infographics (tailored for C-Suite communication)
Choosing the right chart type (simplified guide)
The best infographics mix and match data, text and visuals to tell a story.
But it’s not as easy as dumping numbers and text together expecting your audience to gain insights. You have to think about how to present data (pro-tip: We at Venngage have developed a framework for it!)
Before I share that method, it’s good to know types of charts commonly used on infographics:
- Bar charts
- Line charts
- Pie charts
- Bubble charts
- Stacked bar charts
- Area charts
- Scatterplots
- Multi-series charts
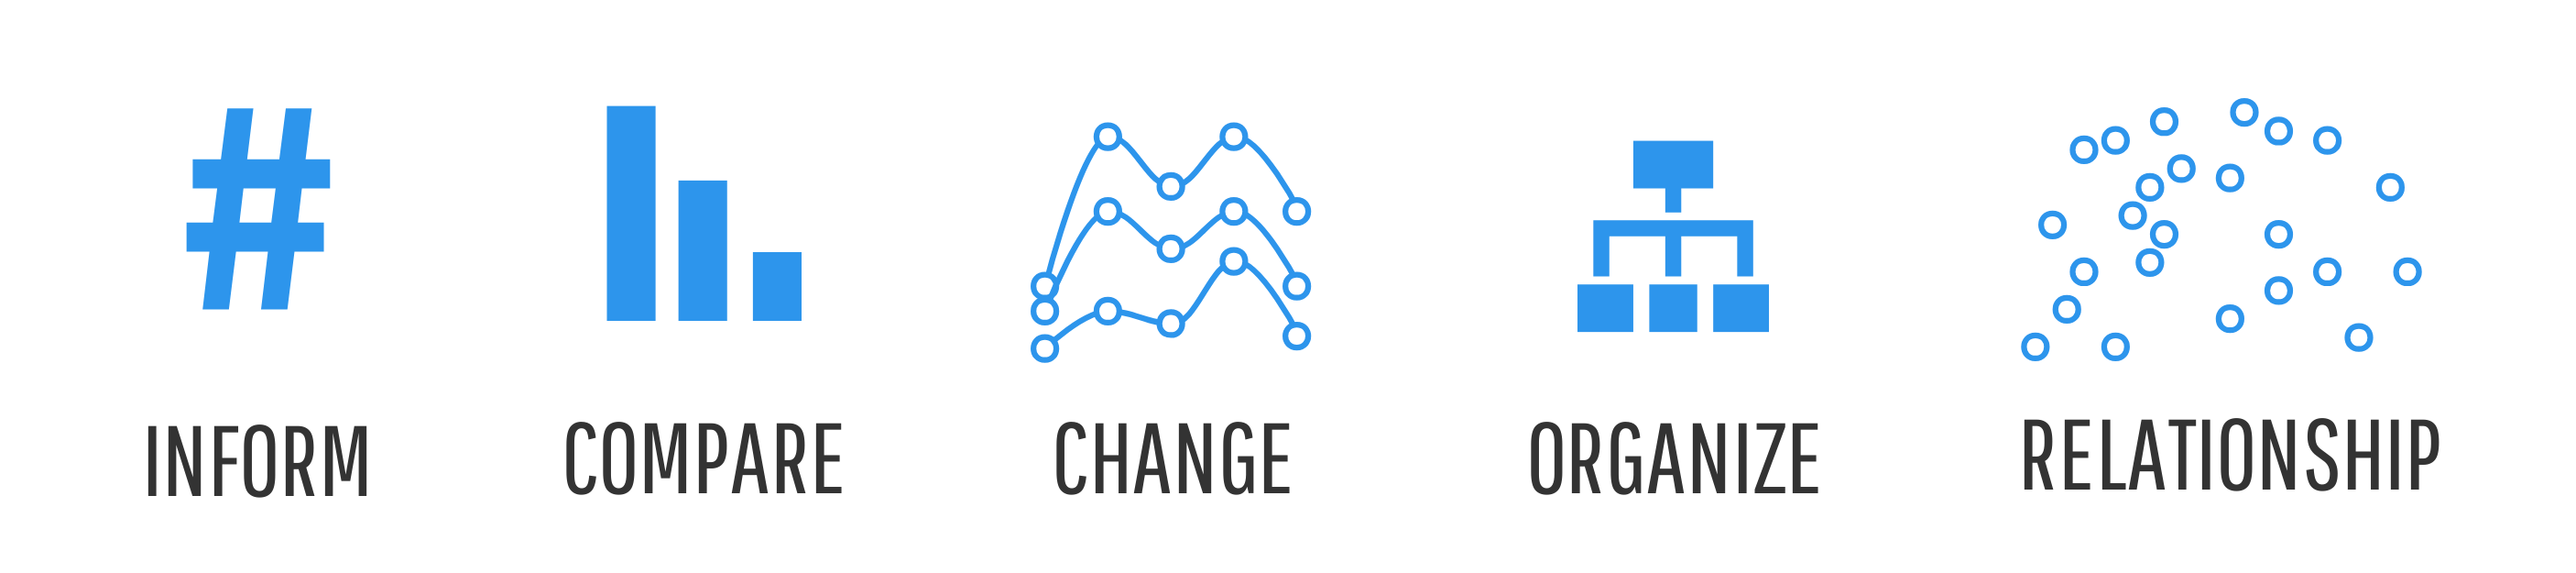
Coming back to how to choose the right chart type for data storytelling, use the ICCOR method.
ICCOR stands for inform, compare, change, organize, and relationships. It’s a structured approach that’ll help you tell impact narratives with data.
Best chart types to inform
When wanting to inform your audience, you’re spoiled for choice. For example, icon chart infographics are a great way to present statistics and key figures.

Another common option is to use bar charts because they provide a clear and straightforward way to compare different sets of data.

Best chart types for comparing
If you want to show similarities or differences within a dataset, there’s no shortage of chart options such as bar and column charts.
But there are other unique options out there, like the bubble chart that can help you compare independent values with clear outliers.

Best chart types for showing change
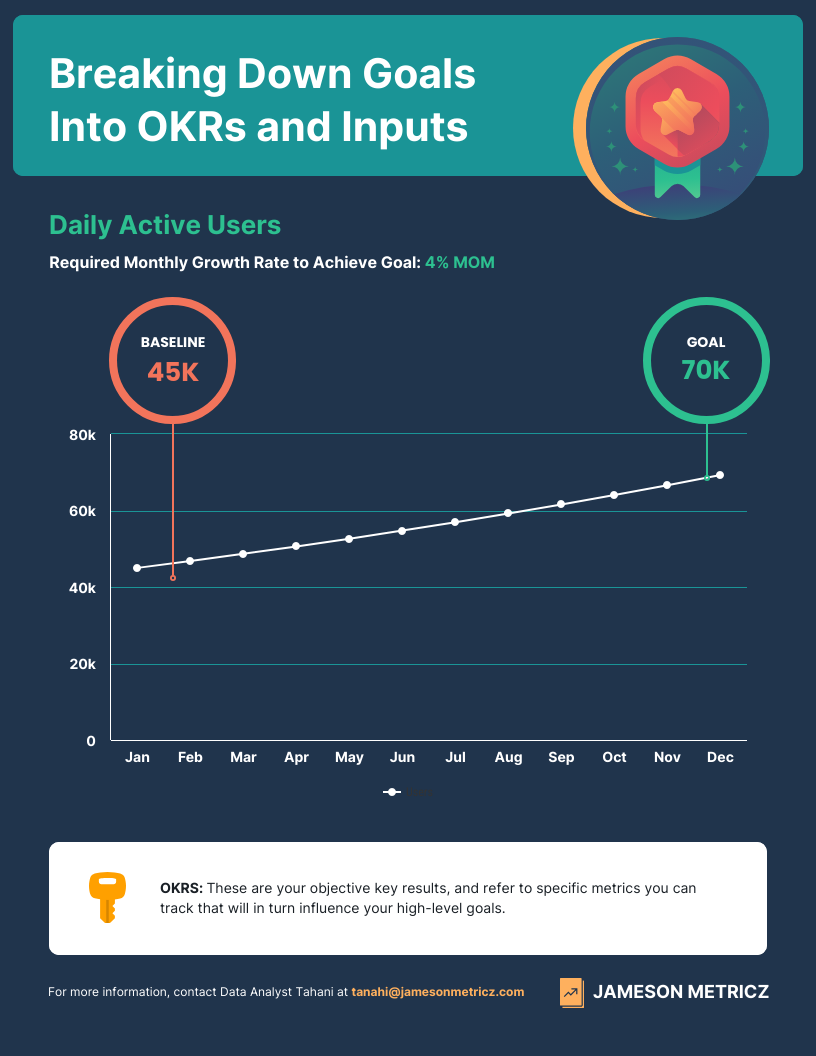
When needing to show trends over time or space, timeline infographics are an option because they present information sequentially, making it easy for the audience to follow and understand how things have evolved.

Another option is to use line charts to show time-based data. It’s easy to include a ton of data points on line charts and everyone knows how to read them.
Best chart types for organization
Charts which allow you to organize data on an infographic can vary based on what you want to show.
For example, list infographics effectively present ordered information or a sequence of steps, making them ideal for displaying how-to guides, checklists, or ranked data.

Best chart types to show relationships
Showing relationships within a dataset (correlation and distribution) is common.
In such scenarios, scatter plots give you an easy way to say A LOT (distribution, clustering, and outliers of a dataset) without saying much.

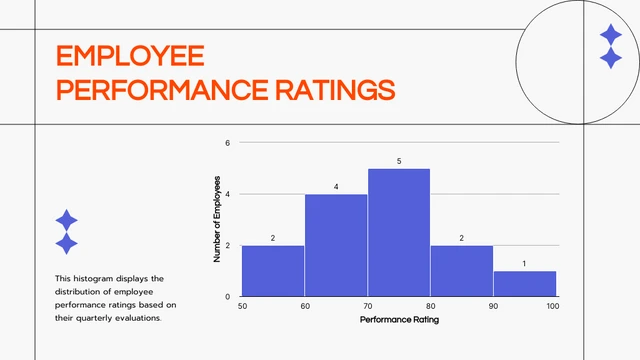
Another option is to use histograms to show any kind of distribution or relationship.
Keep it concise and impactful (executive summary approach)
Effective data storytelling is about distilling complex information into clear, concise, and impactful insights.
How can you be clear and concise when dealing with data?
Adopt the “executive summary approach”. This is no different from the single page overview you see in business reports and presentations to convey insights, allowing busy executives to avoid having to delve into the entire content.
Here’s a playbook you can follow to keep your visuals concise and impactful.
Guidelines on how to use the executive summary approach to succeed when creating business infographics:
- Lead with the main insights
- Start with the most important findings or conclusions.
- Summarize the key insights that you want your audience to take away.
- Highlight the significance
- Explain why these insights are important and/or why an audience should care.
- Use visual aids
- Incorporate charts, graphs, and other visuals to support key insights.
- Ensure visuals are clear, relevant, and directly tied to the main points.
- Structure your narrative
- Organize the information logically, with a clear beginning, middle, and end.
- Start with the challenge or opportunity, followed by the analysis, and conclude with the results and recommendations.
Telling a compelling story with data (the so what? test)
Last but not least, before you go public with your visual creation, do one final test.
Remember, most C-level executives are pressed for time and need to understand not just the data, but also the “so what?” — the significance of the insights and their potential impact on business decisions and outcomes.
If your visual even hints at someone going “so what”, it’s not up to standard.
To prevent this from happening, follow these guidelines:
Connect your insights to business objectives
- Align your data insights with the overarching goals and objectives of the business.
- Demonstrate how the insights support or challenge these objectives.
Highlight the impact on key metrics
- Identify which key performance indicators (KPIs) are affected by the insights.
- Quantify the impact where possible to provide concrete evidence.
Outline strategic recommendations
- Based on insights, propose actionable recommendations.
- Ensure the recommendations are practical and directly tied to the data.
Anticipate potential challenges
- Identify any potential challenges or risks associated with the insights.
- Provide strategies to mitigate these risks.
Use clear and persuasive language
- Avoid technical jargon and present the insights in clear, simple language.
- Make your case compelling by focusing on the benefits and value to the business.
Summarize the bottom line
- Conclude with a succinct summary of the main insights and their business implications.
Conclusion: Don’t fall behind the curve and upgrade your data storytelling and visual communication game today
Incorporating data storytelling into your business practices ensures that insights are not lost in noise but are instead used to foster trust, transparency, and informed decision-making.
But if you think you need to be a designer or tech whiz to get data storytelling right, that couldn’t be further from the truth. With tools like Venngage, even those without design skills can create visually compelling and impactful data stories that resonate with both technical and non-technical audiences alike.


