
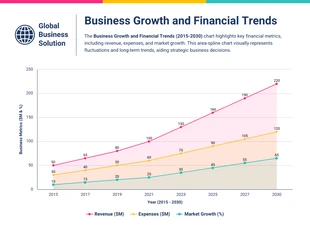
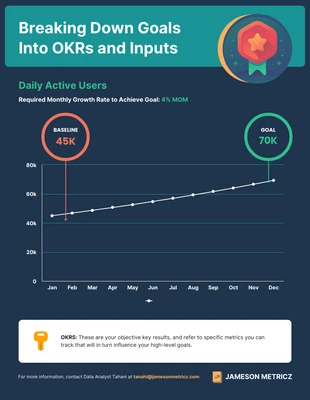
Goals and OKR Breakdown Line Graph Template
Understand complex information or systems and predict trends by analyzing patterns with this easy-to-edit graph template.

 100% customizable templates
 Millions of photos, icons, charts and graphics
 AI-powered editing features
 Effortlessly share, download, embed and publish
 Easily generate QR codes for your designs
- Design stylemodern
- Colorsdark
- SizeLetter (8.5 x 11 in)
- File typePNG, PDF, PowerPoint
- Planbusiness
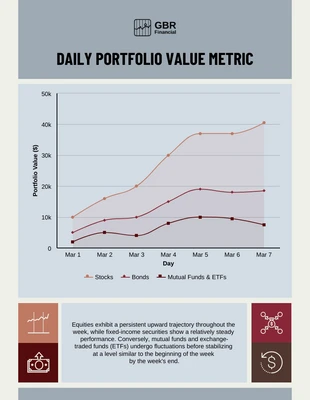
A graph is a mathematical structure used to model relationships between data points. Graphs are composed of vertices (also called nodes) and edges, and the edges in a graph can be directed or undirected. Directed edges have a path associated with them, while undirected edges do not. Graphs are often used to model networks, such as social networks or transportation networks. Graphs are important in many fields, including computer science, engineering, and physics. They can be used to model problems and solve them. In computer science, graphs represent data structures such as queues and trees. In engineering, they can be used to model electrical circuits. In physics, they can model the movement of particles. There are many different ways to create a graph. One way is to use a graph drawing program; another way is to use a graphing calculator. There are also online tools that you can use to create graphs. Once you have chosen a method for creating your graph, you need to decide what kind of data you want to represent. This data can be numeric, categorical, or ordinal. Numeric
Related Chart Templates
line charts
stacked charts
stacked charts
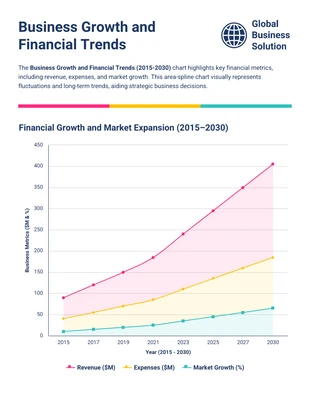
area charts
stacked charts
stacked charts

pie charts

stacked charts