


Looking to understand what a flowchart is and how to make one? This guide explains everything you need, from clear definitions and real examples to editable templates and trusted tools.
You’ll also learn how to create professional flowcharts step by step using Venngage’s drag-and-drop Flowchart Maker and customizable flowchart templates designed to help you visualize processes, improve clarity and communicate ideas effectively.
What is a flowchart?
A flowchart, also known as a flow diagram, is a step-by-step graphical representation of a process, system or algorithm needed to perform a task or complete a workflow.
Here’s a good example:

Flow charts are perfect to use in project plan templates, business reports, presentations and white papers. Anywhere you need to simplify and communicate a process, a flow chart template is the best way to do it.
These types of diagrams communicate a sequence of actions and decisions that lead to a specific outcome, using symbols and directional cues to convey information.
Here’s another example, with more steps in the process:

Flowcharts are great for providing guidance and clarifying the logic behind if/then scenarios. But that’s just the tip of the iceberg.
From software development, engineering and sales, to business process mapping, manufacturing and recruiting, there is literally no shortage of use cases for these nifty visualizations. The best part? These charts can range from the most basic designs, like this one:

Or, it can be a comprehensive, multi-step diagrams that represent a wide range of conditions and variables. Like this one:

In other words, these handy tools have got range.
What’s the purpose of a flowchart?
Flowcharts are typically used to help people understand, communicate or improve upon a process or system. They’re ideal for documenting the steps in a process so they can be repeated accurately.
Other uses for flowcharts include….
- Visualizing and analyzing a process
- Optimizing business processes or workflows for efficiency and quality
- Communicating a process for training or understanding
- Identifying bottlenecks, unnecessary steps and waste in business processes
The bottom line? With a detailed process flowchart, even the most complicated series of steps becomes easy understand.

Benefits and use cases of flowcharts
Flowcharts are more than just visuals, they’re practical tools that help teams simplify complex information, improve decision-making, and communicate ideas clearly.
Here’s why and when you should use them:
- Clarify complex processes:Turn detailed workflows into clear, step-by-step visuals that anyone can follow. Learn more in our guide on workflow charts.
- Enhance team communication: Keep everyone on the same page with a shared visual reference of the process.
- Identify inefficiencies: Quickly spot bottlenecks, redundancies, or areas that need optimization.
- Support better decisions: Map out choices and outcomes to make confident, data-informed decisions. Check out this sales process flowchart guide for practical examples.
- Simplify training and onboarding: Give new team members a visual guide to understand systems faster.
- Standardize documentation: Maintain consistency across business operations, projects, and reports.
If you’re struggling to find the perfect template for a unique business case, you can use Venngage AI and machine learning for flowcharts to build one from scratch. Much like the smart drafting in Monday [.] com, our ai automated flowchart software takes your specific process description and generates a customized diagram template that fits your workflow perfectly without any manual dragging and dropping.
Common flowchart symbols
One of the reasons flowcharts are easily understood is because they typically use universal, standardized symbols in their designs. Here’s an example:

Let’s take a look at some of the common flowchart symbols used in a process flow diagram:
Start/end symbol
Commonly depicted as an elongated circle (or ellipses), these terminal points signify the beginning or endpoints of a process outlined by a flowchart.
Process symbol

These symbols represent a step taken in the sequence of operations or decisions. They are usually represented as a rectangle.
Decision symbol
Typically in the shape of a diamond (rhombus), these symbols demonstrate a point where a conditional statement is made, before the flowchart branches off into two or more paths.
Input/output symbol

These symbols, usually parallelograms, indicate data inputs and outputs as it enters or is sent out of a process.
Connector or flowline symbol

These symbols represent a connection between two process symbols, input/output symbols or decision symbols. Usually represented as a line with an arrow, they guide the viewer through the sequence (or steps).
On-page connector symbol

The on-page connector symbol takes the form of a circle. It connects two or more parts of a flowchart when it continues on a different section of the page
Off-page connector symbol

These symbols connect two or more parts of a flowchart when it continues onto another page or section.
24 Flow chart templates
Business flow chart template
Using a flow chart in your business is a great way to help communicate internal processes or hiring and project workflows. They are handy for a wide variety of business processes, including budgeting, planning, communicating, or sales.
For example, the process flow chart template below visualizes the online sales procedure of a business.

Related: Flowchart Symbols and Meaning
Design tip: Keep your audience engaged with a creative flow chart layout
Notice the arrows in the above template? They put the ‘flow’ in flow charts.
Play around with different arrow shapes and sizes will bring out a much more interesting flow chart. You can also use other graphic design elements, like zig zags, curves or flowy lines that weave through your flowchart’s sections.

In the medical flow chart above, readers are guided through systems and given instructions based on the outcome. A medical flow chart like this is great for any health business, as users can easily access the right services quicker.
If you have less text but more steps, you can use a process map template like the one below:

Budgeting or projecting flow chart template
Another great way to use a flow chart is to break down part of a whole, like breaking up factors that contribute to a complete business spend — or breaking down projected budget and future earnings.
The flow chart template below visualizes the return on investment between workflow stages like Design New Product, Enhance existing product or Do nothing:

Medical flow chart template
You can create a medical flow chart using a simple concept flow chart, like this one:

You can also use a process map template to help medical teams understand how to assess a potential threat and make sound decisions.
During times of stress, such as when an emergency occurs, it can be difficult for people to think clearly. Having a visual guide to help them during this time will aid in better decision-making and keep people safe. That’s where a free flow chart template like the one below comes in handy.

You can also add a flowchart into an infographic to make sure your visualized process flow is even more engaging and easier to understand. Here’s an example:

Change management process map template
Any type of change in a company can be overwhelming. To make it easier for employees, managers, and external parties, a change management process map template like the below outlines the process.

Interested in learning more about change management models? Check out our blog about Change Management Models and How To Apply Them
Organizational structure flow chart template
A corporate organizational chart is another classic use of a flow chart. Organization charts are handy to include in employee handbooks or onboarding materials to ensure that new hires understand the company structure.
An organizational structure flow chart breaks down a whole into parts i.e. a company into different departments/teams to show hierarchy and team relationships.

Pro Tip: Venngage makes it simple to share your flow chart with the people that matter. Once you’re done editing a template, just copy the link or email it to your boss or colleague. Upgrade to a Premium or Business account to download your flow chart or activate team features.
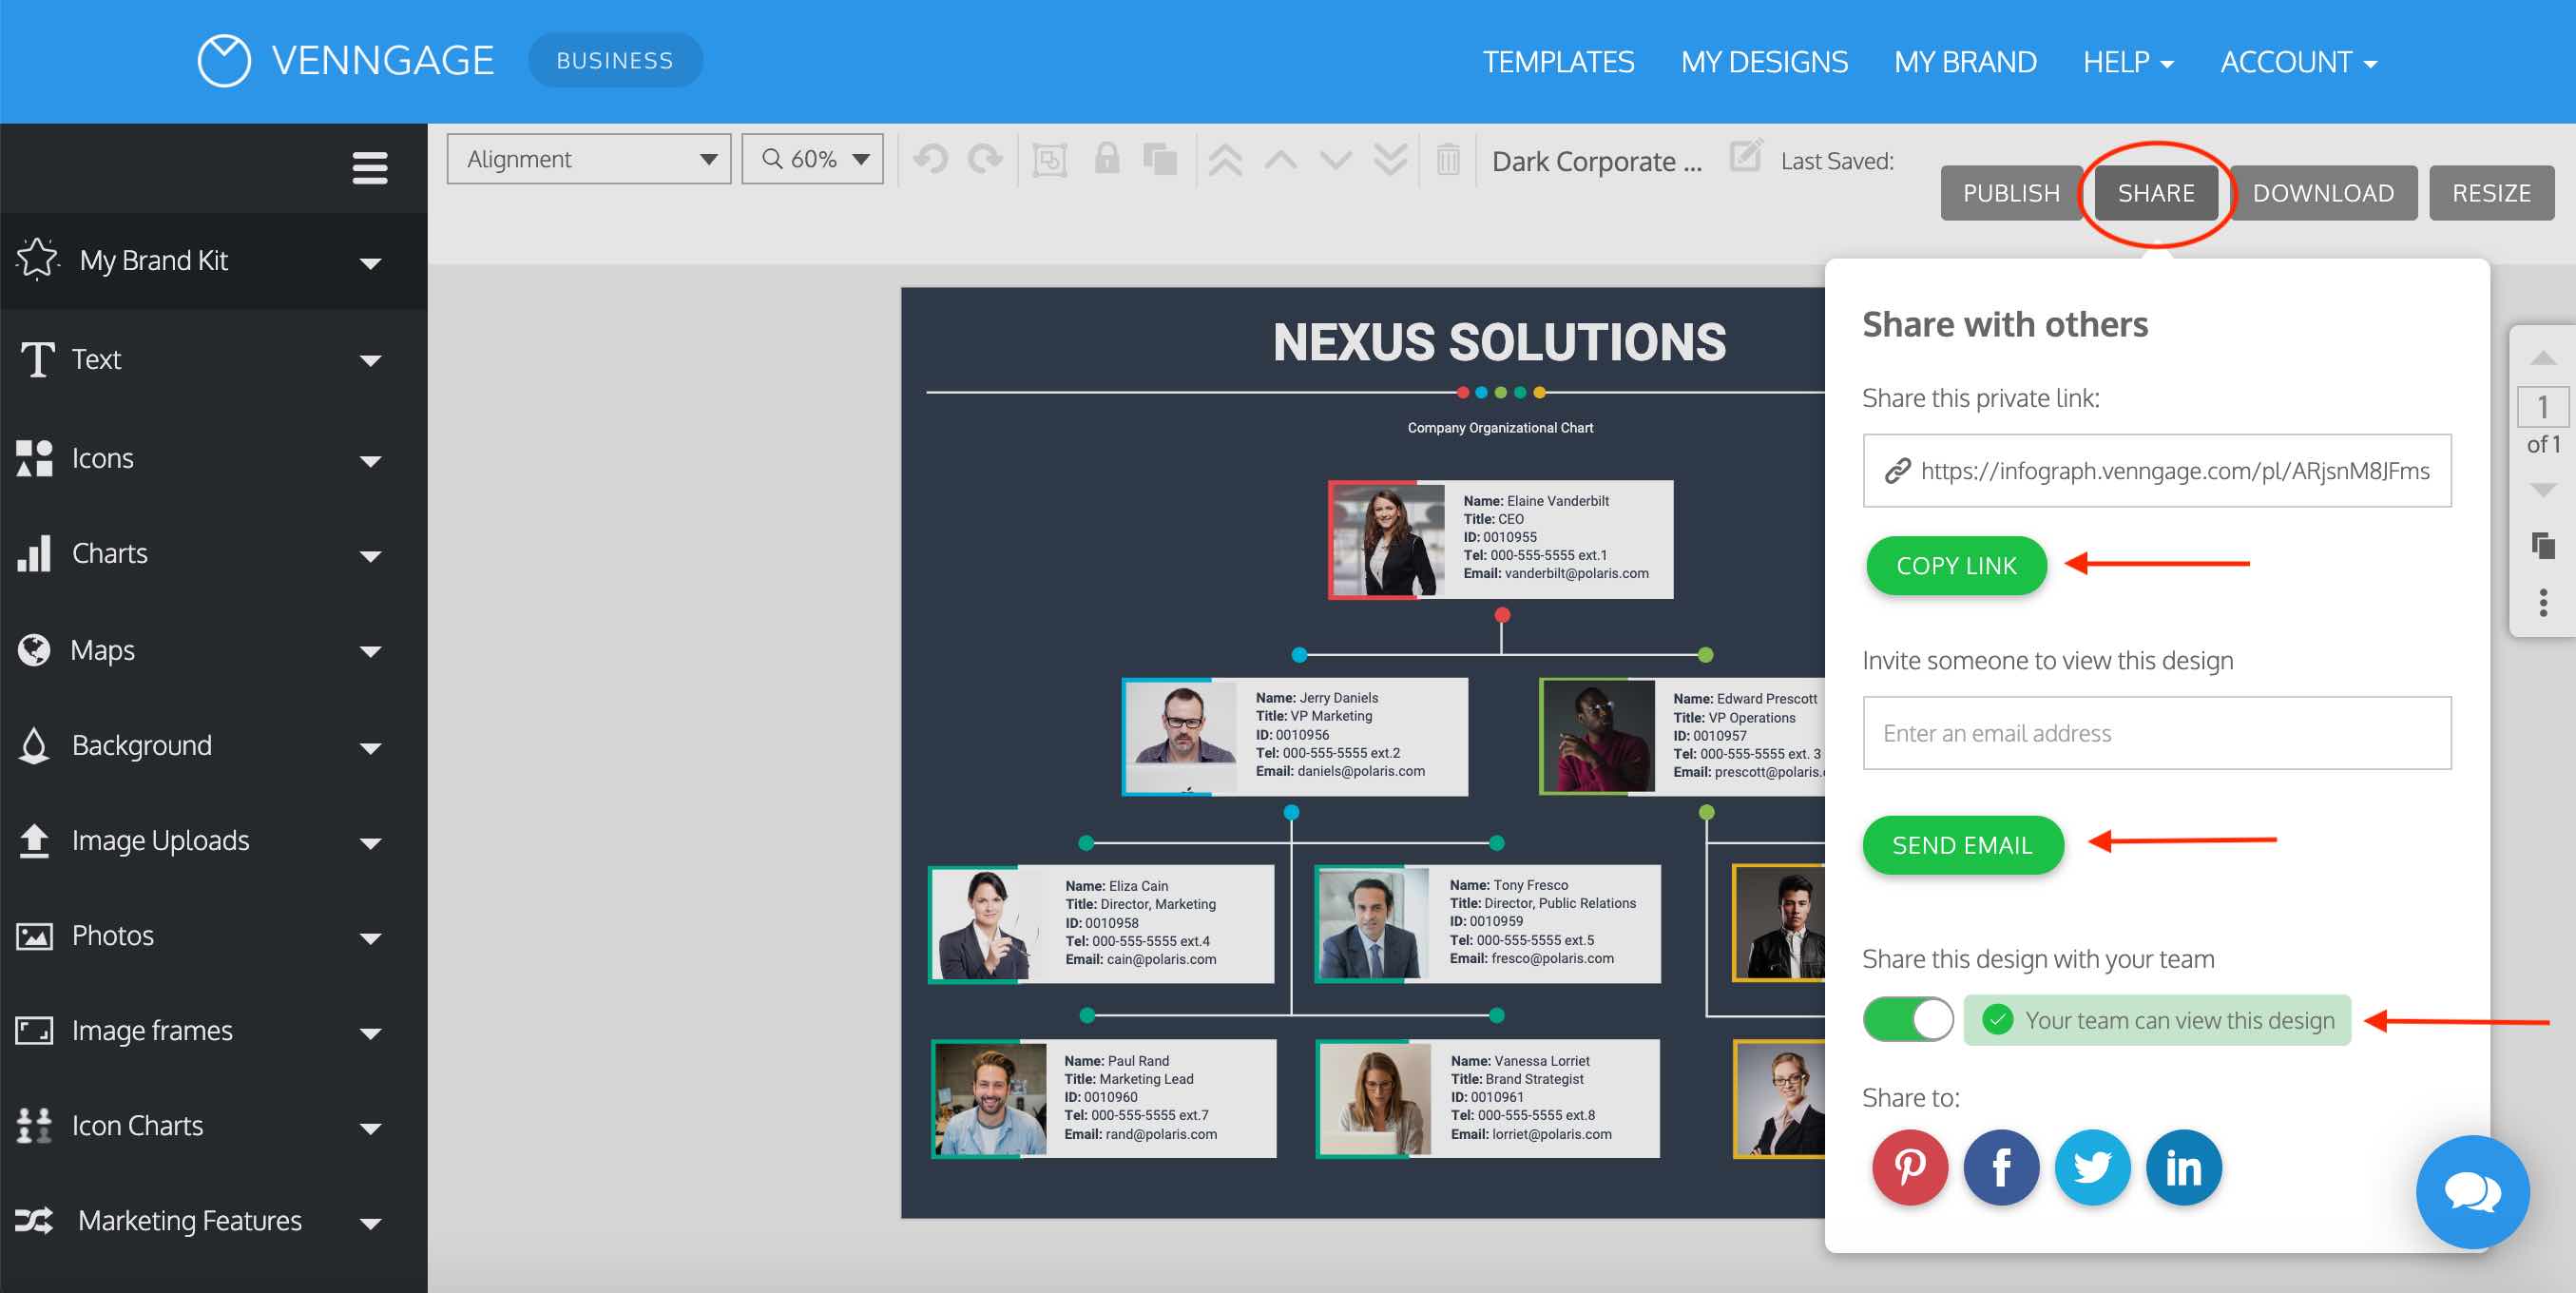
Organizational structure charts can also include contact details for the members of the team. This example below also makes good use of icons to illustrate what each department is responsible for:

If you want your org charts to appear more human, you can personalize it by using people’s photos:


Pro Tip: Upload your own photos in the Venngage editor and then drag and drop to replace any existing photo in the template. We’ll resize it for you. The example below shows how I replaced the VP Marketing’s photo with a photo of myself:
Related: 12+ Organizational Chart Examples and Templates
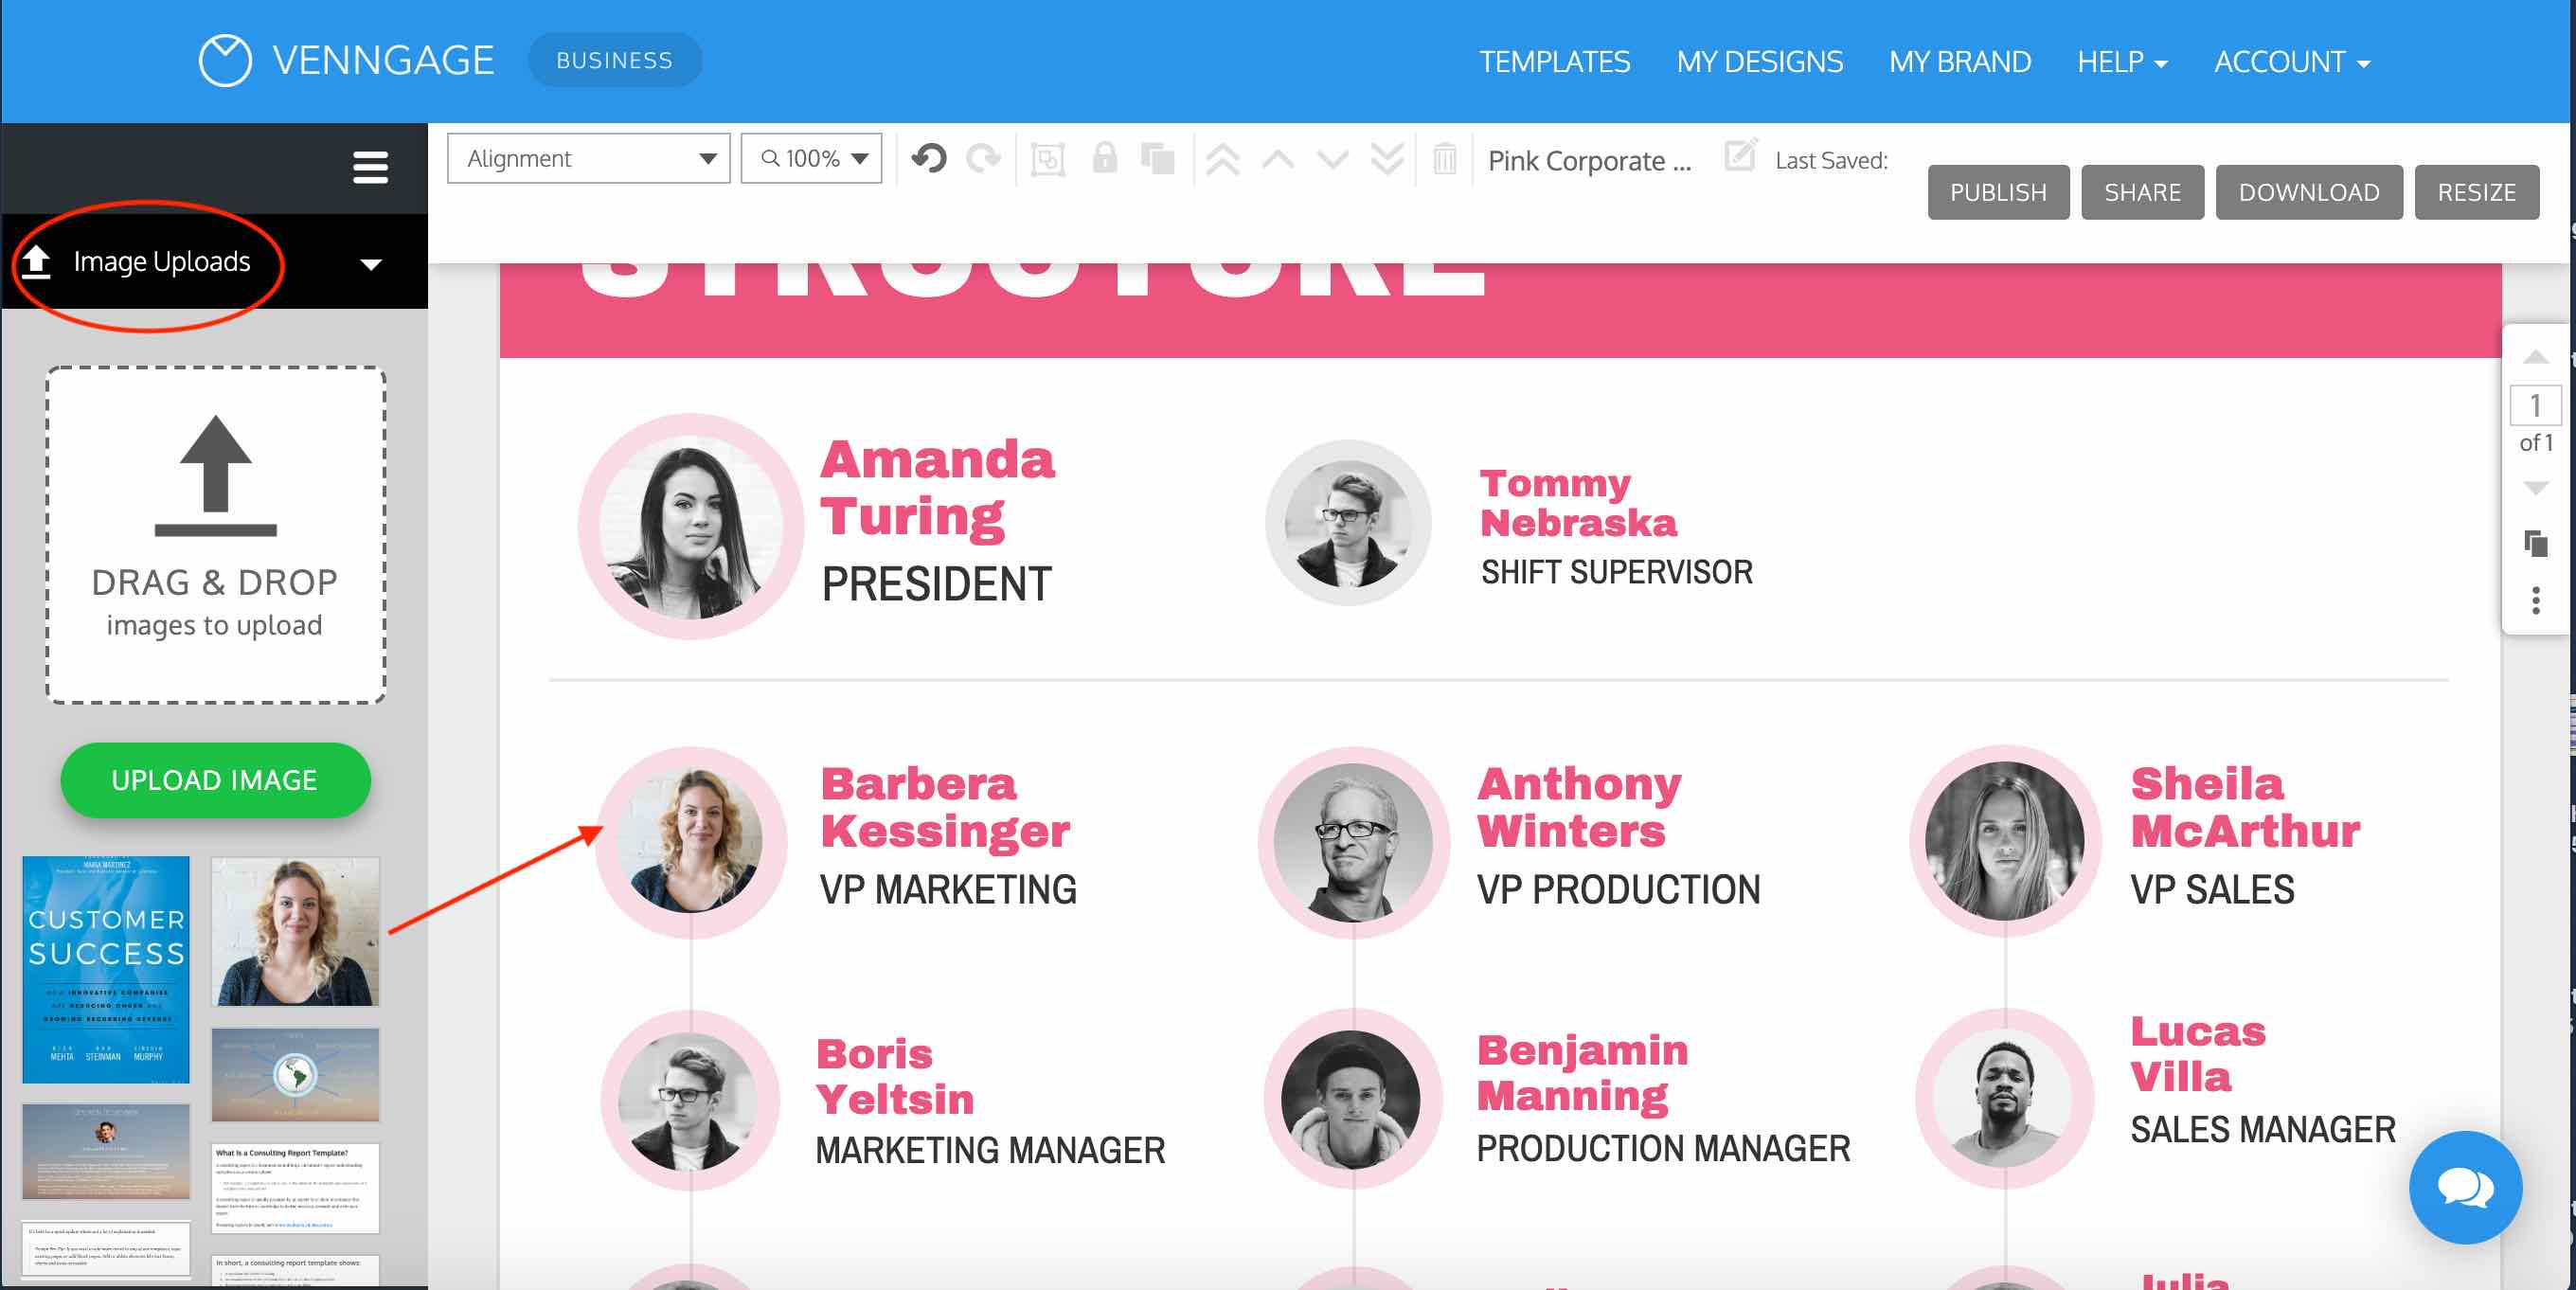
Hiring process flow chart template

The HR department extensively uses flow charts for hiring, onboarding, appraisal or exit processes to standardize these processes.
The hiring process varies widely between companies — some may involve three rounds of interviews and reference checks, while others might include a skills test. Flowcharts are incredibly useful for mapping out these unique processes clearly.
Breaking down complicated processes like hiring into manageable steps helps keep teams aligned and focused on the hiring outcome:

Most hiring flow charts are boring and uninspiring. But you can use a vibrant flow chart template to showcase your employer brand and make things visually engaging.
For instance, you can use colors in a flow chart to:
- Differentiate between types of information.
- Emphasize specific points.
- Give your flow chart personality.
You can use colors to differentiate between different stages in a process. Or as in this template, between different departments:

The flowchart template above is a swimlane diagram. For more information about this type of diagram, check out these posts:
- Swimlane Diagram: Ultimate Guide to Designing Better Business Processes
- 10+ Swimlane Diagram Templates and How to Create Them
Not only can the colors help readers remember the information, but they can also make your flow chart easier to scan.
Take a look at how color is used in this flow chart template that shows a hiring process:
Some tips for using color to communicate information effectively:
- Use contrasting but complementary colors to highlight information.
- Add a single color to a black and white design to highlight a single piece of information.
- Pick colors that reflect the mood or theme of your information.
Read our guide on how to pick brand colors for more tips.
Pro Tip: Brand your flow chart template with one click using our My Brand Kit. The example below shows how you can open our My Brand Kit tab and click your color palette to apply it to the entire template. You can pull your brand colors from your website or set them manually. This is useful for consultants and freelancers who quickly want to add a client’s branding to their document.

Project risk flow chart template
Most projects come with risks. The role of HR is to help prepare for risk, especially when it comes to personnel.
A flow chart template can be a good way to map risk per project to the people involved. The free flow chart template below could be used during a project initiation or to show how a company is being restructured.

Marketing flow chart template
Marketing campaigns take many different shapes and forms. You can use a flow chart template to plan campaigns and marketing strategies. Flow charts can also be used to develop marketing processes.
Flow charts are also a valuable marketing tool themselves, especially when used for events or social media.

Event invite flow chart template
This free flow chart template doubles as an event invitation you can post on social media or print and make into a flyer:

You could also customize the above flow chart template for a special sale or promotion.
For example, one flow path could be:
- Do you have an office Christmas party coming up?
- Do you own a dress that’s half-decent?
- No.
- You need to shop our 30 percent off holiday sale!
Marketing experiment flow chart template

Flow charts aren’t just visuals that explain processes to others.
They can also be useful tools to help you plan and prioritize projects, strategies and experiments.
For example, take the free flow chart template below that you can use to determine if a growth experiment is worth running. It’ll help you plan and implement your own business growth strategy:
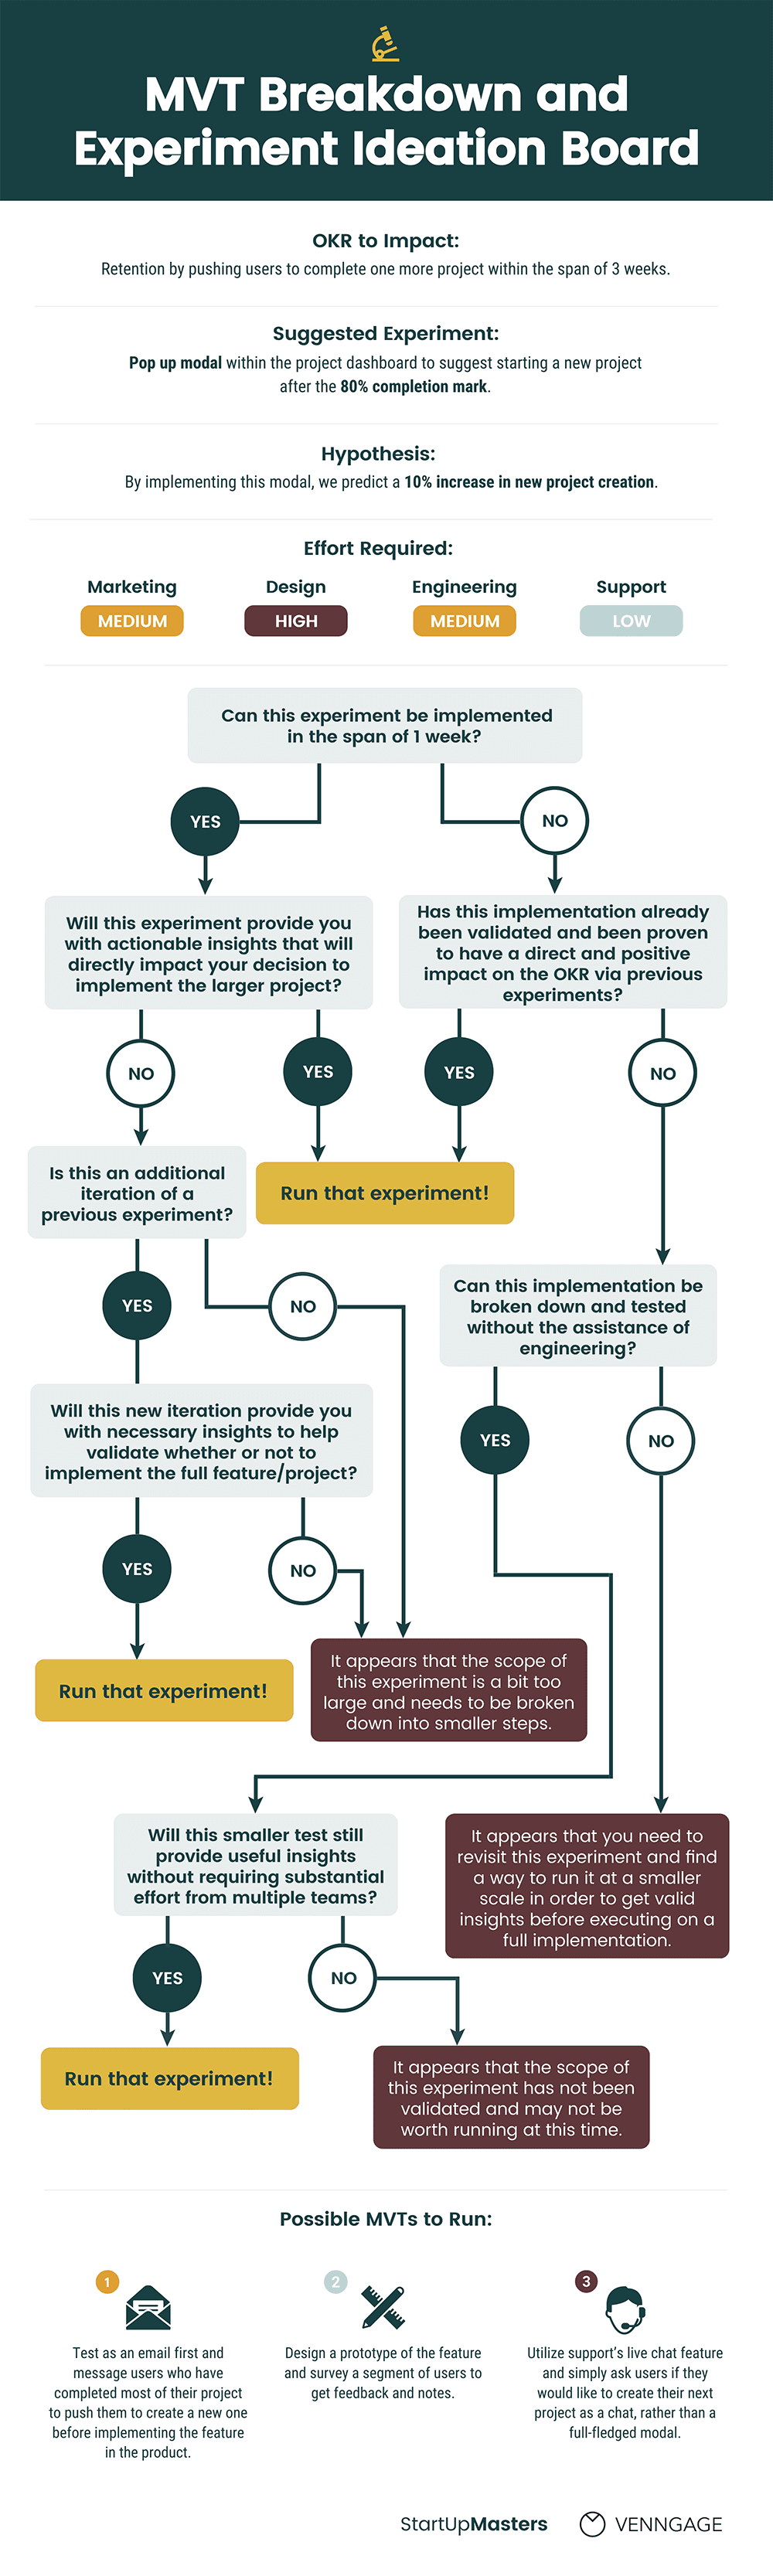
Tips for using a flow chart to prioritize experiments:
- Identify the key metric or goal you want to impact and the experiment you want to run to impact that goal.
- Ask predictive questions about the value and resources of the experiment, to gauge if it should be a priority.
- Use different colors to categorize the types of resources required or the amount of effort required to run the experiment.
Customer journey map flow chart template
Charts and infographics are the perfect formats for telling stories with your data. They allow you to illustrate concepts and events using engaging visuals, like in the process flow example below.

One of the most popular uses of a flow chart is to illustrate a business’ customer journey.
While customer journey maps can be quite simple, more businesses are creating engaging visuals to tell their customers’ stories.
Icons, bold colors, and elegant fonts can all be used to make your customer journey map interesting to read, while still maintaining a professional look.
If you want to include more than one customer persona’s path in one visual, then using different colors and icons (or photos) for their respective paths will make your chart easier to read. Take this free flow chart template, for example:

Click any of the templates above to enter our online customer journey map maker. Customize the template to your liking — no design experience required.
Tips for using a flow chart to tell a story:
- Use directional cues like arrows to guide how people read your chart.
- Use icons to illustrate the steps or stages in your process.
- If you’re showing more than one customer persona’s journey, use different colors and illustrations to identify their respective paths.
Social media flow chart template

Flow charts don’t have to just visualize boring business processes. They can also be a fun way to engage your audience on social media!
You could create a flow chart that doubles as a quiz, like this flow chart we made that tells you what your whiskey personality is. People like quizzes, so don’t be afraid to use them in your content.
Or take this super helpful flow chart that helps you come up with plans for Valentine’s Day.
The bright background color and quirky icons help make the design pop from people’s newsfeeds:
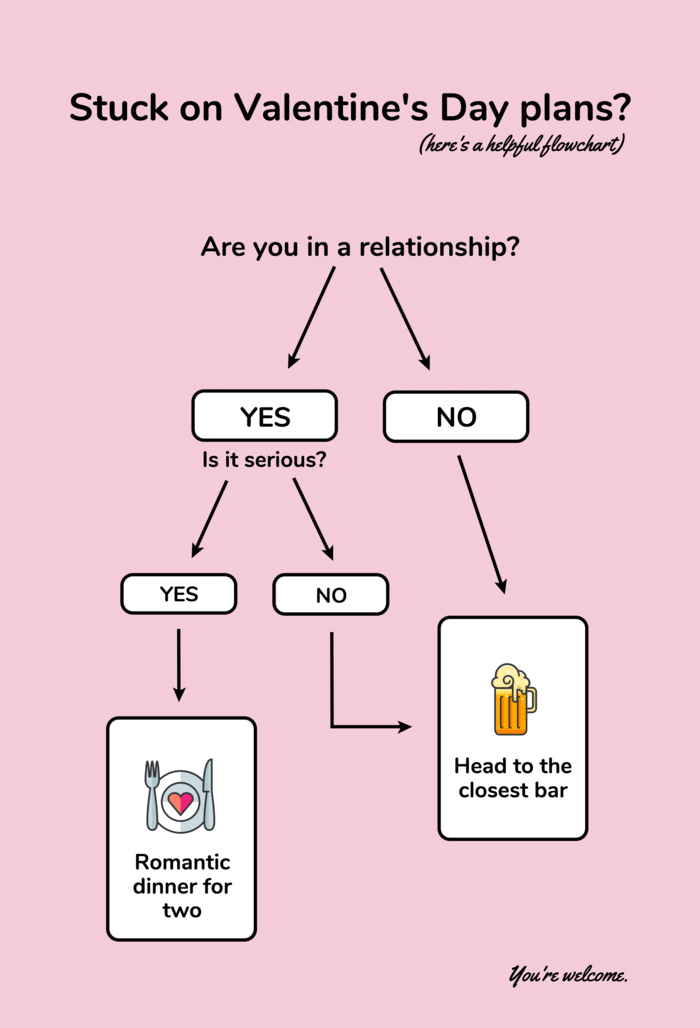
Key tips for designing a flow chart for social media:
- Keep your chart very simple, so people will be able to read it easily.
- Use the optimal image dimensions for each social media platform.
- Pick a bright, bold color scheme that will stand out from newsfeeds.
Infographic flow chart template
Infographics are a valuable tool for content marketing.
If you’re creating an infographic that covers more information, you can incorporate a small flow chart into your design.
It’s generally a good idea to only visualize a short process or a simple concept.
Information that requires more detail would probably require its own infographic or chart.
For example, this infographic uses a flow chart in the first section to show how different elements of your content feed into its overall style and readability:

When incorporating a flow chart into a bigger infographic, remember to:
- Keep your flow chart brief and focused on one concept.
- Clearly title the flow chart section so readers understand it.
Real estate flow chart template
Real estate agents can also use flow charts in their marketing materials, to help clients understand the real estate journey.
This real estate flow chart template below can help prospective clients understand their needs better. Providing information about your industry that isn’t just a sales pitch can help build authority and trust.

Project flow chart template
Projects often involve multiple steps or stages, and keeping track of progress can be difficult. If your project involves multiple team members making sure that everybody is on the right track is important too.
When developing any new project timeline, it can be handy to create a project flow chart to map the stages and reliances.

Product design flow chart template
Icons are another design element that you can use to make your information more memorable. You can use icons to emphasize points and to illustrate concepts.
For example, this flow chart uses icons to emphasize and illustrate each step in the product design process (like a rocket ship icon for the launch phase):
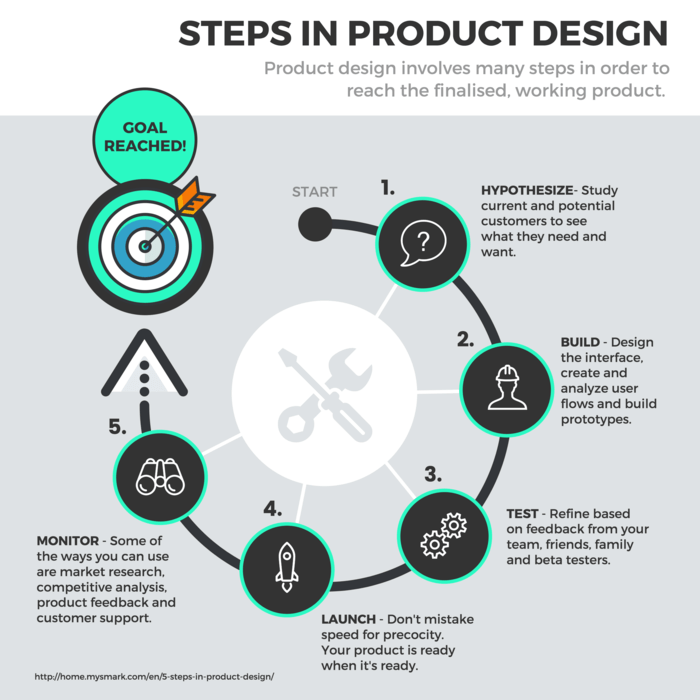
Pro Tip: With Venngage templates, you can click on any icon and click “Replace” to change it. Our icon library has thousands of professional icons to choose from. You can also search the right icon by keyword. In the below example, I searched for “sales” to find the right icon to represent a VP of Sales in an org chart. The tool inserted (and resized) a shopping cart icon for me.

When picking icons for your designs, remember to follow these best practices:
- Pick icons that are the same style (same line width, flat or illustrated, filled or line art, etc.).
- Make sure your icons are consistently sized, to prevent your design from looking cluttered.
- Don’t use icons to replace text unless the meaning is very well known (for example, a stop sign).
Evaluation flow chart template
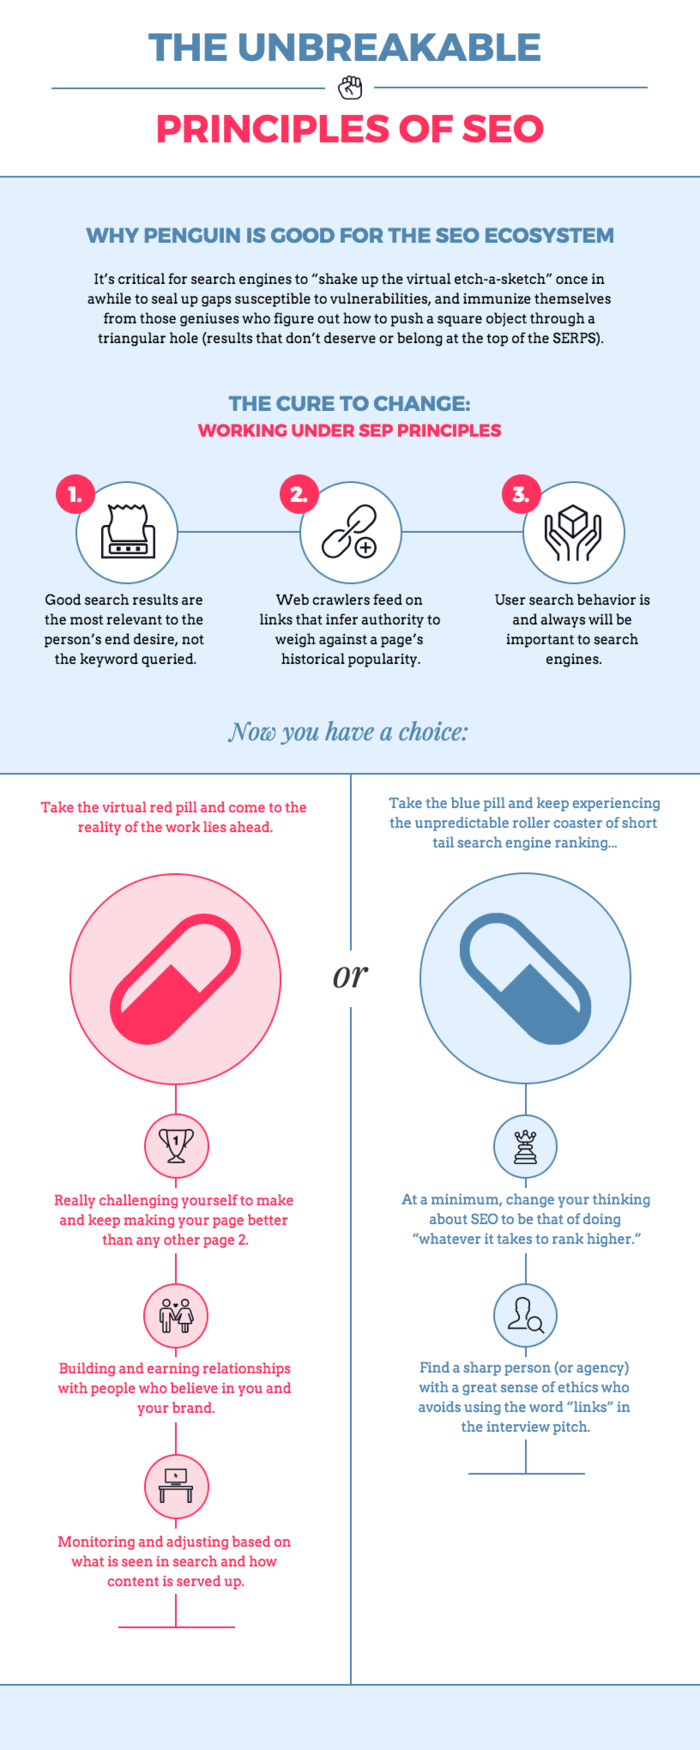
If you want to help people make a decision, a flow chart is a great way to visualize two options or paths people can take. You could show how the two paths diverge from the same starting points, or you could place two flow charts side by side.
For example, this infographic shows two potential paths readers can take by placing two flow charts side by side:
This colorful pitch deck compares a new company with its competitor on slide #4:

Keep these tips in mind when using a flow chart to show two options:
- Show parallel options or stages in the process by placing them level with each other on the page.
- Use colors and icons to differentiate between the two paths.
- Use a brighter color to emphasize a path you would like readers to follow (for example, if you’re showing two service plan options).
Process flow chart template
Showing complicated processes can be difficult when using text alone. By using a visual flow chart template you can effectively communicate process flows. This type of flowchart can also be used to help keep teams aligned on complicated projects.

In this food ordering flow chart, the process of placing an order is clearly explained with multiple “yes” or “no” choices. A flow chart like this can be used to onboard new employees, to understand the processes involved in a successful business interaction, or to visualize the steps within an automated ordering system or any other type of automated process.
Related: 21+ Flowchart Examples to Organize Projects and Improve Processes
Cyclical flow chart template

Some processes don’t have a definite beginning or end and a flow chart is a great way to visualize that. For example, this brochure template uses a flow chart to show why this business is sustainable:

This simple flow chart example is dynamic and lays out a reoccurring process (design):
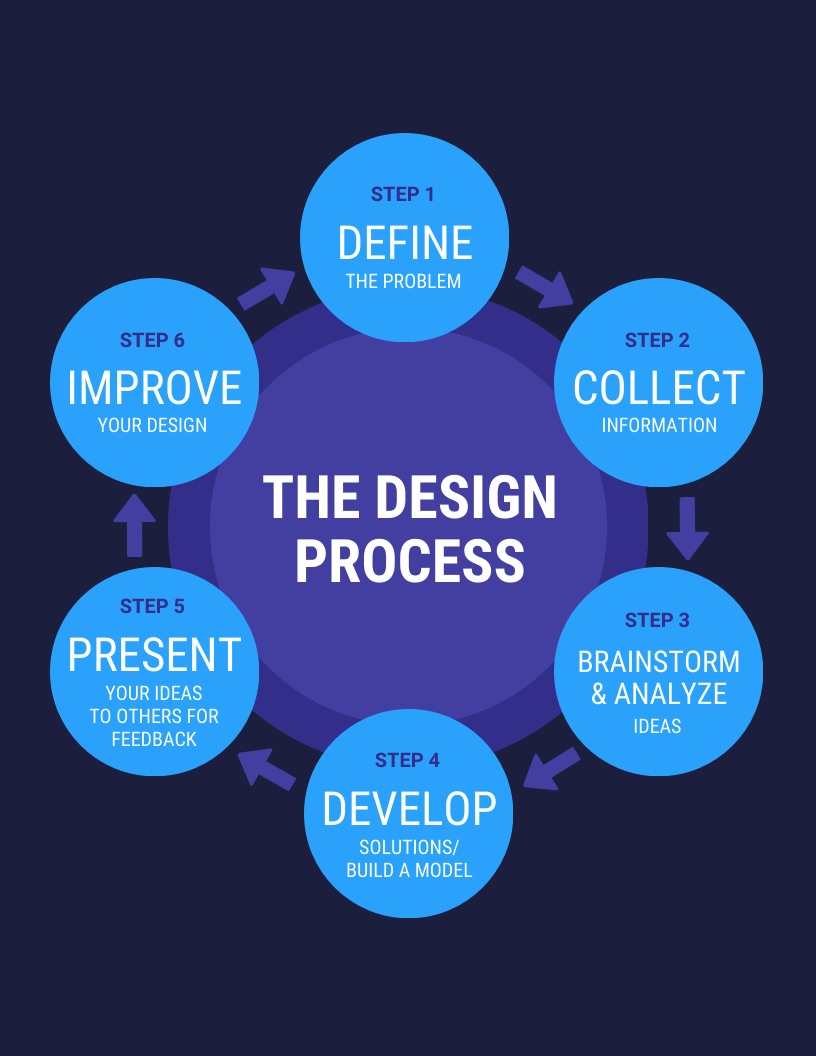
Tips for using a flow chart to visualize a cyclical process:
- Put the “starting point” in the top left corner of your flow chart.
- Use directional cues like arrows to indicate which direction the cycle moves in.
- Offer brief description of the flow chart for context.
Combining flow chart template
Do you want to visualize two processes that work in tandem with each other? To help readers better understand both processes, you may want to create a flow chart that visualizes both.

The key for combining two flows is to keep the charts simple.
If you try to incorporate too many parts, your flow chart will quickly become cluttered.
For example, the presentation flow chart template below uses a simple five-step flow chart that spans across four stages to show how an inbound marketing funnel and content strategy work together:
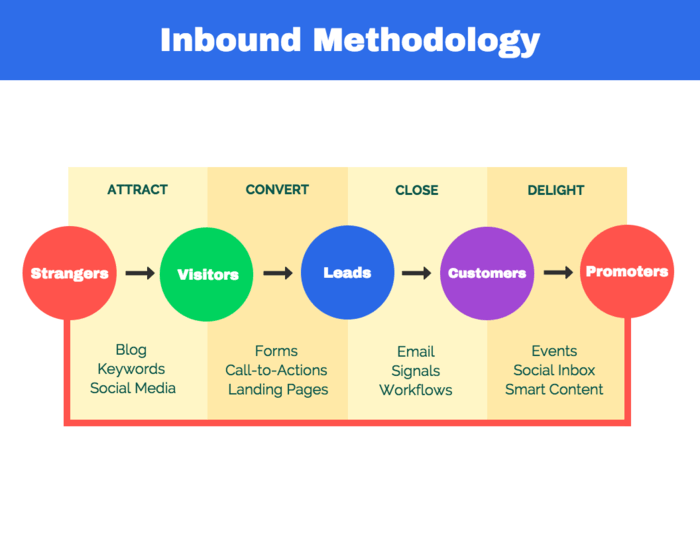
Notice how the circles are in bright colors, so they contrast with the more neutral rectangles. This makes the chart easier to read.
Keep these tips in mind when combining two flows in one chart:
- Keep the flow charts simple, and don’t include too many points.
- Use color and shapes to differentiate between the two flows.
- Provide a clear title and if you think it’s necessary, a brief description of the chart.

Data flow diagram template
A data flow diagram (DFD) visualizes the flow of data and/or information throughout a system or a process. Here’s an example:

For more examples of DFDs, check out this post: What Is a Data Flow Diagram and How To Make One?
Data-driven flow chart template
Most times, flow charts are meant for either school or business. You’re most likely to have statistics that will bring more substance to your flow chart.
Adding data will not only add variety to your information, but numbers usually are much more eye-catching than a cluster of words.
Your presentation design is important for how you display your data. Use that to guide your flow chart thought process!

Have your information draw a reaction from your audience by adding credibility to what you’re showcasing.
Without the facts presented in the free flow chart template above, you wouldn’t realize the value in the information being presented.
Customer support flow chart template
Customer support is a unique job that benefits from flow charts to understand user journeys and pain points. Often, customer support staff will not have technical knowledge of the problems so a flow chart that runs through common errors is a helpful tool.

Providing flow charts for customer support training upfront is another way to ensure that your customers are having their issues resolved quickly and efficiently.

In this customer support flow chart template, the three stages of troubleshooting are labeled by color. This allows customer support employees to help customers more efficiently.

Flow chart design best practices
To ensure your flowchart is easy to follow, consider these best practices.
- Plan your flow chart before you begin designing. How many steps will it have? How complex do you want it to be?
- Scroll through this post and pick a flow chart template that fits the process you want to visualize. Click “Create” to enter our flow chart maker.
- Add, remove, or rearrange points in the flow using Venngage’s drag and drop canvas. Even design newbies can use our tool.
- Insert your own dates and events using the text boxes.
- Customize the colors, fonts and icons to make the design your own. We’ll give you tips on exactly how to do this below.
- All done? Easily share your flow chart via email or upgrade to download it.
Flow chart template FAQs
1. How do you make a flow chart?
To make a flowchart, start by listing your main steps, defining decision points, connecting them with arrows and labeling each action clearly. You can easily follow this step-by-step guide on how to create a flowchart to design one visually in minutes.
2. How do you create a flow chart in Word?
You can easily make a flowchart in Word using Venngage. Choose a free flowchart template, edit and customize it to match your process, then download it as a PNG or PDF to insert into your Word document.
3. What is the best tool to make a flowchart?
The best flowchart maker tool is one that’s intuitive and flexible. Venngage offers ready-to-use flowchart templates, drag-and-drop editing, auto-resizing shapes and thousands of icons, everything you need to create professional diagrams quickly.
4. How do I choose the right type of flowchart?
Start with your purpose. Use a process flowchart to map workflows, a decision flowchart to show options and results or a data flowchart to visualize information flow. Venngage’s templates make it simple to find and customize the right fit.
AI-generated flowcharts & future trends
AI is changing how we turn ideas into visuals. Instead of spending hours dragging boxes and arrows, you can now describe a process in a simple sentence and AI instantly builds a flowchart for you. It’s fast, surprisingly accurate and takes the guesswork out of mapping complex workflows.
At Venngage, we’re leaning into this shift. Our goal is to use AI not just to generate flowcharts, but to understand the context behind them, spot inefficiencies, suggest improvements and make every diagram smarter.
Imagine creating a polished, optimized flowchart in minutes, guided by AI that actually gets your process. That’s where we’re headed.
More design tips and templates:
20 Timeline Template Examples and Design Tips
6 Comparison Infographic Templates and Examples
11 Templates to Turn Boring Information Into Creative Infographics


