
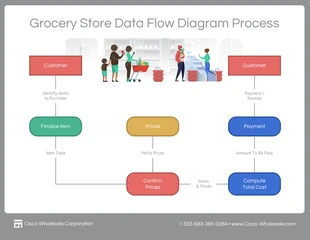
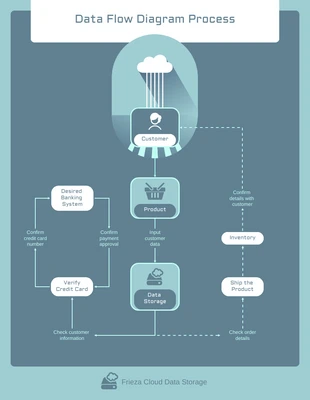
Physical Data Flow Diagram Template
Create your own Physical Data Flow Diagram by customizing the Venngage Physical Data Flow Diagram template.

 100% customizable templates
 Millions of photos, icons, charts and graphics
 AI-powered editing features
 Effortlessly share, download, embed and publish
 Easily generate QR codes for your designs
- Design stylemodern
- Colorsdark
- SizeLetter (11 x 8.5 in)
- File typePNG, PDF, PowerPoint
- Planpremium
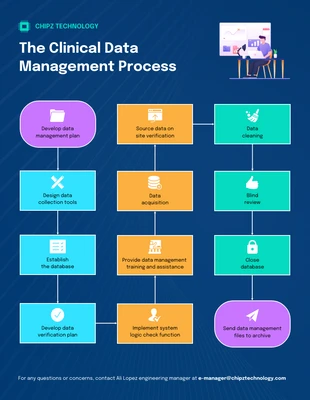
A Physical Data Flow Diagram (PDFD) is a graphical representation of how data flows through a system. It can be used to show the flow of data between people, departments, or systems, and how data is processed within each element. PDFDs are useful for understanding the relationships between different parts of a system, and for identifying bottlenecks or points of inefficiency. They can also be used to create a roadmap for improvements or redesigns. Physical Data Flow Diagrams are typically drawn at a high level, showing the overall flow of data through the system. However, they can also be Drill Down diagrams, which show more detailed information about a specific part of the system. When creating it, it is important to start by identifying the different elements of the system and their relationships. Venngage’s Physical Data Flow Diagram template makes it easy to create a PDFD, even if you don’t have any design experience. The template is fully customizable, so you can change the colors, icons, and text to match your brand or system. You can also add or remove elements
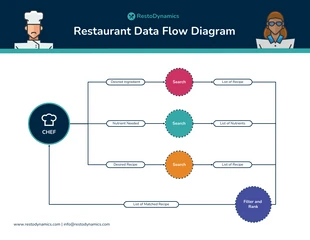
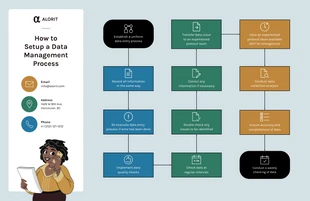
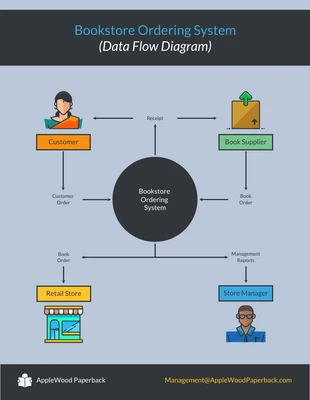
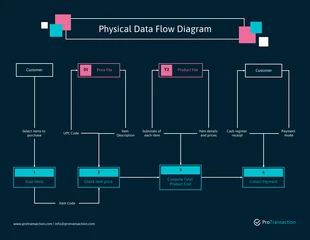
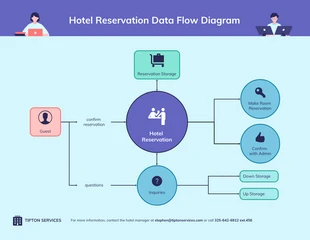
Related Diagram Templates
data flow diagrams
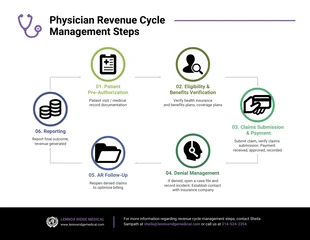
flowchart diagrams
data flow diagrams
flowchart diagrams
flowchart diagrams
data flow diagrams
data flow diagrams

flowchart diagrams
data flow diagrams
data flow diagrams
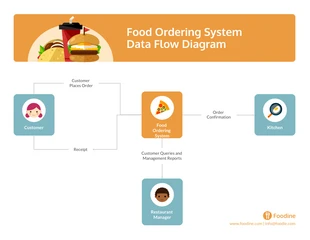
data flow diagrams
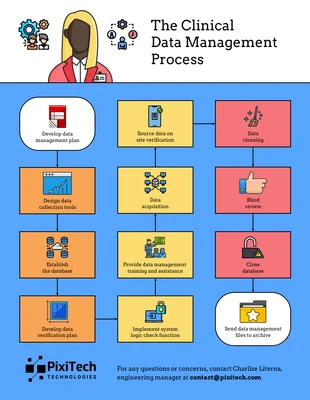
flowchart diagrams