

An organizational chart is a visual map of how a company is structured. It shows who reports to whom, how teams are organized, and where each role sits within the hierarchy.
There are several types of organizational charts, including hierarchical, flat, matrix and divisional. Each one works differently depending on your team size and reporting structure, and it can be confusing to pick the best chart type for your org.
This guide covers what each type is, when to use it, and how to create one. You’ll also find real examples and templates you can start with.
I’m going to break down what business organizational charts are, share plenty of neat examples and show you how to design your own using an AI Org Chart Generator or awesome organizational chart templates.
What is an organizational chart?
An organizational chart (also called an org chart, organogram, or organigram) is a diagram that shows the structure of an organization. Most look like a pyramid, with leadership at the top and individual contributors at the bottom.
It typically includes employee names, job titles, departments and reporting lines — so anyone looking at it can quickly understand how the organization is structured, whether it has a top-down hierarchy or a flat hierarchy.
Org charts are used for everything from onboarding new hires to planning team restructures. They make it easier to see who owns what, who approves what and where each team fits in the bigger picture.
Why organizational charts matter
A well-structured org chart shows clear reporting and decision-making within the organization.
Here’s what it helps with:
- Onboarding: New hires can understand the company structure from day one without having to ask around.
- Clarity: Teams know who to go to for approvals, questions and escalations.
- Planning: Leaders can spot gaps, overlaps or overloaded teams before they become problems.
- Communication: Cross-functional projects run more smoothly when reporting lines are visible.
- Restructuring: When the company grows or reorganizes, an updated org chart keeps everyone aligned.
Types of organizational charts
Let’s understand the different types of organizational charts and what they are used for:
1. Hierarchical organizational chart
A hierarchical org chart is the most common structure. It shows a clear chain of command from the top down, with leadership at the top and individual contributors at the bottom. This one works best for large organizations with multiple layers of management.
2. Flat organizational chart
A flat org chart has few or no middle management layers. Most employees report directly to leadership. It works well for startups and small teams where speed and autonomy matter.
3. Matrix organizational chart
A matrix org chart shows employees reporting to more than one manager, usually a functional manager and a project manager. It’s common in companies where teams work across multiple departments simultaneously.
4. Divisional organizational chart
A divisional org chart groups the structure by product, region or market. Each division operates semi-independently with its own resources and leadership. You’ll see this most often in large companies with multiple product lines or geographies.
5. Team or department organizational chart
A team or department org chart maps out a single team rather than the whole company. It’s useful when you need internal clarity without overwhelming people with the full organizational structure.
How to choose the right organizational chart
The right chart depends on how your organization actually operates and not on just how big it is. A 500-person company running autonomous product teams needs a different structure than a 500-person company with centralized leadership.
Use this table as a starting point:
If your company has clear reporting lines and multiple layers of management, a hierarchical chart is the safest choice. If your team is small and moves fast, a flat structure will reflect how you actually work. If people regularly report to more than one manager or work across departments, a matrix chart will be more accurate than forcing everything into a hierarchy.
Key elements of an effective organizational chart
Here’s what a well-built org chart should include:
- Employee names: Full names, not just initials or usernames
- Job titles: Specific enough to be meaningful, not just ‘Manager’ or ‘Lead’
- Departments or teams: Make sure people can see how the organization is grouped
- Reporting lines: Add solid lines showing direct reports
- Dotted-line relationships: For secondary reporting or cross-functional roles that don’t fit neatly into one team, use dotted lines
- Levels of authority: So it’s clear who has decision-making power at each level
- Photos and contact details: Useful for internal-facing charts, especially in larger or remote organizations
Not every org chart needs all of these. A public-facing team page needs less detail than an internal HR chart. Build for the audience who will actually use it.
How to create an organizational chart
Building an org chart is straightforward once you have the right information and a clear sense of what the chart needs to do. Here’s how to approach it.
Step 1: Define the purpose
Decide what the chart is for before you build anything. An org chart for onboarding looks different from one used for restructuring planning. One built for your company website needs less detail than one used internally by HR. Getting clear on the purpose upfront saves you from building something that doesn’t serve the people using it.
Step 2: Gather accurate information
Collect names, job titles, departments and reporting lines for everyone who needs to appear on the chart. For larger organizations, work directly with HR to make sure the data is current. An org chart with outdated titles or missing roles creates more confusion than having no chart at all.
Also note any dotted-line relationships. These come up often in matrix structures and cross-functional teams where someone reports to more than one manager.
Step 3: Choose the right format
Pick the structure that matches how your organization actually works. Don’t default to hierarchical just because it’s the most common. If your team is flat or project-based, choose the format that reflects that. The types section above covers each format in detail if you need a refresher.
Step 4: Build the chart
Start with the top level and work your way down. Add a box for each role, label it clearly and connect reporting lines between levels. Group roles by department where it makes sense. If the chart gets too crowded, split it into separate department-level charts rather than cramming everything into one.
This is where a tool like Venngage’s AI Org Chart Generator makes the process faster. Instead of manually drawing shapes and connectors, you can add simply a text prompt and let Venngage’s AI Design Generator create an org chart. You can easily customize the chart by editing the text and colors, and adding your brand logo.

Step 5: Keep the design clear
Use consistent box sizes, readable font sizes and a limited color palette. Color is useful for distinguishing departments but too many colors becomes distracting. Avoid abbreviations unless they’re widely understood across the organization. The goal is for someone to look at the chart and understand the structure without needing a guide.
Step 6: Review and update regularly
Org charts go stale fast. Every hire, exit, promotion or reorganization is a reason to update it. Build a review process into your HR or operations workflow so the chart stays accurate. A chart that hasn’t been updated in six months is likely already misleading.
Tools you can use to make an organizational chart
You have several options depending on how complex your structure is and how often it changes:
- Word, Excel and PowerPoint: Work for simple, static charts but require manual adjustments every time something changes.
- Diagramming tools: Dedicated tools like Lucidchart or Miro give you more flexibility than Office tools.
- Online org chart makers: Venngage has a library of org chart templates you can customize and update without rebuilding from scratch. You can also edit the templates using AI. Simply add your org details and let AI design your org chart.
Can you create an organizational chart in Word or Excel?
Yes, and many people do. Word, Excel and PowerPoint all have basic shape and SmartArt tools that let you build a simple org chart manually. They’re a reasonable option if your organization is small and your structure doesn’t change often.
The limitation is that these tools aren’t built for org charts specifically. Adding a new level, moving a branch or updating multiple roles means manually adjusting shapes and connectors, which gets tedious fast. If your chart covers more than one department or needs regular updates, a dedicated org chart tool will save you a significant amount of time.
Organizational chart: types, examples & templates
Let’s take a look at 20 organizational chart examples you can use in your business.
The majority of these examples feature hierarchical org charts, but you can add or delete branches to create other types of org charts as well.
1. Vertical organization chart example for small teams
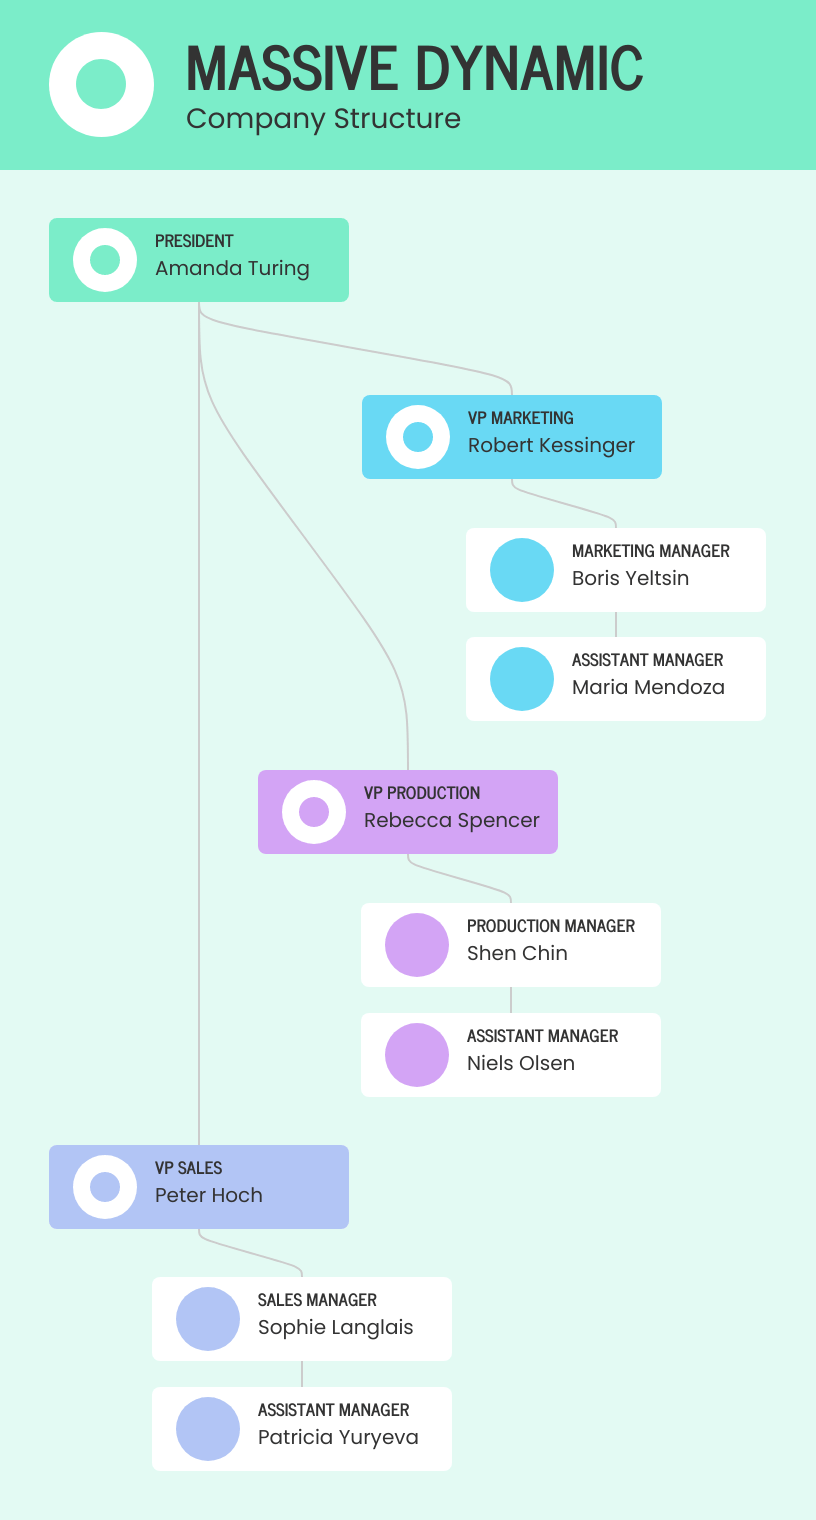
A vertical organization chart works well for smaller corporate structures or for departments within a larger organization. It represents the chain of command and reporting relationships from the top to the bottom. It typically starts with the highest-ranking individual or position (such as the CEO or President) at the top and brances into lower levels of management and employees down to the bottom.
This vertical corporate structure chart uses dynamic colors to differentiate the teams and their reports, making it easier to understand the role of each team member.
2. Corporate vertical organizational chart example
This vertical organizational structure chart helps employees understand who they report to, who their peers report to and the responsibilities everyone has.
Although the layout itself is minimal, the shapes and colors bring life to the design. You can also use icons to differentiate between departments in organizational chart designs. This will especially help new hires understand right away what they’re looking at.

3. Simple project team vertical organizational chart example
For a more modern look and feel, check out this alternate take on a healthcare organizational chart.
It incorporates a digitized background design and a flat color palette. You can use this template to show the structure of a project team with the project manager at the top, followed by team leads, and then individual contributors. This helps ensure accountability and clarify decision-making authority.
Also, if you want to introduce a fun visual twist for a more playful or creative team chart, you can even experiment with glitch-style lettering. Using the zalgo text generator, you can give certain titles a distorted, drippy effect that adds a quirky, unexpected vibe to informal org charts.

4. Department hierarchy organization chart example
When designing your own organizational chart, it’s important to group employees together who report to the same manager/executive.
It’s up to you how you visualize those connections. One method is to use lines and nodes for a typical layout. Or, as in this vertical organizational chart example, you can use a legend and a varied color palette to indicate the reporting structure.
Large departments within corporations can use this chart to show internal team hierarchies, ensuring that employees understand the flow of communication, supervision, and responsibilities within each department.

5. Board or leadership organizational chart example
An organizational chart can also be more than a breakdown of reporting relationships.
This organizational chart includes contact information for individual staff, such as email addresses, extensions, or business phone system details. This is especially helpful for new employees or when communicating across departments. You can use this template to showcase the structure of board of directors. Outline the board members, their roles, and any committees. It gives a clear, bold look, suitable for corporate reports or investor presentations.

This is a memorable way to show the connections between departments and team members and it makes a statement.
6. Functional organizational chart example
If choosing a design style for your organizational chart feels challenging, consider your organization’s brand guidelines.
It can provide you the style and color inspiration you need to get started.

7. Marketing department organizational structure example
In this example, the organizational chart is broken down by function and it’s clear the president oversees the marketing, sales, and production departments. Marketing, design, or creative agencies can use this template to display their team hierarchy while maintaining a visually compelling, artistic presentation.

8. Cross-functional organizational chart example
Generally, a traditional marketing organizational structure is broken down by departments.
You have teams entirely dedicated to areas like branding, communications and digital. It’s also important to identify teams that marketing relies on – like customer success and developers.
With the use of a vibrant color palette, you can clearly identify each department and who belongs in each. It’s easier to scan and follow over angular lines, especially in more complex organizational structures.
This blue functional organizational chart example is broken down in a similar way. The layout is just set to landscape and reads from left to right.

Notice how this organizational chart design makes use of employee headshots? That’s especially helpful to new employees.
With the rise of remote work and remote employee onboarding, you may not always share an office or break room with fellow co-workers, so headshots in a organizational chart is a simple way to help folks get acquainted. Many organizations also include organizational charts in a flipbook presentation during onboarding, giving new hires an easy way to review reporting structures, departments and key team members at their own pace.
9. Apple hierarchical organizational chart example
A vertical organizational chart, or hierarchical chart, is the traditional org chart you see in many organizations.
The layout positions the CEO at the top, with those report directly below and so on. The goal of a vertical organizational chart is to present reporting relationships between employees.
Here’s an example vertical corporate structure chart for Apple. You can see it’s a very typical hierarchical chart with lots of layers of leadership.

Source: Business Research Methodology
It’s clear who reports to whom in upper-management at a glance. Large corporations like Apple also have unique roles such as the Environment, Policy and Social Initiatives executive, or the Apple University Dean.
Plotting these types of roles in a business organizational chart is essential as it indicates where these roles fall in terms of hierarchy, who they answer to and what their responsibilities are.
Another aspect of a vertical organizational chart are the organizational functions. This is often referred to as a functional organizational chart.
10. HubSpot functional marketing organizational structure example

Source: HubSpot
In a presentation by Hubspot on creating agile teams, they shared a breakdown of how their (powerhouse) marketing department is structured. The breakdown is by specific functions/objectives, channels and relevant metrics.
You’ll also notice that there is no clear reporting structure because the objective of this chart design is to highlight how the marketing team operates. This is what a functional organizational chart can look like within a department.
The functions are defined as teams and channels. Your own organizational chart design will probably look different since it depends on the types of channels your marketing team is divided into.
11. Divisional organizational chart example

Source: Point Park University
This divisional organizational chart is broken down into its separate business areas of focus.
This type of organizational structure applies to larger organizations with divisions that are geographical, product-focused, industry-focused, market-focused or anything along those lines.
You’ll see that each division has its own marketing team, sales team and services team and they operate independently of one another and have all the same functions.
12. Flat organization chart example

Flat organizational structures can share the same layout as vertical organizational structures, but there are fewer executive and managerial levels.
The horizontal organizational chart example above also uses a landscape orientation.
This helps to emphasize the lack of hierarchical tiers and the extended role of management. While it is just a design choice, it communicates how the organization is structured at a glance.
Valve, the popular video-game developer, is proud of the flat organizational structure they’ve built.
Here’s how they visualize their organizational structure in their employee handbook. They include a few quips as well.

Source: Valve Press
This is a fun way to understand Valve’s views on hierarchy, structure and collaboration. It’s clear there is a level of camaraderie and togetherness they aspire for.
It’s also a great example of presenting an organization’s brand and culture through documentation.
Rather than just a flat organizational structure with minimal hierarchy, Valve aspires for a completely collaborative organization with no hierarchy at all.
Within a horizontal organizational structure, managers will have a higher set of responsibilities and more direct reports than a typical manager.
This means a marketing manager may have designers, product people, support staff and others who don’t necessarily fall into “marketing” as reports, too.
13. Lean team organizational structure example

Source: Modern Marketing Partners
Github has a lean marketing organizational structure. The VP oversees many areas, but they are not layered with upper and middle management. Instead, the teams are small and collaborative.
It’s always helpful to mimic your organizational structure in the design of your organizational chart. Reduce the number of tiers and group teams together in the way that makes the most sense.
In Github’s lean marketing structure, you can see where responsibilities overlap, those teams share a color code.
These color palettes can carry over into project sprints and tasks that get tracked in applications like Trello and Asana! It’s a great way to maintain consistency in all your corporate communications.
A lean organizational structure is most suitable for startups or small businesses with limited resources where different roles are efficiently managed by a small, versatile team.
14. Matrix organizational chart example
The matrix organizational chart combines traditional organizational structures.

Source: ProjectManager
A matrix organizational chart ties in project planning needs by pairing project managers with interdisciplinary teams.
That means the chart needs to highlight departmental or functional managers and their direct reports, as well as project managers and their reports.
Here’s a detailed look at the layout and reporting structure of a matrix organizational chart:

There is a clear vertical functional structure with functional managers lining the top row.
But project managers work with employees from each function and so form a parallel column to the employees in each function.

In this layout, the tiny squares highlight which employee in each function reports to a project manager.

The simplest way to indicate reporting relationships here is through the use of arrows or lines and aligning the correct staff vertically with their managers and horizontally with their project managers.
The matrix organizational structure is necessary for large organizations that have multiple projects going on and need collaboration across departments.
t would be a cluster of super-circles representing departments or functions, with smaller groups of circles for specific areas.
15. Meet the team organizational chart example
If you’re welcoming a new member to the team, this team organizational chart can help you provide a clear visual of how the team is structured, highlighting each person’s role and responsibilities.

It can also show new hires who they’ll be working with directly, making it easier for them to understand reporting lines and build connections within the team from day one.
16. HR organizational chart example
Creating a People and Culture HR organizational chart is essential for providing clarity on the structure and responsibilities within the HR department.
This visual tool also makes it easier for team members to know who to approach for specific HR-related questions, improving communication and fostering a more organized and transparent workplace environment.

17. Leadership team organizational chart example
Designing a leadership organizational diagram can clearly outline the hierarchy and reporting structure within a company’s leadership team.
They help employees understand who holds key decision-making roles, making it easier to know who to contact for specific issues or approvals. These diagrams also offer transparency in leadership roles, reinforcing accountability and ensuring that everyone is aligned with the chain of command.

18. Basic hierarchy organizational chart example
A hierarchy chart diagram is useful for visually representing the levels of authority and relationships within an organization or department. It helps clarify the chain of command, making it easy to see who reports to whom and how different roles are connected.
This chart enhances communication, ensures that responsibilities are clearly defined and supports efficient decision-making by outlining the organization’s internal structure at a glance.

19. Flat media company organizational chart example
Here’s another example of a flat organizational structure for media and entertainment organizations. You can use this template to show the leadership structure of the company. This template can also be customized for lean teams where decision-making is distributed across various levels of the organization. Instead of decisions flowing from top management, employees at all levels are encouraged to contribute and innovate.

20. HR department organizational chart example
This template explains the hierarchy in the HR department of an organization. It uses distinct colors codes to differentiate between various levels or groups within the HR department, such as leadership, managers, and specialists.
You can use this template to show the organizational structure during employee onboarding sessions, company meetings, or while doing organizational planning.

Organizational chart examples from real companies
Nike’s org chart example
Nike’s organizational structure gets a lot of praise and it happens to be a matrix organizational structure.

Spotify’s organizational chart example: Tribes, squads and guilds
Spotify, the well-known audio-streaming service, is known for its unique tribe organizational structure.
Due to its growth and success, many startups have tried to adopt the same organizational structure, or some variation of it and make it work for them.
At a glance, it may seem strange and overly complex. But the organizational structure facilitates the communication and collaboration Spotify needed (and still needs) to grow quickly and reliably.
It starts with a tribe and its tribe leads.
They lead the squads that oversee different areas of the product. Across the squads, in each tribe, you have chapters that facilitate communication between the squads and chapter leads.

Of course, there are numerous tribes across the organization.
They work fairly independently of one another on a wide range of things that may or may not overlap.
As these individuals learn from new experiences, problems, outcomes and so on, they need to share information, tools, code and best practices.
These folks form guilds which include members across tribes. People can also belong to multiple guilds.
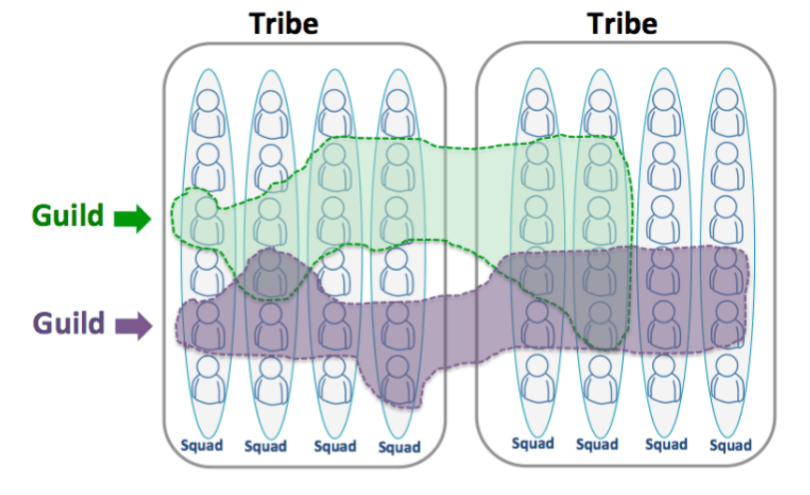
Spotify’s tribal organizational structure is meant to cut down on bureaucracy, which naturally builds as a company grows to hundreds or thousands of staff.
This way Spotify can still collaborate effectively as an organization, deliver projects sooner, implement changes faster, grow better and behave in a far more responsive manner.
You can also see from the way the organizational charts are arranged, there is an emphasis on fluidity within the structure, rather than rigidity.
Zappos organizational chart example: Holacratic organizational structure
Zappos is an online shoe and clothing retailer. They’re also known for having a unique culture and organizational structure.
They share insights on their approach to structure on Zappos Insights. This includes the fact that they are a holacracy.
A holacracy has a decentralized leadership, rather than one concentrated in an individual or handful of people.
It aims to distribute power typically reserved to executives across an organization to all employees.
It rejects the notion of hierarchy completely. The benefit is that it enables regular staffers to put forth ideas, collaborate with other employees and work with minimal restrictions.
Here’s an example of what a holacratic organizational chart looks like:

You can see right away there aren’t any lines, columns or rows like in the previous organizational chart examples.
Employees belong in a space that is shared, brought together in areas of specific functions and tasks.
Organizational chart best practices
A well-designed org chart is only useful if it’s accurate, readable and built for the people who will actually use it. Here are a few practices worth following:
- Keep it simple: One chart doesn’t need to show everything. Break large organizations into department-level charts if the company-wide view gets too complex.
- Use consistent formatting: Stick to the same box sizes, fonts and colors throughout. Inconsistency makes the chart harder to read and looks unfinished.
- Design for your audience: An internal HR chart can include photos, contact details and dotted-line relationships. A public-facing team page needs far less detail.
- Use dotted lines sparingly: Dotted-line relationships are useful for showing secondary reporting but too many of them make the chart confusing.
- Make updates easy: Store the chart somewhere the right people can access and edit it. If updating it requires going through three people, it won’t get updated.
- Create separate versions where needed: A company-wide chart and a department-level chart serve different purposes. Don’t try to make one chart do both jobs.
Common limitations of organizational charts
Org charts are useful but they don’t tell the whole story. A few things to keep in mind:
- They go out of date quickly: Every hire, exit or restructure is a reason to update the chart. Without a clear owner and update process, org charts become unreliable fast.
- They show formal reporting lines only: The chart won’t capture how work actually flows through the organization — informal relationships, influence and collaboration don’t show up in boxes and lines.
- They can oversimplify complex structures: Matrix organizations in particular are hard to represent accurately in a standard org chart format.
- They can miss cross-functional collaboration: Someone who works closely with three different teams every day may only appear under one of them on the chart.
- Large organizations may need multiple charts: A single chart for a 1000-person company is rarely useful. Breaking it into division or department-level charts is more practical.
FAQs on organizational chart types
1. What is meant by an organizational chart?
An organizational chart is a diagram that shows the structure of an organization. It maps out reporting relationships, job titles and departments so that anyone looking at it can understand how the organization is put together and who is responsible for what.
2. What are the four main types of organizational charts?
The four main types are hierarchical, flat, matrix and divisional. A hierarchical chart shows a clear top-down chain of command. A flat chart has few or no middle management layers. A matrix chart shows employees reporting to more than one manager. A divisional chart groups the structure by product, region or market.
3. What is the best organizational chart for a company?
There’s no single best type. The right chart depends on your company’s size, structure and how decisions get made. Hierarchical charts work well for large organizations with defined reporting lines. Flat charts suit small teams and startups. Matrix charts fit project-based organizations where people work across departments. Divisional charts work best for companies with multiple product lines or regions.
4. Can I create an organizational chart in Word or Excel?
Yes. Both Word and Excel have SmartArt and shape tools that let you build a basic org chart. They work for simple structures that don’t change often. For larger organizations or charts that need regular updates, a dedicated org chart tool is more practical. Venngage has a library of org chart templates you can customize and update without rebuilding from scratch.
5. What should an organizational chart include?
A good org chart should include employee names, job titles, departments and reporting lines. Depending on the audience, you may also want to add dotted-line relationships for secondary reporting, levels of authority and contact details or photos for internal-facing charts.