
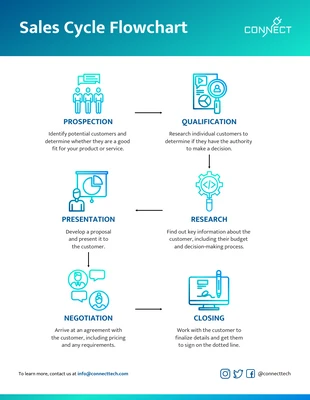
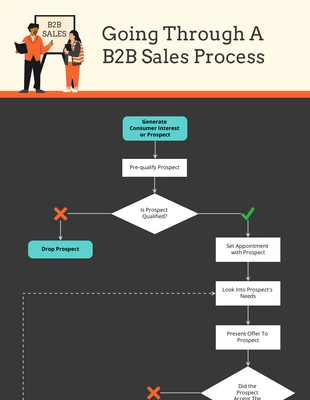
Sales Cycle Flowchart
Ensure that all necessary steps are being taken in managing sales opportunities and strategies with a sales cycle flowchart.

 100% customizable templates
 Millions of photos, icons, charts and graphics
 AI-powered editing features
 Effortlessly share, download, embed and publish
 Easily generate QR codes for your designs
- Design stylemodern, fun
- Colorslight, vibrant
- SizeLetter (11 x 8.5 in)
- File typePNG, PDF, PowerPoint
- Planpremium
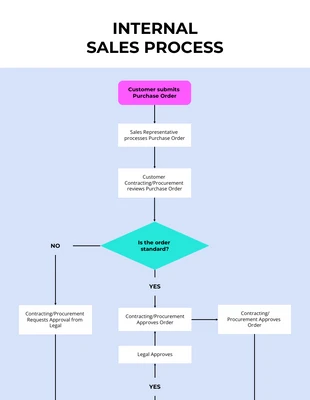
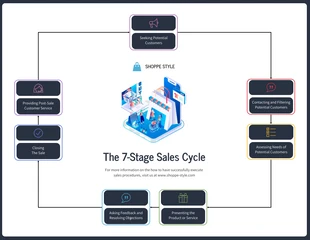
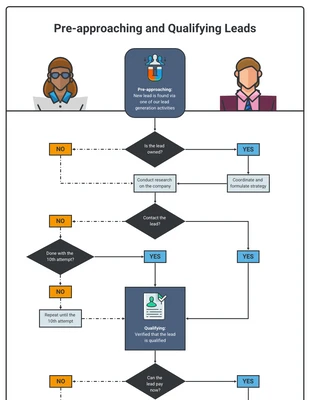
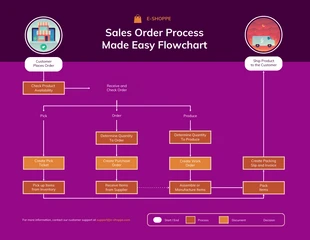
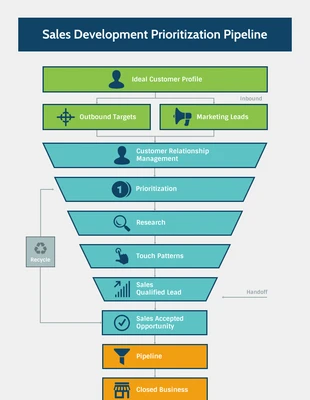
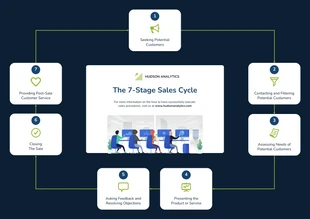
A sales cycle flowchart is a graphical representation of the steps involved in a typical sales process. It can be used to track and manage the progress of sales opportunities and to ensure that all necessary steps are being taken in each case. The chart typically starts with the initial contact with a potential customer and then tracks the subsequent actions taken by the salesperson through to closing the deal. It is a valuable tool for managing sales opportunities, as it provides a clear overview of the entire process. It can help to identify bottlenecks and potential problems, and also be used to develop strategies for improving the efficiency of the sales process. In addition, the sales cycle flowchart can be useful for training. It helps new salespeople understand the steps involved in a typical sale. It is typically divided into a number of stages, each representing a different point in the process. A sales cycle flowchart is a diagram that shows the various steps in a sales cycle, from initial contact with a potential customer to closing the sale. It
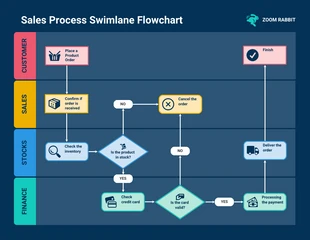
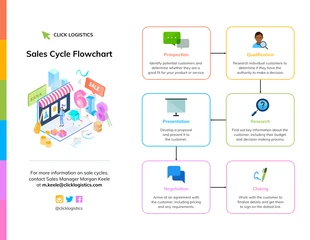
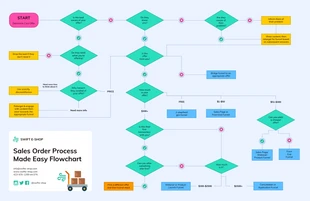
Related Diagram Templates
flowchart diagrams
flowchart diagrams
flowchart diagrams
flowchart diagrams
flowchart diagrams
flowchart diagrams
flowchart diagrams
flowchart diagrams
flowchart diagrams

flowchart diagrams
flowchart diagrams
flowchart diagrams