


A diagram is a visual representation of systems, structures, and relationships between things. Some diagram types are referred to as “map” or “chart” or “graph” but fall under the diagram category. For example, mind maps, flowcharts and organizational charts.
You’ve likely used bar graphs and pie charts for numeric data, but what about visualizing complex, non-numeric topics or patterns? These require specific diagrams to present information.
Want to visualize your qualitative data using diagrams? Get started with Venngage Diagram Maker and our smart diagram templates. Smart diagram templates automate the diagramming process, making you your most productive. Absolutely no design experience required.
Table of contents:
- 12 types of diagrams and when to use them
- 6 Quick diagram design tips
- How to choose the right diagram for your needs?
- FAQs
12 types of diagrams and when to use them
When thinking about which diagram is right for you, always start by first considering what is important to your audience. This decision can be based on the information you are working with and/or the important ideas you want to convey.
Let’s take a closer look at each diagram type and its use cases:
- Mind map
- Circle diagram
- Tree diagram or dendrogram
- Flowchart, feedback loop and decision tree
- Matrix or quadrant chart
- Funnel chart and journey map
- SWOT analysis diagram
- Venn diagram
- Fishbone diagram
- Organizational chart
- Pyramid or triangle chart
- Roadmap and Gantt chart
1. Mind map
You are probably already familiar with mind maps. Usually there is one central idea with various branches to supporting ideas, known as nodes.
You can use a mind map to visualize information such as:
- A main topic with nodes describing subtopics or themes
- A main question with nodes describing avenues of exploration
- A project with nodes describing different components or teams
- A network of people with nodes describing the people and branches describing relationships (this is known as a network map)


There are hundreds of mind map templates available in the Venngage templates library. Every template is created by in-house professional graphic designers, for non-designers. Plus, Venngage Mind Map Maker has sleek mind mapping features that help you stay productive and collaborate seamlessly.
As you add more shapes to your mind map, things can look a little unorganized. Venngage Mind Map Maker ensures that all your shapes realign automatically. Plus, you can quickly copy and paste the styling of one shape to others with a click as well.
For more mind map templates and examples, check out:
- 40+ Mind Map Examples to Help You Visualize Ideas
- 15+ Mind Map Examples to Organize Your Team and Inspire New Ideas
- 10+ Site Map Templates and Examples to Visualize Your Website
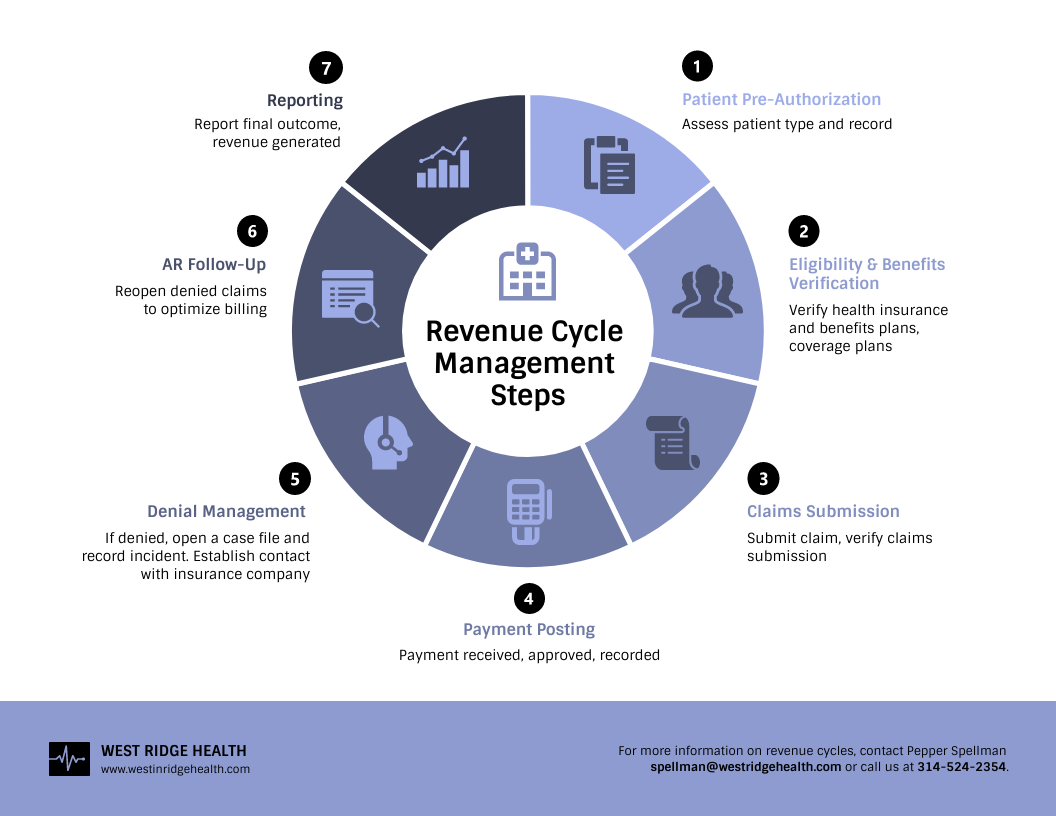
2. Circle diagram
A circle diagram is a great way to present topics as parts contained within a whole. There are two primary ways to do this.
The first is to use concentric circles, each of which is inside another. This could be useful for visualizing hierarchy or order of some kind, for example people in a neighborhood, in a city, in a state, in a nation, etc.
You can also arrange themes around the edge of a circle. This can be an effective way to visualize parts in a way that emphasizes them equally. For example, you could describe aspects of a topic or system.


3. Tree diagram or dendrogram
Like mind maps, tree diagrams are composed of nodes and branches, but what makes them different is that the nodes are ranked or hierarchical. By arranging information this way, your audience will be able to better see and understand categories within categories.
Tree diagrams, also known as dendrograms, are often presented with a parent node at the top and child nodes beneath or a parent node to the left and child nodes to the right. They can be simple or complex, depending on the information.
You can use a tree diagram to visualize topics like:
- Company roles and reports — known as an organizational chart
- Family and/or genetic relationships — known as a genogram
- Evolutionary relationships — known as a phylogenetic tree


Related:
- Editable Genogram Templates & Why They Are Important for Documenting Family Info
- 10+ Genogram Examples (and How to Create Them)
4. Flowchart, feedback loop and decision tree
A flowchart is a diagram that visualizes a process or workflow, often one that has multiple turning points or paths. Typically, you use boxes or shapes to represent different steps in a process or data flow, and then you connect those steps with lines or arrows.
Here are examples of flow charts for problem-solving.


With Venngage, building flowcharts is quick and easy. When you customize a template, you can just click to expand a section and add new lines and shapes. The rest of the diagram auto-adjusts as you go, streamlining your workflow. Also, you can copy and paste the style of one shape to others with a click as well.
If you are visualizing a circular flow, which can also be referred to as a feedback loop, you will want to make sure the “starting point” is either in the top left corner or where the “12” is on a clock.

If you are showing decisions and their possible consequences, this is a diagram known as a decision tree. Variations of decision tree diagrams include swimlane diagrams, SIPOC diagrams, etc.


Because flowcharts are incredibly flexible and widely understood, they’re the gold standard when it comes to communicating processes with multiple paths. They can be easily customized to fit the level of detail you need for any process, such as the people responsible for a given subset of tasks, or the time a set of tasks might take. With Venngage AI, you can explore intelligent flowchart creation to see your ideas take shape instantly. Much like the generative features in Miro, the ai powered flowchart maker uses prompt-based intelligence to turn your rough process notes into a polished, professional diagram that is ready for any report.
Flowcharts can get pretty complicated, so here are some tips for making sure they are still clear and useful:
- Limit the number of points, flows, and text to make it easier to read
- Use arrows to guide those reading the chart
- Use color and/or icons to differentiate between paths and/or emphasize important decision points
- If there are parallel stages or decisions, position them to level with one another
For more flowchart templates and examples, check out these blog posts:
- 20+ Flow Chart Templates, Design Tips and Examples
- 21+ Flowchart Examples to Organize Projects and Improve Processes
- 15+ Decision Tree Infographics to Visualize Problems and Make Better Decisions
- 10+ Site Map Templates and Examples to Visualize Your Website
- 12 Swimlane Diagram Examples with Templates
5. Matrix or quadrant chart
This type of smart diagram displays information along two axes, but that doesn’t mean the information needs to be quantifiable. You can use two descriptions, one for each axis, to essentially break a list into four categories.
This chart is ideal to use if you want to not only categorize but also rank items, as those that appear higher on the axes (in the upper right quadrant) will connote more significance.
You can use a quadrant, for example, to describe:
- Internal and external factors in business strategy—SWOT and PEST are two common examples
- Project priorities based on potential effort/cost and impact/value
- Work plans based on what’s urgent and what’s important (this is known as the Eisenhower Decision Matrix)
- Competitive landscapes—for example, the Gartner Magic Quadrant compares companies’ completeness of vision and ability to execute


For more matrix and quadrant chart examples, visit our post on the 20+ SWOT templates, examples and best practices.
6. Funnel chart and journey map
Sometimes, you’ll need to describe discrete stages of a plan or process, at a high level. For example, you might outline a strategy that will unfold over time, or tell a story about events that take place in a before and after fashion.
One option is to use a funnel chart. It is a process diagram in the form of an inverted funnel, that describes discrete stages that progress toward a specific outcome.
Funnel charts are good for facilitating a very basic understanding of stages. They are often used in a marketing and/or sales context to show how a large market becomes a smaller group of leads and ultimately a set of customers.


If you want to add more detail to a process, then a journey map is a great option. A journey map also shows stages, usually also toward specific outcomes, and it can include varying levels of detail to describe the stages as well as the experiences people have at each stage.


7. SWOT analysis diagram
You use SWOT analysis diagrams to evaluate your organization’s internal strengths and weaknesses, along with external opportunities and threats to your organization’s performance. After conducting a SWOT analysis, you have a better picture of how you compare to the competition, and how to differentiate yourself.
SWOT diagrams tend to follow a very simple structure, like these SWOT diagram templates:


8. Venn diagram
Venn diagrams look like two or more overlapping circles, with text in each section of each circle that describes the categories. With these diagrams, you can quickly communicate differences and similarities between items when there is no inherent rank to them.
Although they were invented for mathematical logic, they are incredibly flexible for conveying any kind of relationship. You can use them to compare characteristics of products, services, companies, markets or other patterns.


9. Fishbone diagram
As you can see, there are many ways to use a diagram to communicate about changes over time. If you want to focus on identifying causes and effects, a fishbone diagram is for you.
A fishbone diagram (also known as an Ishikawa diagram) looks like, you guessed it, a fish skeleton. Lines that extend from a main one in the middle describe different factors that lead to a specific outcome. They are usually used for root cause analysis.


10. Hierarchy or organizational chart
Briefly mentioned before, an organizational chart is a diagram that represents the hierarchical structure of a company. It shows how teams and departments are organized, the reporting relationships across the organization, and every individual’s role and responsibilities.
There are four main organizational chart types: vertical, horizontal, matrix and creative. Venngage has organizational chart examples and templates for conventional and non-conventional structures too.


11. Pyramid or triangle chart
A pyramid or triangle chart also shows parts of a whole in a ranked or hierarchical way, but is much simpler than a tree diagram. This chart is best to use when you want to emphasize a natural order, usually of size or importance, to the topics.
These charts are often used to communicate that there are building blocks of some kind. Two common examples are food pyramids and Maslov’s hierarchy of needs.


12. Roadmap and Gantt chart
While funnel charts and journey maps outline stages, they are usually pretty conceptual. If you are looking to use a diagram to plan a project, you will likely want to use a diagram that is more practical and allows for more specificity.
Roadmaps are similar to journey maps in that they outline stages, but usually they are used for internal planning so they include things like benchmarks and time frames.


Gantt charts are even more specific, and they often shift the focus to the teams and/or individuals who are responsible for executing the plans. They can be very detailed, drilling down on dependencies, deadlines and dates.


6 Quick diagram design tips
Here are some quick tips to help you design diagrams that are effective and compelling.
1. Organize the information logically
Bear in mind that people read left to right and top to bottom, so your organization should either flow in this fashion or be arranged in a circle/radially. Pay attention to how you arrange ideas, as this is what makes diagrams meaningful in the first place!
See how the text in these templates are organized in a logical manner so it’s easy to spot the main information at a glance:


2. Keep it consistent.
This applies to the shapes, lines, icons, and colors you use. Consistency makes visuals easier to read and it makes them look so much better too!
Here are some examples of diagram templates where the colors coordinate with each other to make the information easy to grasp:


3. Use color to add meaning
You can use different colors to contrast different themes, stages, or teams, for example. Good use of color should help a reader get the big idea at a glance before they drill down into reading all the text.


4. Label well
Use larger text to label categories, parts, flows, etc. In general, it’s better to include labels within the visual, rather than using an adjacent legend. Be sure to use words or short phrases your audience will understand and avoid clunky jargon.


5. Minimize clutter as much as possible
Consider removing what’s obvious or unnecessary, and make sure you don’t have visual elements (text, shapes, lines, etc.) that are overlapping one another. Try to limit the amount of text you include.
If you find this to be challenging, you may need to make your diagram or graphic larger, reformat it to read vertically instead of horizontally, or even split it apart into separate visuals.


6. Ask others for feedback
When your diagram is ready for sharing, don’t forget to ask others what they think so you can improve your visual communication skills.
How to choose the right diagram for your needs?
There are a wide variety of diagrams you can choose from, depending on what you hope to describe. Let’s see how you can choose the right diagram based on your needs.
- Identify the purpose of the diagram: Think what is the goal of your diagram. If you want to show your company’s reporting structure, choose an organizational chart. For showing the user journey, a customer journey map or flowchart can work better.
- Consider the audience: Who is your target audience? If it’s the senior leadership team, they need diagrams to support quick decision-making, such as SWOT analysis diagrams.
- Analyze the data: Focus on the type of data that you want to present and what’s the best way to visualize it. For instance, if you have data with sequential steps or a process flow (e.g., illustrating how orders are processed), a flowchart is a good option. But, if you want to show connections and relationships between concepts or data sets (e.g., displaying customer segmentation), a Venn Diagram or Mind Map will be more suitable.
- Consider the use case: Where are you going to use the diagram? If it’s for a report, pie charts or line graphs work better. However, if you want to explain information in an blog post or presentations, you can use venn diagrams.
Here’s a quick summary of the types of diagrams that you can use and how you can use each of them, created using a Venngage smart diagram template:

FAQs
What are the five diagrams?
There are countless diagram types out there. But there are five diagrams everyone should be familiar with because of how versatile and applicable they are. Of the diagram types this post covered, mind maps, flowcharts, fishbone diagrams, hierarchy/organizational charts, and SWOT analysis diagrams are the most common diagram types. Regardless of work you’re involved in, these diagram types can help you in a number of ways.
How can I make a diagram?
You can create diagrams for free online with Venngage’s Diagram Maker. Just sign up for a Venngage account, choose a template that you want to customize, and edit it in our online editor. You can share your completed diagram using a private link or download as a PNG or PDF.
What is the most commonly used diagram?
Flowcharts are one of the most commonly used diagrams. You can use them to explain processes, visualize decisions, and show the flow of a project.
How do I choose the best diagram for my project?
To choose the best diagram for your project, focus on the purpose. For example, if you want to show the project timeline, go with a Gantt chart.
What are the differences between a flowchart and a mind map?
A flowchart is linear and sequential diagram to represent a process or workflow with clear start and end points. It uses standardized symbols (e.g., rectangles for tasks, diamonds for decisions) to map out steps, decisions, and actions in a defined order.
On the other hand, a mind map is non-linear diagram, frequently used to brainstorm or organize ideas around a central concept. It visually represents ideas branching out from the central topic in a web-like structure to show how various subtopics or thoughts are connected.
Master data communication with the right diagrams
When you visualize information, you make it easier for others to understand and remember that information. Diagrams make it easier to organize and share even highly complex information.
There are plenty of types of diagrams to choose from. By knowing which is best for which type of information, you can use the one that is right for you and your audience.
Creating diagrams can be fun, and it takes practice to make ones that are effective. The more you make, the better they get, so try making a new one today with Venngage’s diagram maker!


