


Making business presentations engaging using Google Slides isn’t easy. You’ve got limited creative options which is a tad annoying if your goal is to put together an engaging deck.
But Slides is easy to use and it does offer some flexibility, like the ability to add Venn diagrams to presentations.
Venn diagrams are a great way to give presentations that extra oomph. They’re also the perfect format to share complex data instead of those sleep-inducing bullet points.
In this post, I’ll show you how to make a Venn diagram in Google Slides and then reveal a better method using a Venn Diagram Maker and Venn Diagram templates.
Click to jump ahead:
- What is a Venn diagram?
- History of Venn diagrams
- Components of a Venn diagram
- How to create a Venn diagram in Google Slides
- How to create a Venn diagrams in Venngage
- Conclusion
- FAQ
What is a Venn diagram?
A Venn diagram is a diagram that uses overlapping circles to illustrate relationships, if any, between items or data sets.
Here’s an example of a Venn diagram:

In this Venn diagram, the left circle presents a pain point of sales managers, and the right circle a solution.
And the area where the circles overlap shows how the solution can resolve some pain points of sales managers.
The history of Venn diagrams
Venn diagrams were created in 1880 by Britisher John Venn who demonstrated their use case in an article called On the Diagrammatic and Mechanical Representation of Propositions and Reasonings.
Venn developed these diagrams to find a better way to showcase all possible relationships between data.
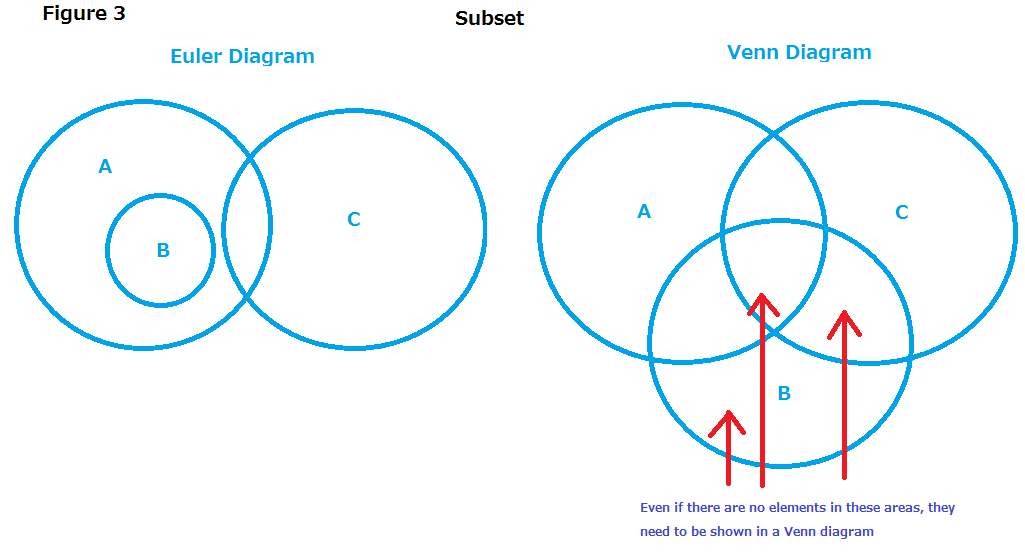
They provided an alternative to Euler diagrams which could not represent all possible overlaps.
Initially, Venn diagrams were mostly used in professional settings.
But in 1918, American philosopher Clarence Irving Lewis gave them a new lease on life when he shared their practical applications in a book.
Here’s an example of a practical application of a Venn diagram.
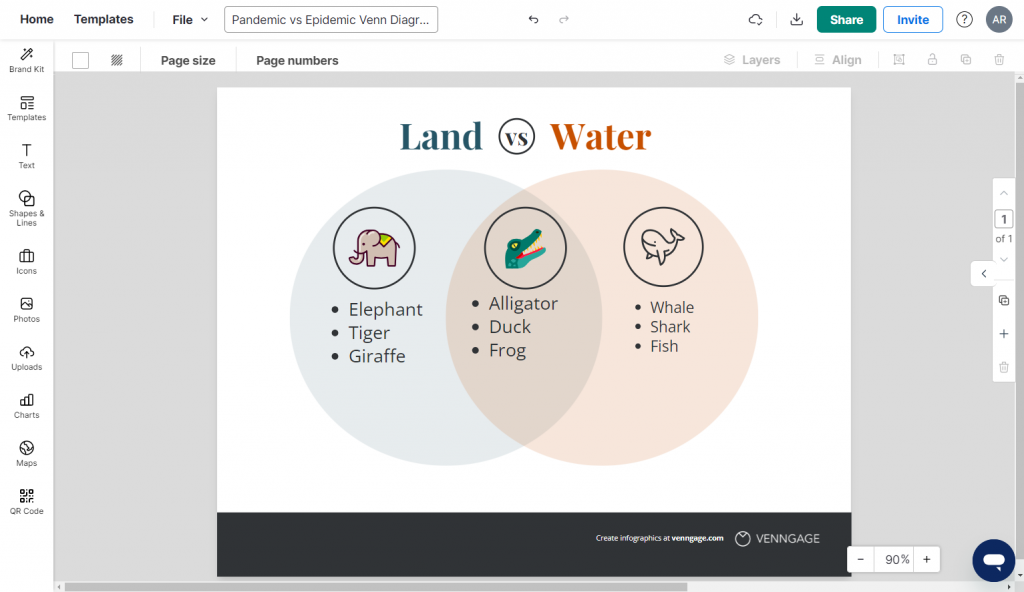
Imagine there are two groups of animals: one group can fly and one lives in water. But some animals, like ducks, can actually fit in both groups because they can fly and live in water.
How do you visualize this overlap? You draw a Venn diagram with two circles with an overlap representing animals that can do both, like the duck.
Here’s how it might look:
Over time, Venn diagrams have become popular tools not only in statistics, but also in fields like computer science, and education.
Components of a Venn diagram
A Venn diagram is made of various components and understanding each will help you make better diagrams.
Note: I wrote a post on Venn diagram symbols and notation where I go over each element of a Venn diagram in-depth. Do check it out!
Here’s an overview of Venn diagram components:
- Union
- Set
- Intersection
- Symmetric difference
- Relative complement
- Absolute complement
- Universal set
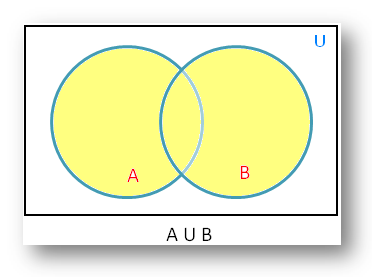
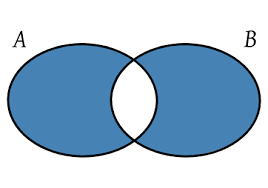
Union
A union in a Venn diagram refers to the combination of all elements.
Set
A Venn diagram set refers to each distinct element or data point in the diagram.
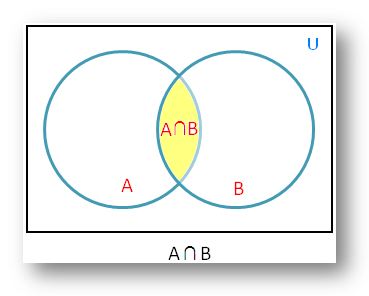
Intersection
The intersection refers to the area that two or more sets have in common.
Symmetric difference
The symmetric difference is data or information present in both sets, but not in their intersection.
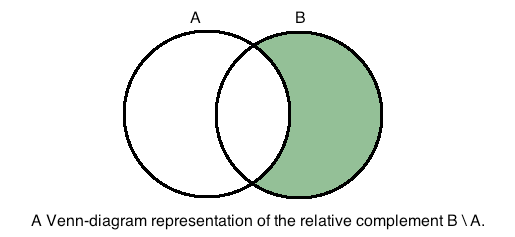
Relative complement
The set of elements in one set that are not in another set.
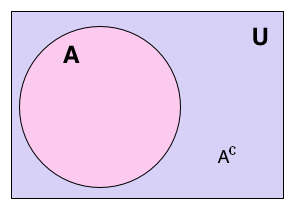
Absolute complement
The set of all elements not in the given set, relative to a universal set.
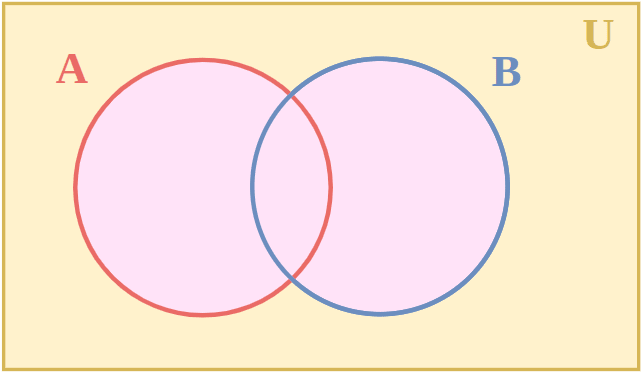
Universal set
The set that contains all possible elements under consideration, from which subsets are formed.
To give you a clearer idea, let’s look at some sample diagrams:
How to create a Venn diagram in Google Slides
To create a Venn diagram in Google Slides, you can either use Slides’ in-built Shape tool or the Diagram option.
- Create a Venn diagram using Shapes (manual)
- Use the Diagram option (automatic)
I’ll explain each method in detail below, but here’s an overview.
To create a Venn diagram in Google Slides with the Shapes tool, follow these steps:
- Open a blank Google Slides presentation
- Select “Insert” > “Shape” tool and choose “Ovals”
- Draw two overlapping circles
- Adjust transparency to create overlap
- Add text boxes by clicking “Insert” > “Text Box” to label sets and any intersections
To create a Venn diagram in Google Slides with the Diagram option, follow these steps:
- Open a Google Slides document
- Select “Insert” > “Diagram” tool
- Select the Relationship category
- Choose the option for a Venn diagram
- Select the “Areas” drop-down menu to indicate how many circles you want
How to insert Venn diagrams in Google Slides using the Shape tool
If you choose this option, you’ll have to create a Venn diagram from scratch manually.
Step 1 – Open a Google Slides presentation
This step is pretty straightforward. Browse to Google Slides and click on “Blank Presentation” to create a new workspace.
Step 2 – Draw two circles from the shapes menu
To recreate a basic Venn diagram, I’ll first draw two circles.
To do that, click on “Insert” > “Shape” > “Oval.”
For instance, one circle could represent “marketing strategies” and another “customer engagement channels” and the overlap between these circles shows strategies that engage customers.
Drag your mouse over the blank space to create a circle, and copy paste it to create another one.
I recommend copy pasting so that your second circle is identical in shape and size (though you can draw it manually again if you wish).
Tip: When drawing a circle, hold down the Shift key so you create a perfect circle.
Step 3 – Add transparency to create overlap
Our Venn diagram almost looks ready, but it’s still missing an overlapping area.
To fix that, click on the “Fill Color” option in the toolbar menu and click “Transparency”.
If you want more control over transparency, you can adjust it manually by accessing the Transparency slider by clicking the “+” button under “Custom”.
Step 4 – Add your text
The last step is to add text to your Venn diagram.
This is pretty simple. Click on the “Text Box” symbol in the toolbar and drag it over the area you want to insert your text.
Google Slides gives you some customization options like changing the font style and color.
If you want to add icons and images, you’ll have to import it into Slides first and then make it fit into your Venn diagram. This can be quite challenging and usually isn’t worth the effort.
How to create Venn diagrams in Google Slides using diagrams
If you feel making Venn diagrams manually in Google Slides is time-consuming or challenging, you can use the Diagram option.
This allows you to insert a Venn diagram template from Slides.
Step 1 – Select relationship diagram option from the Insert menu
If you’re short on time or just lazy, this method will save you a TON of time.
To insert a Venn diagram template, click on “Insert” > “Diagram” and choose Relationship. A sidebar will appear with several options.
The real value here is that Google Slide lets you choose how many circles (two, three, our four) you want and the preferred color.
Step 2 – Customize your Venn diagram
Again, you’ll probably want to customize your Venn diagram to make it look better for audience engagement.
The first step is to add some transparency to make the overlapping areas visible.
Other options you can consider include changing border appearance, font style, font color, and more.
If you haven’t noticed, a Google Slides Venn diagram is pretty dull and boring. Let’s see a better way to make more engaging Venn diagrams instead.
How to create a Venn diagram in Venngage
If you like generic Venn diagrams in presentations or making them the hard way (ie; manually!). Google Slides isn’t a bad option.
But if you want Venn diagrams that make your presentations stand out and a way to create fast, Venngage’s venn diagram templates are for you.
Note: Some of our Venn diagram templates are free to use and some require a small monthly fee. Sign-up is always free, as is access to Venngage’s online drag-and-drop editor.
Venngage is a great platform to use when you don’t have time to create something from scratch. The best part? You don’t need to be a design expert to use it either.
To make a Venn diagram in Venngage, here’s what you need to do:
Step 1 – Sign up for a free account
Sign up for a Venngage account using your email, Gmail or Facebook account.

Step 2 – Browse our library of Venn diagram templates
Venngage has tens of thousands of templates, including Venn diagram templates for you to edit.
To find them, head to the “Diagram” category on our templates page and then select the “Venn Diagram” subcategory.
Step 3 – Customize a Venn diagram template in minutes
Our pre-built Venn diagrams can be customized so they look unique. Our drag-and-drop editor tool makes it easy to replace labels and text with your own topics, information, or concepts.
You can also customize the colors, fonts, icons, and other elements to make the design unique.
You’ll also get access to our in-editor library of thousands of free, professional icons, plus diverse icons so you can create Venn diagrams like this one.

It already has a color scheme and graphics for you. Don’t like the original graphics? Let’s see how easy it is to replace items in the template.
Or maybe you don’t like the background color? Again, it’s easy and intuitive to change in just a few clicks!
Here are some other templates you can edit.
This Venn diagram is perfect to educate on the similarities and differences of Type 1 and Type 2 diabetes. It’ll work great as a presentation slide.
But it can also double as an infographic!
(Hint: You can create infographics featuring Venn diagrams in Venngage too!).

This Venn diagram illustrate the ideological overlaps and distinctions between Republicans, Democrats, and Libertarians in the context of American politics.

This Venn diagram presents three different ways to enjoy durian fruit as dessert options.
In the center where all three circles overlap, we’re reminded durian tastes great and that all three dessert options share this characteristic.

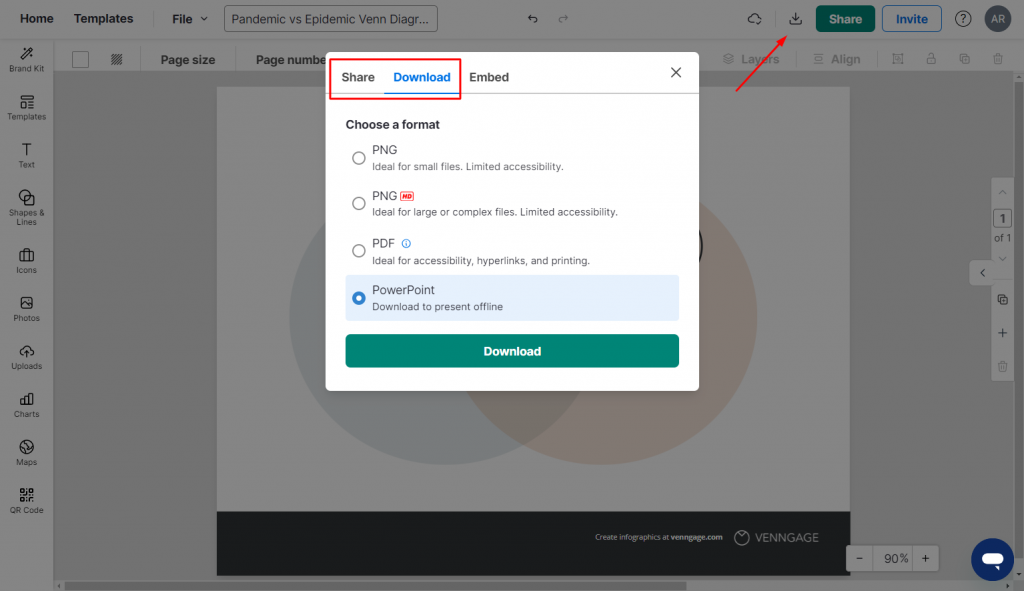
Step 4 – Share a link to your Venn diagram or download
Once you’ve finalized a Venn diagram design, you have a few sharing options.
If you’re a free user, you’ll get access to a shareable link that you can embed in presentations. But if you want to download your Venn diagram, upgrade to a Business plan.
Our Venn diagrams fit seamlessly into Google Slides and PowerPoint presentations.
In fact, Venngage even lets you download a Venn Diagram in a PPT format (as well as PDF and PNG).
Conclusion: Making engaging Venn diagrams is faster and easier with Venngage
If you want a slide that draws the audience in, use Venngage to create a visually appealing Venn diagram.
Our Venn diagram templates and editor tool are easy to use and will help you create Venn diagrams that are impressive in minutes. What are you waiting for?
Frequently asked questions
What is the overlapping region of the Venn diagram called?
The overlapping region of a Venn diagram where two or more sets intersect is called the “intersection.” This area represents elements that are common to the sets that overlap and is a way of understanding how different groups or categories share certain attributes or elements.
How do you make a Venn diagram overlapping in Google Slides?
To make a Venn diagram overlap in Google Slides, you need to adjust the transparency of both circles using the Fill color option to highlight the overlaps. Here’s how to do it: click the “Fill Color” option in the top toolbar and select “Transparency”.
What is a 3 way Venn diagram called?
A 3 way Venn diagram is also called a triple Venn diagram. A triple Venn diagram is useful when you want to compare three categories. Similar to a normal Venn diagram, each circle in a triple Venn diagram represents a different category, however, this version includes multiple overlapping regions with each representing items shared between the three categories.
What is a 4 circle Venn diagram called?
A 4 circle Venn diagram is referred to as a four circle Venn diagram. The four-circle Venn diagram introduces a more complicated structure to accommodate the representation of all possible intersections among four sets.


