


Poor planning and missed deadlines are the common reasons for project failure. Without a clear overview, team members work in silos, unaware of how their tasks align with the bigger picture. This is where you need to make a Gantt chart.
A Gantt chart lets you communicate your project timeline visually in an easy-to-understand way. Everyone’s in the loop, so you can get work done faster and easier.
Want to see Gantt chart examples, plus get tips on how to create professional Gantt charts that are professional, attractive and simple to understand?
Stick around or check out our Gantt chart templates to start customizing right away.
What is a Gantt chart?
A Gantt chart is a horizontal bar chart for project management. Multiple bars are stacked against each other, each representing project activities, timelines and overall task progress.
The top of the chart shows the time frame and the left side of the chart lists the project activities.
It helps visualize the project schedule and provides a detailed overview of when each task needs to be completed.
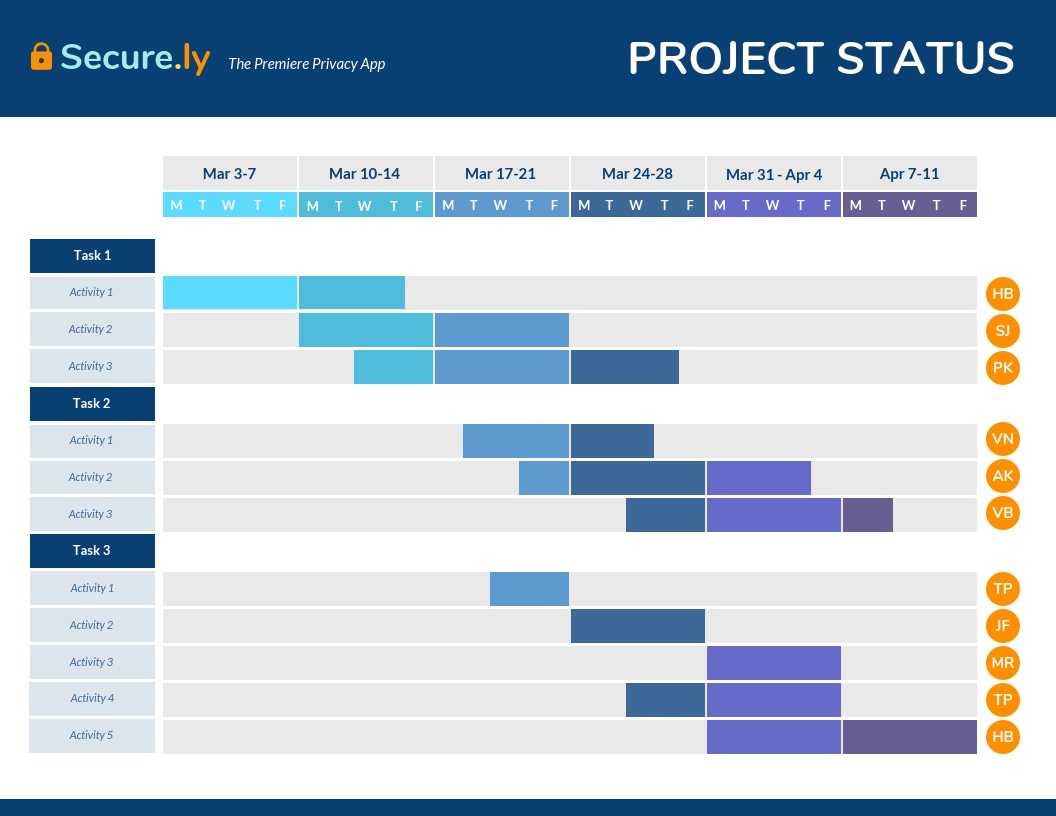
Each project activity is listed on the left-hand side of a Gantt chart and has a colored bar next to it.
The position and length of that bar depends on the activity’s timeline and duration: when it starts and when it ends.
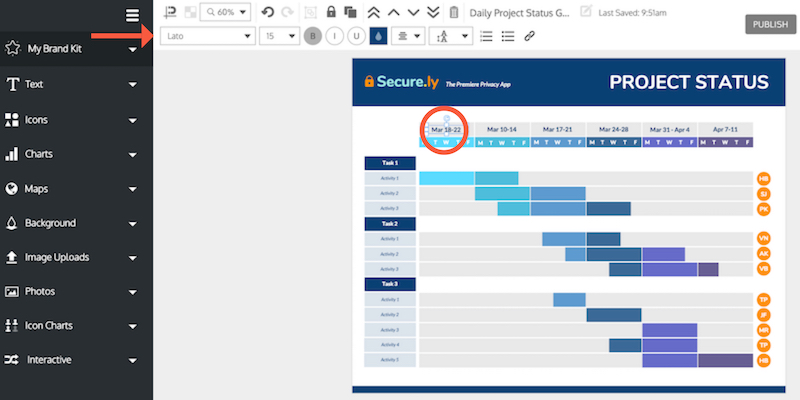
For example, in the daily project status Gantt chart above, Activity 1 (Task 1) will take place from March 3 to 7 and then from March 10 to 13. The due date is Thursday of that week. Each week is color coded.
In short, a Gantt chart shows:
- What tasks need to be done to complete the project.
- When these tasks need to be done.
Why use a Gantt chart?
Projects management plans often involve multiple stakeholders, activities and deadlines. Gantt charts visualize all these factors so that project managers and their teams can quickly understand who needs to do what and when.
When used within custom project management software, these charts become even more powerful — tailored to your workflows, integrated with your existing tools, and adaptable to the unique needs of your team.
This ensures each deliverable is completed on time.
The benefits of a Gantt chart include:
- Scheduling and planning projects and tasks
- Plan work in sprints
- Visualizing how projects and tasks evolve over time
- Collaborate with your team
- Comparing planned versus actual timelines
Related: What is a Pert Chart and How Make One? [Examples & Templates]
11 Gantt chart examples for different use cases
Now that you know what a Gantt chart is, let’s look at a few examples to better understand its usability and versatility.
- Gantt charts for project management
- Gantt charts for construction
- Gantt chart example for project proposals
- Gantt chart example for business plans
- Gantt chart example for consultants
- Gantt chart example for manufacturing
- Gantt chart example for medical research
- Gantt chart example for housing project
- Gantt chart example for website project
- Gantt chart example for event marketing
- Gantt chart example for movie production
1. Gantt charts for project management
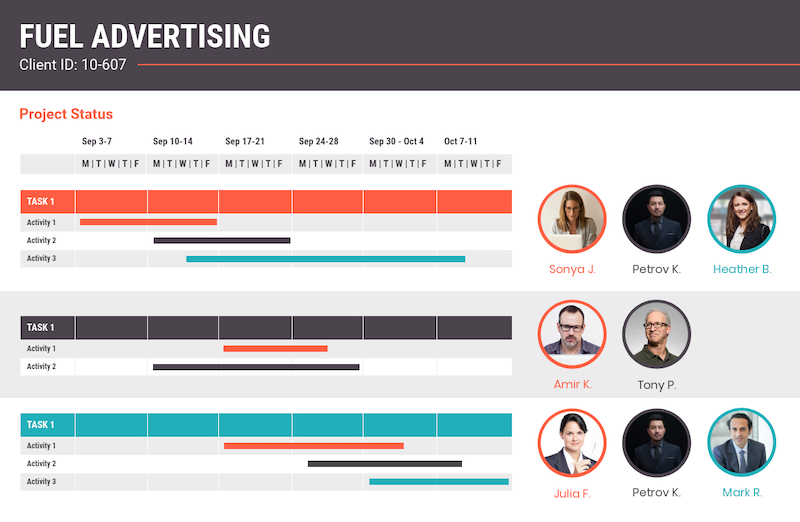
This retro daily project Gantt chart example breaks down project activities day by day and tells who’s responsible for what activity.
- For example, Task 1/Activity 1 is color coded red.
- Sonya J. is responsible for it from September 3 to 14 (two weeks).
- Amir K. is responsible for it from September 17 to 21 (one week).
Julia F. is in charge of Task 1/Activity 1 from September 17 to October 2. Her red bar shows that the due date is Wednesday.
The magic of a Gantt chart is that it lets you set the order in which tasks should be completed.
And since Gantt charts are in an easy-to-understand timeline format, the task order is crystal clear.
This template would work especially well for consultants, as the client can get a visual representation of the team working on their project.
Putting faces to the names creates confidence in the client and helps build your reputation.
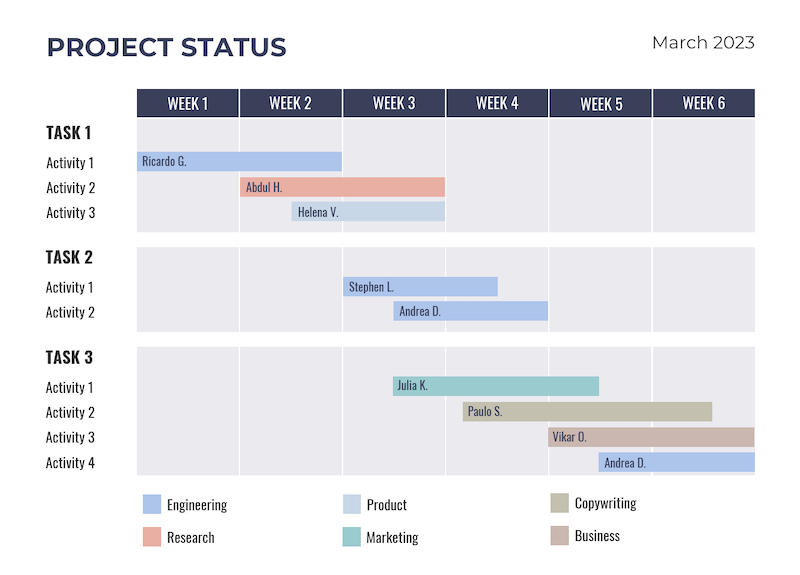
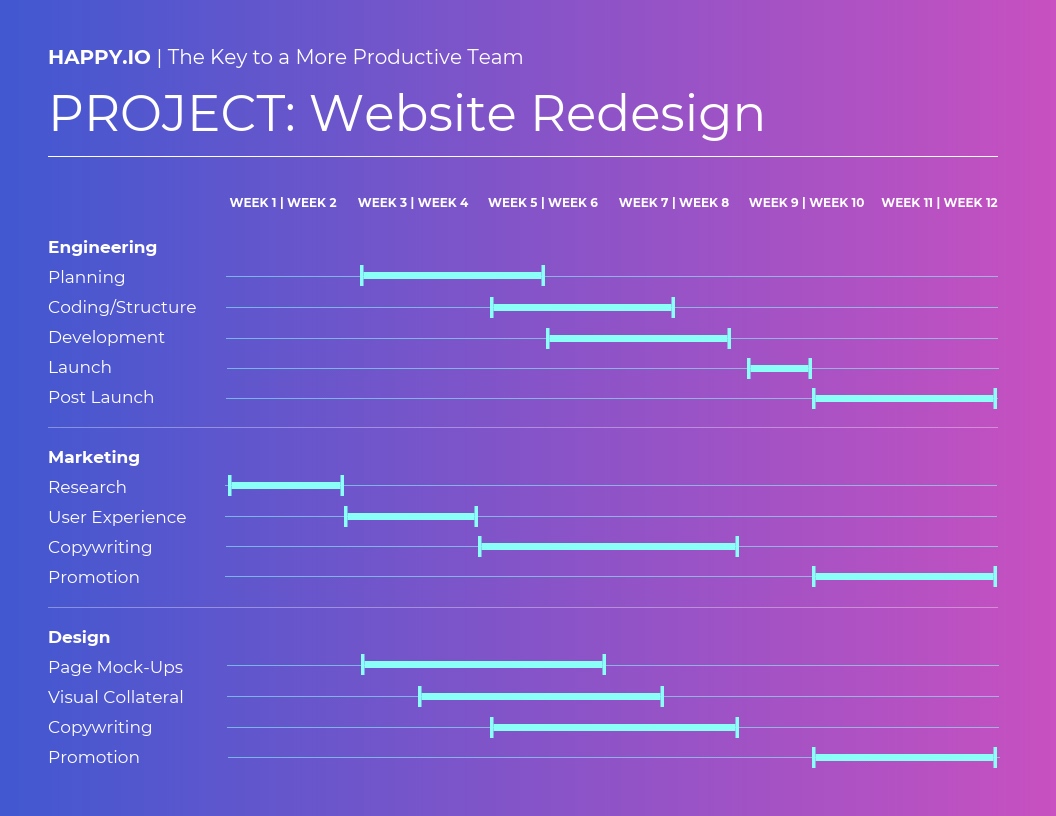
This corporate weekly project Gantt chart example is more traditional than the previous example. The focus is on the activities and their types, not the individual people.
The types of activities, such as engineering or marketing, are color coded.
- For example, Task 3/Activity 1 is a marketing activity that will take place from the middle of week 3 to the middle of week 5. Julia K. is responsible for this activity.
This futuristic-looking Gantt chart example is perfect for teams who operate on the sprint system.
The template is divided into two-week sprints, but you can change this to a one week sprint (or longer) as needed.
The left hand side is divided by team and further divided by activity. For example, the engineering team will do planning from the beginning of week 3 to the end of week 5.
The timelines often require stakeholder approval before work begins. You can leverage Venngage AI to draft a comprehensive project bid from your timeline data with zero manual formatting. Similar to the smart integrations in Asana, our AI proposal automation tool allow you to architect a professional offer that aligns your project schedule with a persuasive business case.
Pro Tip: Add your Gantt chart to your weekly team meeting presentation. Consultants can add them to their proposals or work plan templates or integrate them into their project management tool.
2. Gantt charts for construction
Gantt charts are a great way to keep construction projects on schedule and make sure clients, crew members and subcontractors are in the loop.
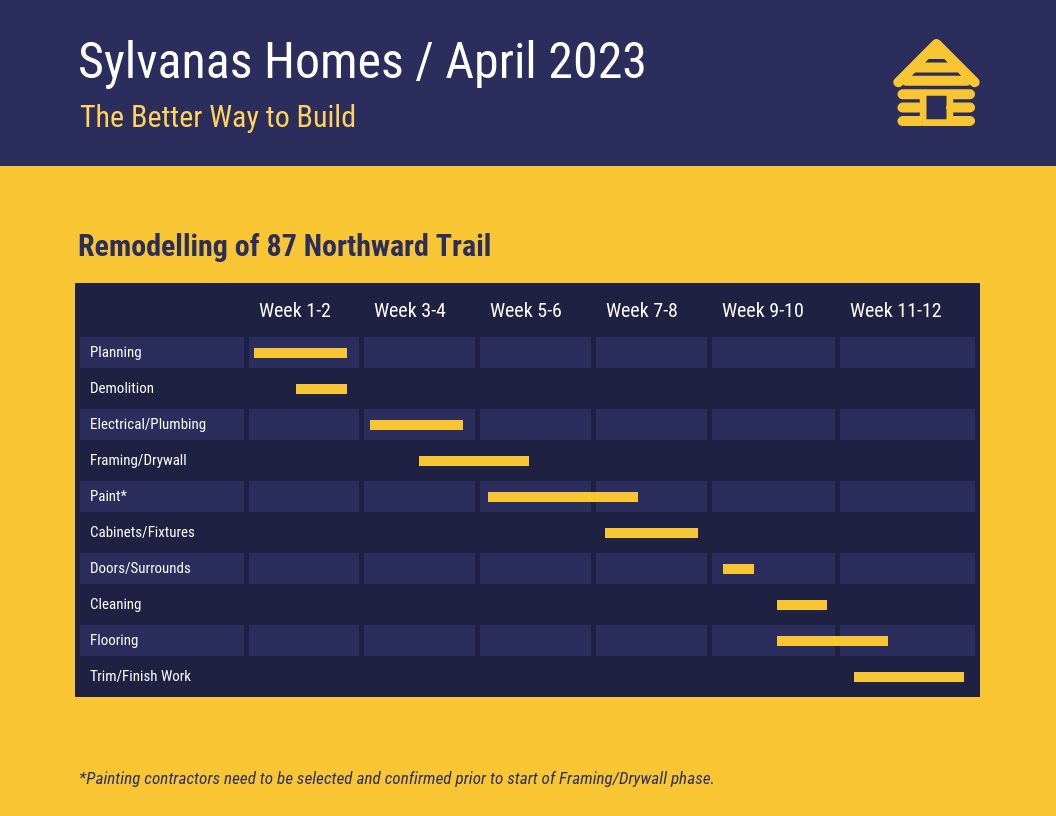
This construction project Gantt chart example will make sure everyone’s on the same page. The chart’s simple format makes it easy to see what activity is due when.
You can edit the Gantt chart as the project progresses.
- For example, if an activity is taking longer than it should, extend the bar’s length and make that section red. That way, everyone is instantly aware of overtime and potential project delays.
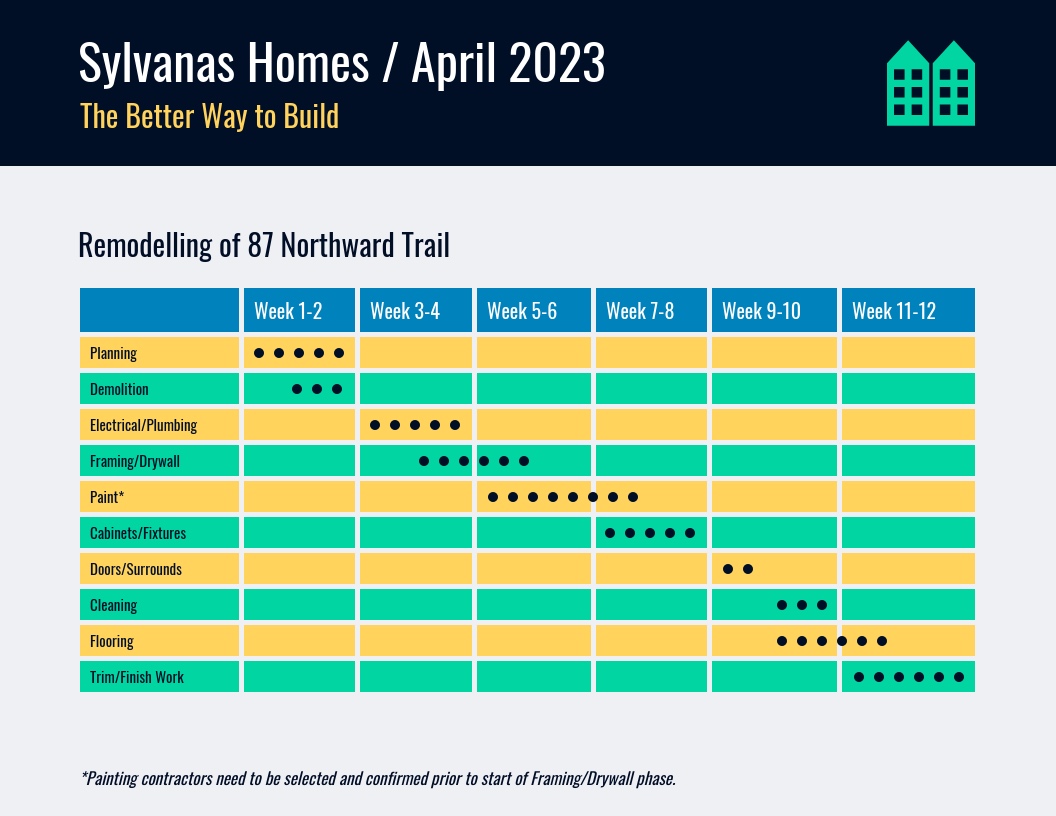
This construction project Gantt chart example is almost the same format as the previous one, but the dots represent two day intervals. For example, demolition will run from Friday of week 1 to Friday of week 2 (six days).
3. Gantt chart example for project proposals
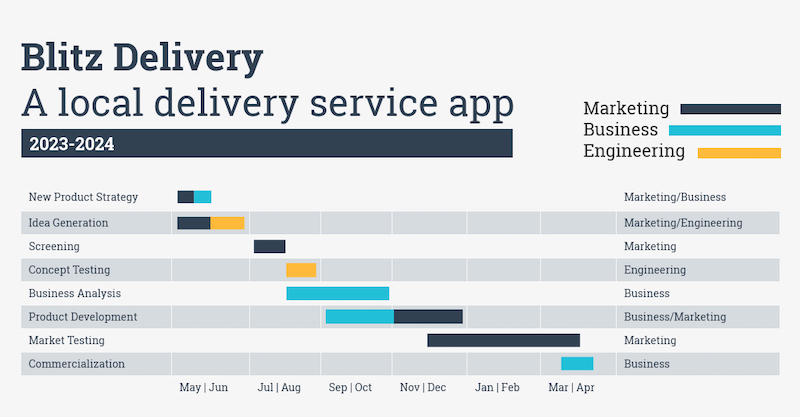
New product in the works? Use this dark new product project Gantt chart example.
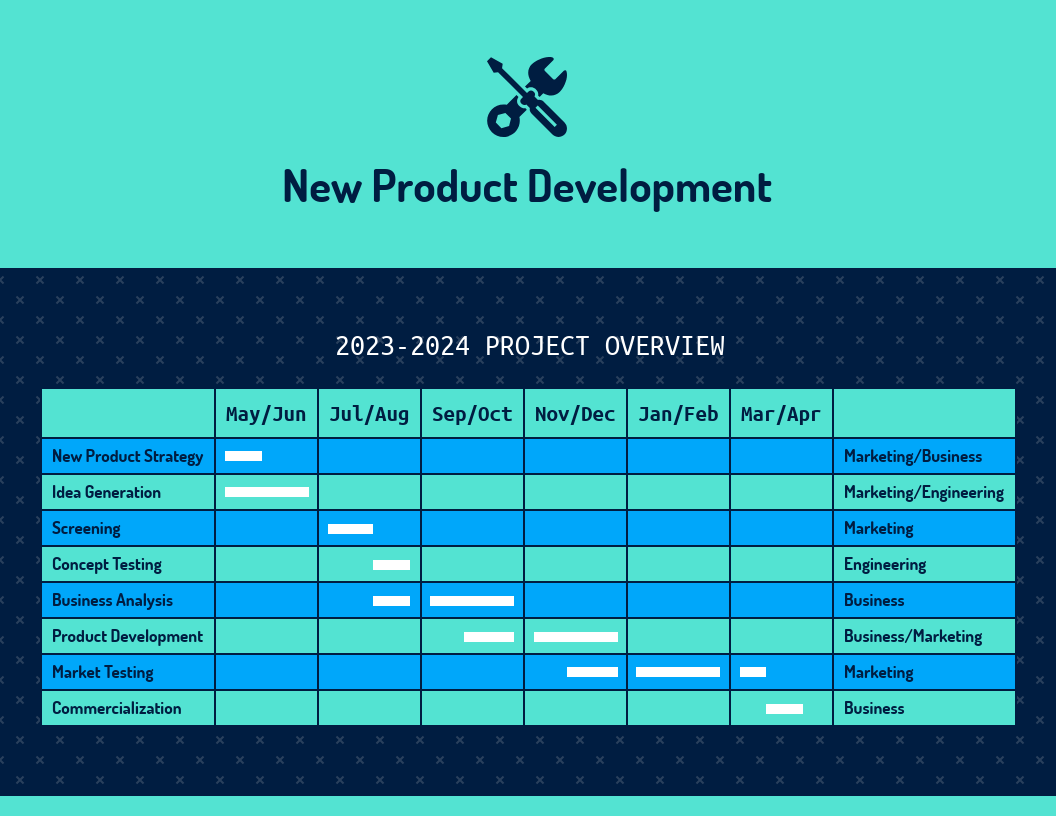
The far left hand column maps out the activities, such as concept generation, testing, product development, and commercialization, while the far right column lists what department is responsible for each activity.
Product development typically involves multiple departments or teams of people. There may be no one project leader, or only multiple managers, on multiple teams.
A Gantt chart is the perfect way to manage tasks between multiple teams as all the information is in one place, in a crystal-clear format.
It eliminates confusion about dependencies i.e. who needs to finish what before another team can begin their task.
Pro Tip: You can also include the chart in your business report or presentation. Download your finished Gantt chart as a PNG file (Premium and Business plans only). Choose a presentation template from our library. Once you’re in the editor, click the “Image Upload” tab to upload the Gantt chart and add it to your slides.
4. Gantt chart example for business plans
A business plan tends to contain a lot of information and can quickly become overwhelming to potential investors. Visualizing schedules, research or data will help break up all the text and quickly communicate key deliverables.
Investors need to see that you have a concrete plan in place that will let you achieve your revenue goals.
One strategy is to use a Gantt chart to visualize your business plan’s growth strategy or marketing plan.
Use the Gantt chart example above to plot your business strategy and major milestones. Edit the time frame on the bottom to plot out stages by quarter–over several years, if you like.
You can also include this Gantt chart in your project plan.
5. Gantt chart example for consultants
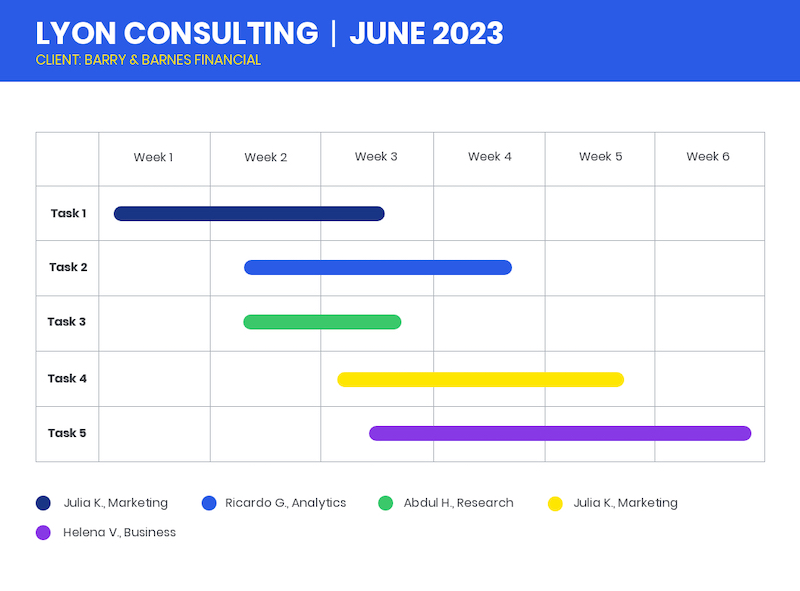
Your client’s hired you to help them achieve their goals. But, let’s say they’re a new client and they need a little more reassurance that you, the consultant, is on top of things. Show your client that you have a workable roadmap to success with a Gantt chart.
Edit the above Gantt chart example and divide tasks–between your team, any subcontractors and your client’s team. Refer back to the chart during your weekly calls with the client to make sure you’re both on the same page.
If you’re overwhelmed by admin work, check out our job proposal templates, business proposal templates and consulting report templates and get important documents out the door a lot faster.
Find a hard time creating business proposals fast? Read our in-depth business proposal guide to whip up proposals quickly.
6. Gantt chart example for manufacturing
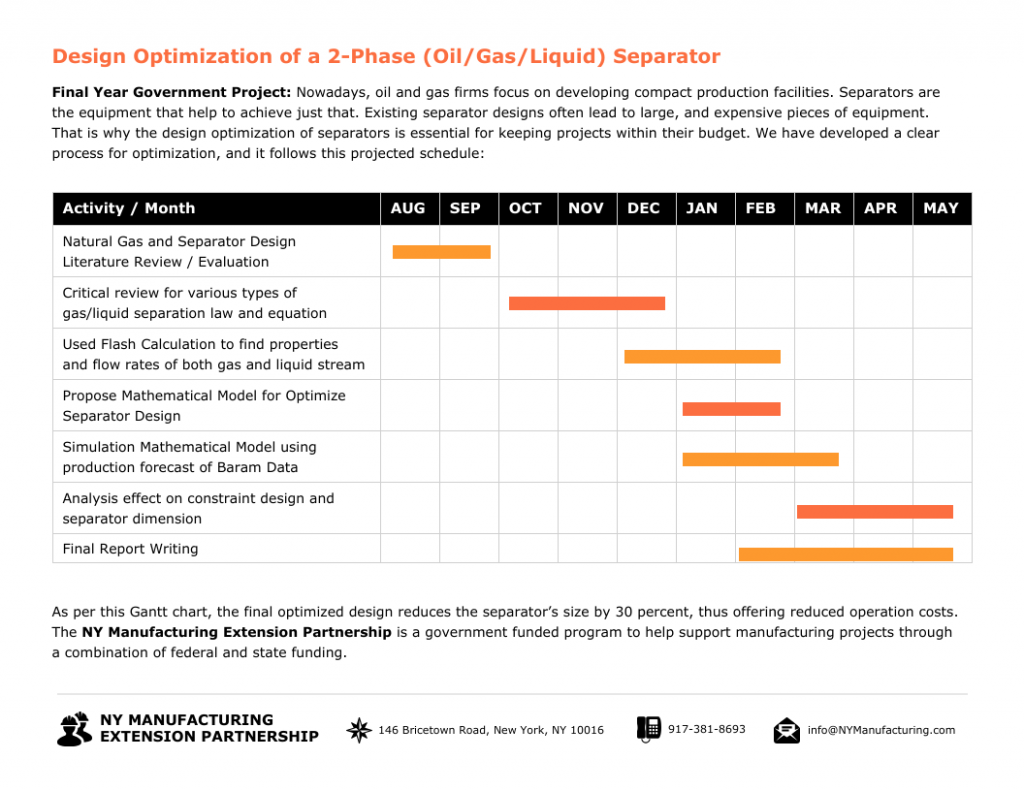
A Gantt chart template for manufacturing is useful for both employees and management. It works as a project management infographic that clearly maps out the entire production process in a visual format, detailing each step from raw materials to the final product. This clarity allows your employees to see exactly what needs to be done and when, making it easier to coordinate efforts and maintain smooth operations.
Management teams benefit by being able to quickly identify potential delays and adjust plans accordingly to keep the project on track. A Gantt chart ensures everyone is on the same page, enhances productivity, and guarantees timely delivery of products.
Pro Tip: Customize your Gantt chart template to include color codes for different stages of the production process. This visual differentiation can help team members quickly understand the status of various tasks and prioritize their efforts more effectively.
7. Gantt chart example for medical research

This Gantt chart example is perfect for medical professionals and scientists planning to work on a research project. Since medical research takes years and multiple trials, this Gantt chart template accounts for all the phases.
It starts with preclinical trial phases and includes proof of concept, subsequent trial rounds and even the FDA approval stage.
8. Gantt chart example for a housing project

Starting a housing project as a nonprofit institution? This template is the perfect tool for efficient project planning. It covers all stages of housing development end-to-end.
From the initial planning stage to the demolition of existing building, plumbing, drywall, furniture and flooring, this template helps you set a timeline for everything. The best part is that this improves accountability and ensure the project gets delivered on time.
9. Gantt chart example for website project

Website development projects can stretch unnecessarily long due to scope creep, technical challenges and miscommunication among stakeholders. This Gantt chart template helps prevent that. You can list down all activities along with the timelines.
For example:
- Project planning and gathering resources (1-2 weeks)
- Wireframing and design (2-4 weeks)
- Content creation (2-3 weeks)
- Front-end development (4-5 weeks)
- Back-end development (5-6 weeks)
This helps the team plan their tasks as per the due date.
10. Gantt chart example for event marketing
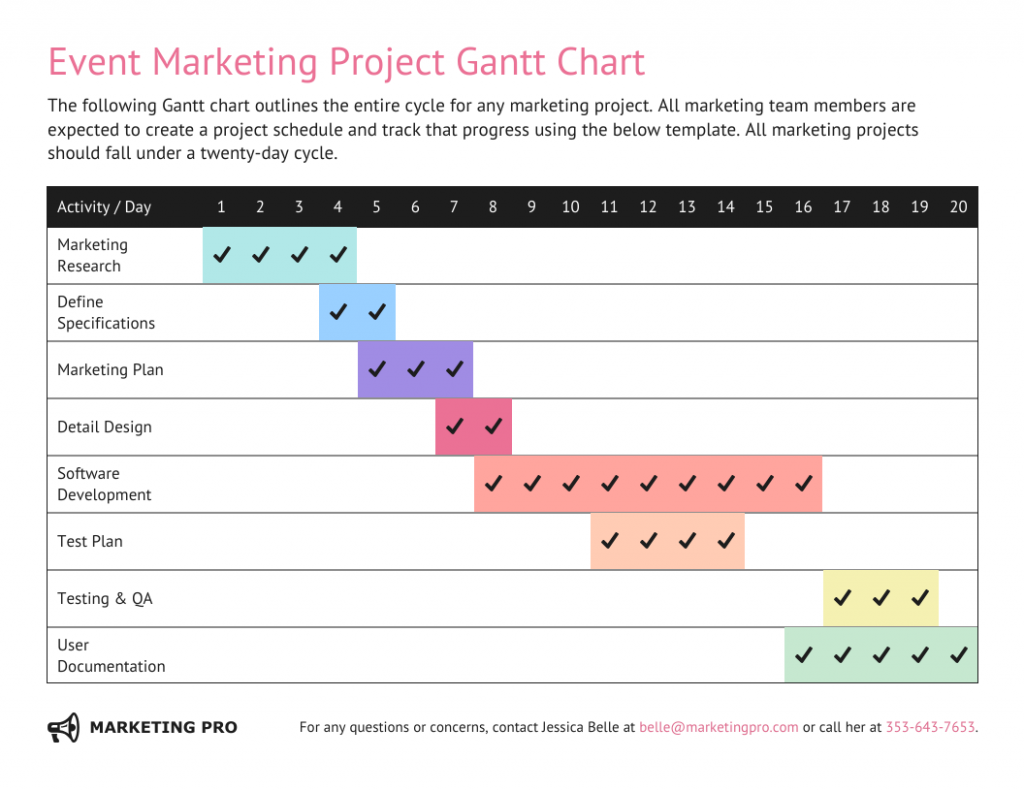
You’ve planned a great event. The theme and vendors are finalized. Now comes the tricky part — event marketing. You need a solid plan to ensure you promote your event so that you can get the best sponsors, speakers and participants.
This event planning Gantt chart template helps you come with an efficient plan for event marketing. You list down each step, such as marketing research, marketing campaign execution and PR and media outreach, along with the timelines so everything goes smoothly.
11. Gantt chart example for movie production
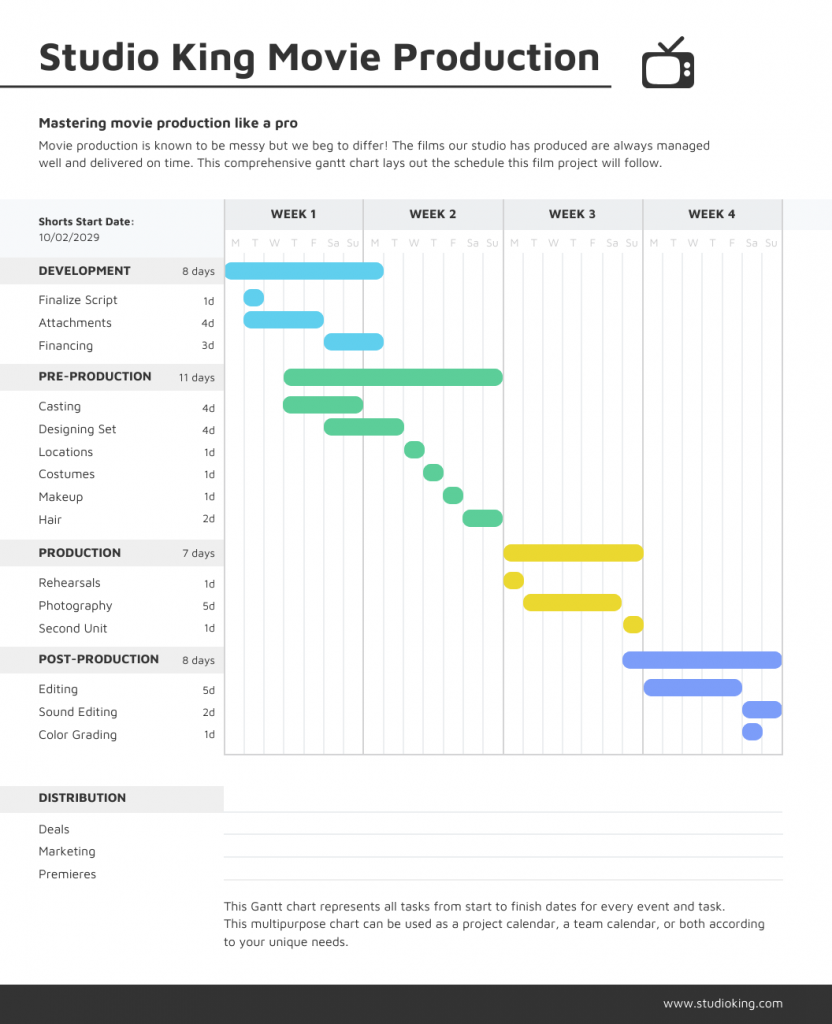
There’s so much that goes into movie production — from casting the right actors, securing locations, and setting up equipment, to coordinating shooting schedules, managing budgets, and editing footage.
Each step needs precise planning and execution to ensure the film progresses smoothly and stays on track. That’s why having a solid plan is crucial to keeping everything on track and ensuring a timely release.
This movie production Gantt chart template helps you organize each phase, from casting and set design to filming, editing and marketing. With clear timelines for every step, you’ll be able to ensure the production runs smoothly and stays on schedule.
What is a Gantt chart used for?
A Gantt chart is a handy visual tool that’s great for project management, helping to lay out a project schedule. Here’s how it helps:
- Plan and schedule projects: By outlining tasks, how long they’ll take, and how they depend on each other, Gantt charts make planning and scheduling projects of any size much easier.
- Track progress: They give you a clear visual of project progress, showing which tasks are done, which are in progress, and which haven’t started yet.
- Visualize dependencies: The chart highlights how tasks depend on each other, making it easy to see how a delay in one task might affect others.
- Identify critical path: Gantt charts help you figure out the critical path of a project—the sequence of tasks that must be completed on time for the project to stay on schedule.
- Facilitate communication: They serve as a centralized communication tool, providing everyone with a clear overview of the project timeline and who’s responsible for what.
Gantt charts are super useful for keeping projects organized, on track, and ensuring everyone on the team is on the same page.
How Gantt charts improve project communication & tracking?
Gantt charts are useful tools that can boost team communication, project tracking, and time management. Here’s how:
- Clear visualization: Gantt charts give you a visual overview of the entire project, showing the timeline, tasks, and milestones. This makes it easy for everyone to understand their responsibilities.
- Status updates: Everyone can see the status of each task at a glance, which helps in identifying any delays and facilitates timely discussions.
- Collaborative planning: These charts make it easy to plan tasks together and adjust them as needed, ensuring that everyone is aligned.
- Real-time monitoring: You can track the progress of the project in real-time, making sure everything is on schedule.
- Dependency management: Gantt charts show how tasks depend on each other, so you can see how delays in one task might affect the overall timeline.
- Prioritization: They help prioritize tasks based on their importance and deadlines.
- Resource Management: Gantt charts highlight resource bottlenecks, ensuring optimal use of resources.
- Forecasting: Teams can predict future workload and adjust plans to prevent team members from being overburdened.
Practical Example: Imagine you’re running a marketing campaign. A Gantt chart can help you:
- Schedule tasks: Plan out content creation, design, social media posts, and ad placements.
- Assign responsibilities: Clearly assign tasks and set deadlines for each team member.
- Track progress: Visually update the status of each task to see what’s completed and what’s still in progress.
- Manage dependencies: Make sure that content is ready before starting the design phase.
- Adjust plans: Modify tasks as needed to stay on track for the campaign launch date.
Gantt charts provide a clear and visual way to manage projects. They improve team communication, project tracking, and time management, leading to more successful project outcomes.
What are the different components of a Gantt chart?
When you first look at a Gantt chart, it might seem overwhelming.
What do the bars or lines mean? How do they relate to the x and y axes? Let’s understand what they mean.
A Gantt chart only has three main parts:
- Activities and/or tasks (left axis)
- Milestones (top or bottom axis)
- Activity and/or task bars
Take a look at this simple Gantt chart example:
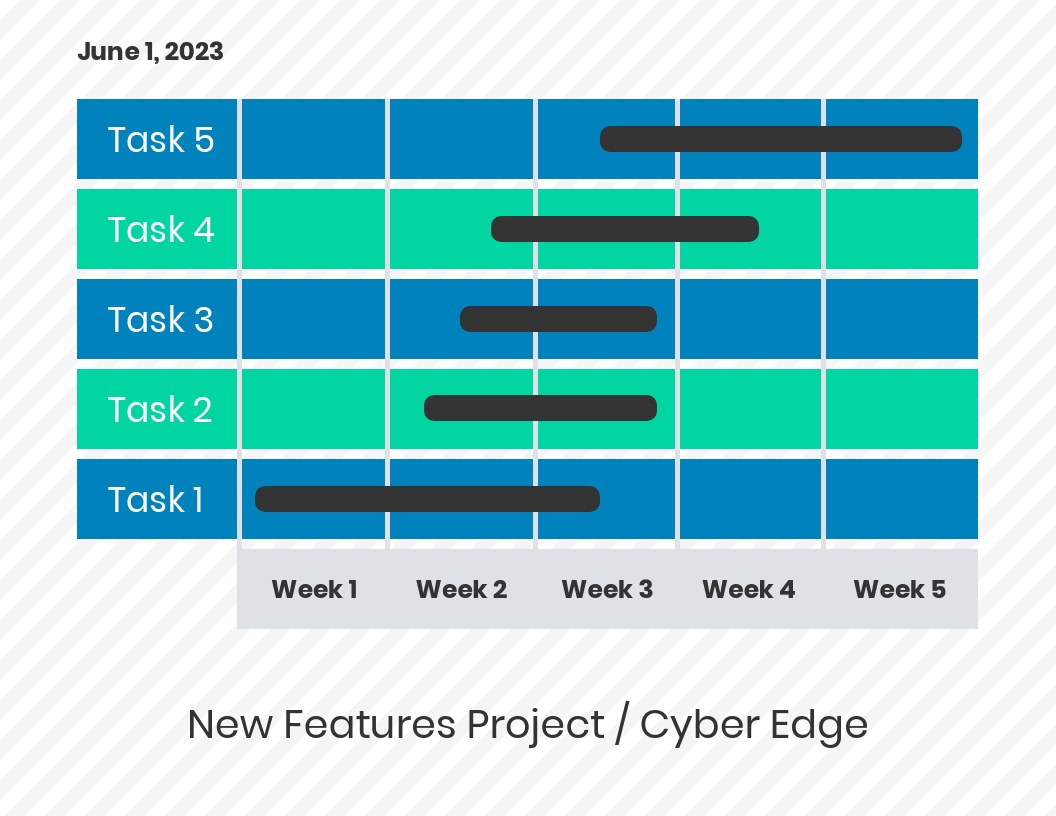
It has:
- Tasks on the left axis
- Milestones on the bottom axis
- And bars that show when each task should begin and end
Of course, more complex projects, such as the construction of large urban infrastructures or complex software engineering services, require more complex Gantt charts.
The Gantt chart example below takes things a step further by dividing activities into smaller tasks.
- For example, “Planning” is divided into: needs assessment, project agreement and site map.
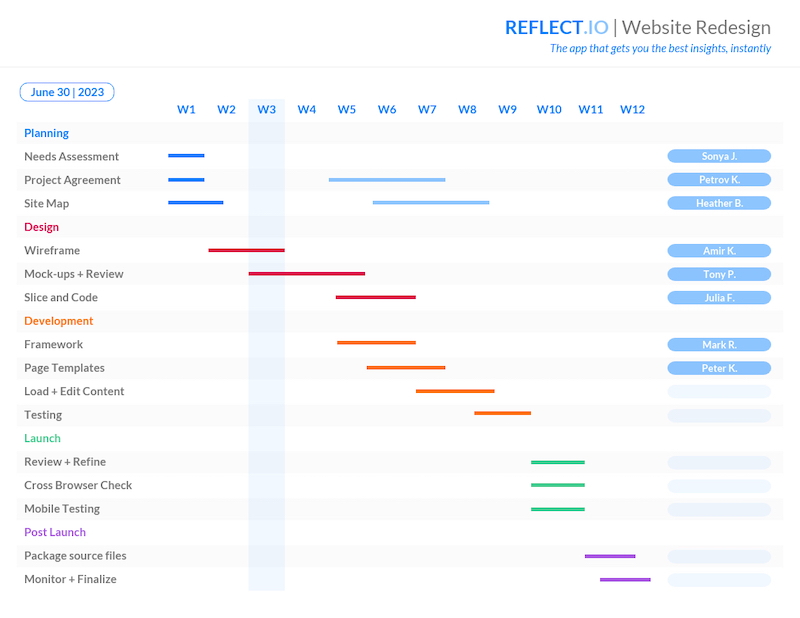
This Gantt chart also lists (on the right) who’s responsible for each task.
How to make a Gantt chart
The good news is that you can now create a Gantt chart with Venngage in five steps:
Step 1: Choose a Gantt chart template
Choices, choices. Open our Gantt chart templates gallery.
Then, select the template for you by:
- Industry
- Ex. Dark Home Construction Project Gantt Chart Template
- Task
- Ex. Dark New Product Project Gantt Chart Template
- Timeline
- Corporate Weekly Project Gantt Chart
- Complexity
- Ex. Detailed Project Gantt Chart
Hover over the template you like and click “Create.”
Step 2: Define your project timeline from left to right
Start by laying out the timeline of your from left to right, creating divisions by day, week, month, or quarter.
In this Gantt chart template, click the text box you want to edit and start typing.
Or delete the days of the week and add months or quarters, instead.
Made a mistake? You can click “undo” in the top toolbar at any time.
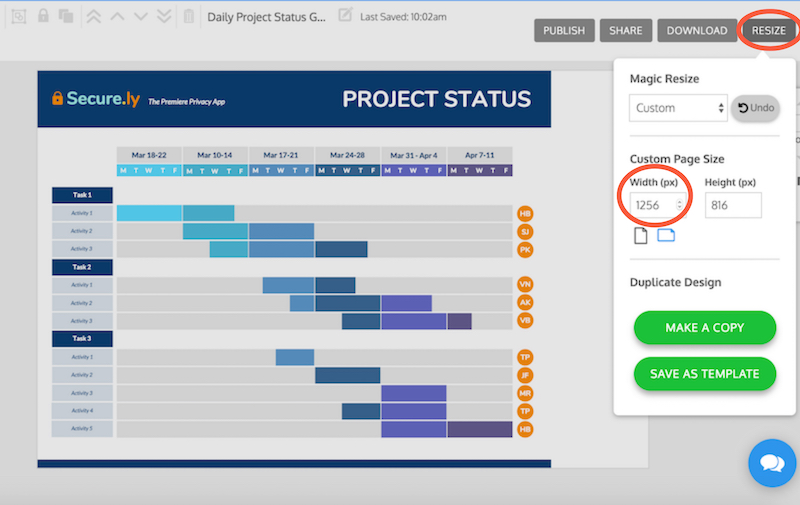
To add a new column to the right, click “Resize” and increase the width of the custom page size. Try adding 200 more pixels and readjust as needed.
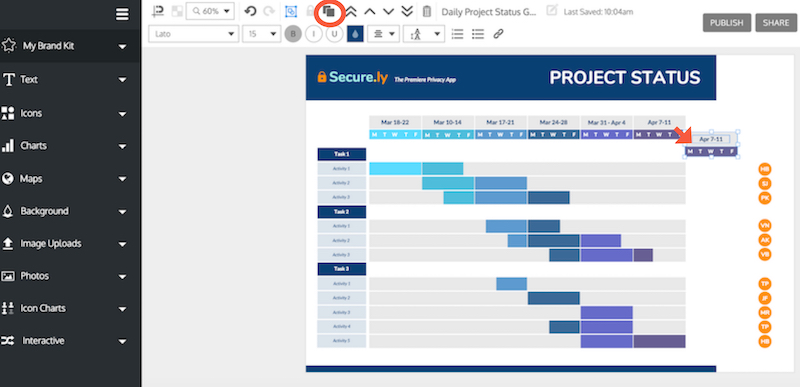
Then, drag and select all the orange icons to move them to the right at the same time.
Drag to select the entire dates section and click “copy” and move into place. Edit the dates.
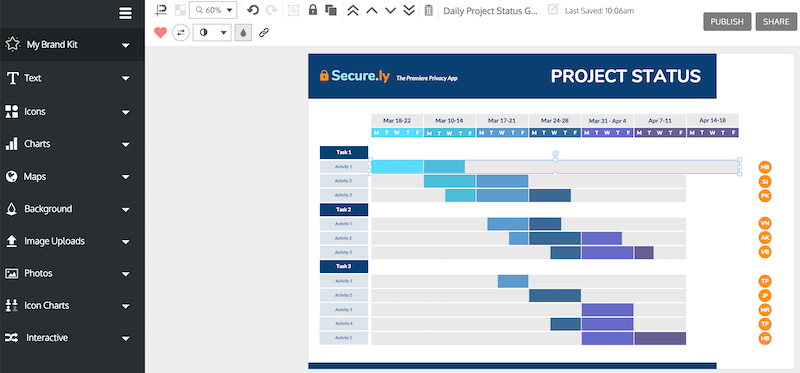
Now, drag to extend the beige bars. Use the “snap to guide” feature to help you align everything perfectly.
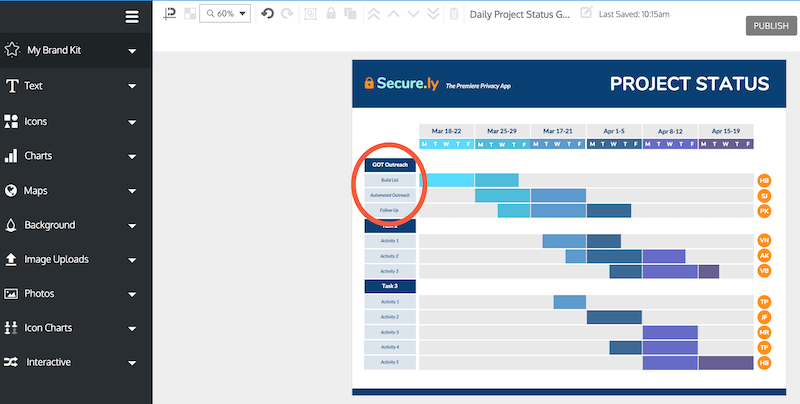
Step 3: Add and assign tasks from top to bottom
Click the tasks and activities to edit the text. Use the top navigation bar to change the font style, size, color etc.
If you need to add a new row, follow the same steps for adding a new column as above. Just adjust the height of the page size instead of the width. Then, copy the last row by dragging to select and pressing “copy.”
Step 4: Adjust dependencies and task durations
Adjust each bar so it begins at the task’s start date and extend it to the end of the expected task deadline.
Click each bar to move it or drag it. The snap-to-guide feature will help you align the bar with the specific day of the week above.
Copy other bars with the right color and move them into place to extend the timeline of a task.
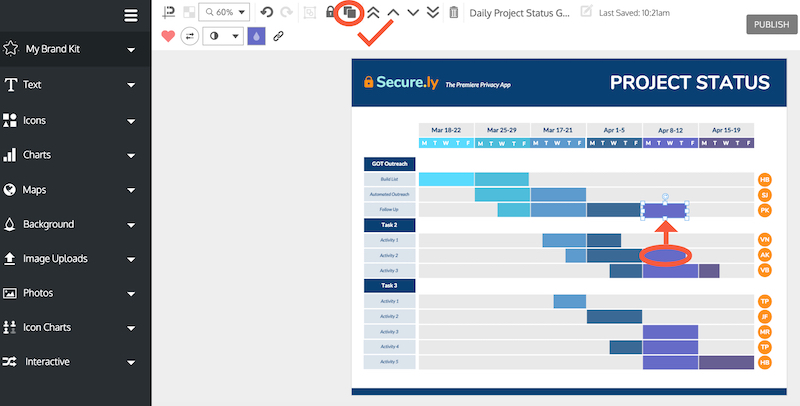
You can also click the orange circles to assign each task to a different person–in the above Gantt chart template they’re indicated by initials.
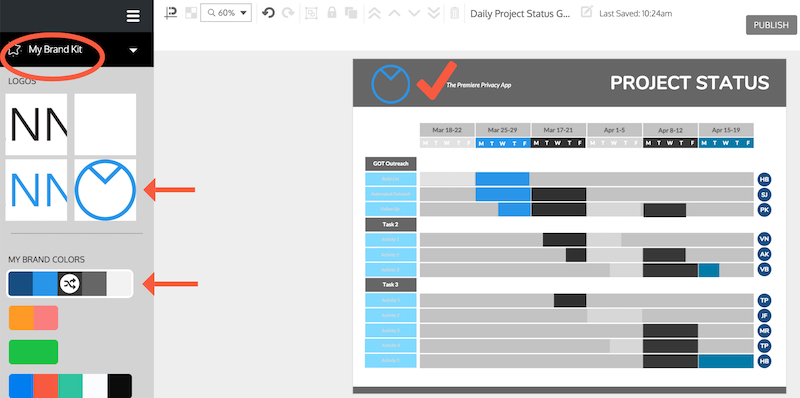
Step 5: Customize and brand your Gantt chart
Brand your Gantt chart with one click by opening the My Brand Kit tab. Drag your logo into place.
Then, click a “My Brand Colors” palette to apply these colors to the entire template. Click “Shuffle” to scroll through different color combinations. Very cool.
Want a different type of design? Discover even more Gantt chart templates.
Pro Tip: Struggling to customize your Gantt chart just the way you want it? Venngage offers priority support via email, chat and phone and 1-on-1 consultations to Business plan members. Ask our designers for tips on how to present your idea visually — whether in a Gantt chart or a presentation, report, white paper etc.
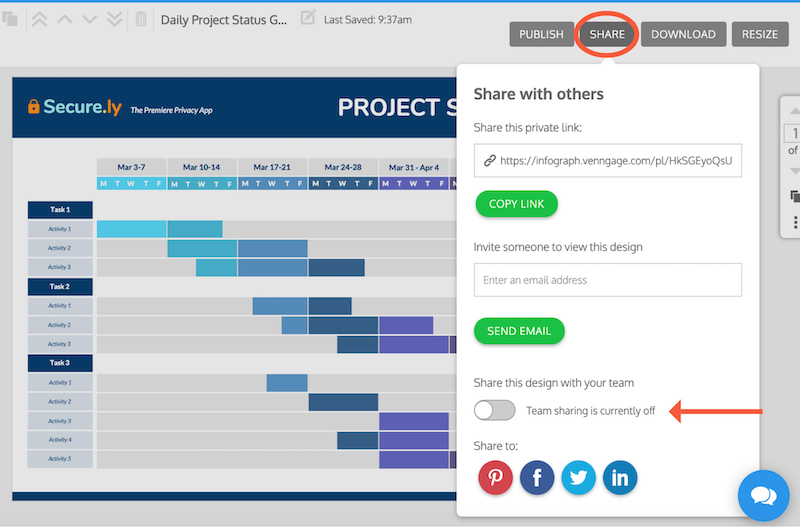
Pro Tip: Use Venngage’s collaboration features to add team members (like your client) to your account and share your Gantt chart seamlessly. Or better yet, edit and customize your gantt charts with your team in real time with our new real-time collaboration feature!
Common Gantt chart mistakes to avoid
While using Gantt charts, here a few common mistakes, you should avoid:
- Adding too much information: Including every tiny task makes the chart cluttered and hard to read. Focus on key milestones and dependencies instead.
- Setting unrealistic timelines: Overly ambitious deadlines can cause stress and project failure. Set realistic durations based on team capacity and past project data.
- Not considering task dependencies: Not linking related tasks can lead to scheduling conflicts. Make sure to define dependencies so delays in one task don’t disrupt the entire project.
- Not reviewing the chart regularly: A Gantt chart is only useful if it’s kept up to date. Regularly review and adjust it as project timelines shift.
FAQs about Gantt charts
How do Gantt charts compare to Kanban boards?
Gantt charts are timeline-based and ideal for projects with strict deadlines and dependencies. They show task sequences, durations, and progress over time. Kanban boards, in contrast, focus on workflow management, using columns to track tasks visually. Gantt charts work best for structured projects, while Kanban boards are better for flexible, ongoing work.
What is the best software for making a Gantt chart?
If you are looking to create visually appealing Gantt charts with customizable templates, Venngage is the best software. You can also use Microsoft Project to create Gantt charts for enterprise-level projects.
Are Gantt charts outdated?
No, Gantt charts are not outdated. Gantt charts are still relevant across different industries, especially for structured projects with clear timelines. While agile methods like Kanban have gained traction, many modern tools now offer interactive Gantt charts.
Create Gantt charts with Venngage
Gantt charts are an excellent tool for project planning and management, helping ensure tasks are completed on time. They keep your team aligned, enhance accountability, and are customizable for any industry.
But creating Gantt charts from scratch can be time-consuming. That’s where Gantt chart templates come in handy. Venngage offers a wide variety of templates to help you save time and get started quickly.
You might also enjoy:
20+ Stunning Consulting Proposal Templates That Will Convert Prospects to Clients
20+ Page-Turning White Paper Examples [Design Guide + White Paper Templates]


