


Convincing consumers that your product is worth their time and money is one of the most fundamental tasks companies and marketers face. There are virtually limitless options for doing this, but one of the best ways is through the use of a product infographic.
Product infographics are a type of business infographics that combine the benefits of visual communication with the mission-critical task of delivering your company’s value proposition. A product infographic can be used for any business communication needs, be it for internal or external audiences.
With Venngage’s Infographic Maker, you can ensure product value infographics are well-designed and reflect your brand identity, even if you’re not a designer.
Let’s explore product infographics that communicate value and go over tips for how you can use infographics to show the value of your product or keep your team organized during the product development life cycle.
Want to learn more about other types of infographics? Read our blog on the 9 main types of infographics or watch the video below:
Click to jump ahead:
- Product infographic examples
- 7 ways to show product value with infographics
- Why product infographics?
- Product development infographic
- Product features infographic
- Product life cycle infographic
- Value chain infographics
- Tips for creating effective product infographics
Product infographic examples
Product infographics can be quite literal, describing or displaying a good or service and explaining various aspects or benefits of it. They also can be informative, exploring the details of a problem solved by a given company’s goods or service.

This example is on the literal side, showing a picture of a physical product, bone broth in this case, and highlighting key aspects. An example like this would be ideal for any sort of physical product, whether it’s food or any other consumer product.

Instead of focusing on the product itself, a product infographic can put the problem at hand front-and-center, as this infographic pitch deck example does. A variety of data and informational content tell the story rather than the good or service being the focus.
7 ways to show product value with infographics
Let’s take a look at some specific ways you can show product value using infographics, including many templates you can get started with today.
- Focus on the biggest benefits
- Contrast product with other options
- Show how it works
- Illustrate history of company or product
- Spotlight the problem
- Share pro tips
- Dig into numbers
1. Focus on the biggest benefits
One of the simplest ways of illustrating product value through an infographic is by listing out its biggest benefits. This holds true for many types of products, including physical items as well as service-based products.
Let’s take a look at the home cooking infographic below:

While this example doesn’t exactly deal with one physical item, the approach is perfect for products or services where it’s possible to create a visual representation of what’s being sold. Surrounding the main image are the biggest selling points.

Benefit-based product infographic layouts don’t have to rely on images of the product or a graphic representation of it, as this example illustrates. Making the infographic on the longer side also gives you more room to expand upon the benefits and features.
2. Contrast product with other options
Depending on your industry, your product could be up against dozens of others in the minds of consumers, or perhaps you need a way to help buyers understand the options in a slate of product offerings.
Comparison infographics are ideal for communicating about products and services, and they are at their best when they help buyers make a decision.
This infographic, for example, is an ideal tool for helping a regular person understand whether solar energy is right for them. No specific product is mentioned, but the basic benefits and drawbacks of solar energy are the focus.

In other cases, it’s helpful to be overtly commercial, comparing your product or service to competitors. As this product infographic does, the hero product is highlighted, while the reader can see where it compares and contrasts with other tutoring options.

Depending on your company and product offerings, it’s often helpful to give customers a way to select the right option for them from a slate of possibilities. In this pricing comparison infographic, one option is highlighted, and it’s easy to imagine versions being created for a variety of user personas.

3. Show how it works
Helping customers use your product is an excellent way to make sure they’re getting the most out of it, which ensures they will be able to see its value.
Videos are a popular way to do this, like this one about how to make an infographic in 5 steps:
But infographics also take advantage of the power of visual learning. That could mean designing an infographic that describes in detail how to use your product, while for some products and industries, infographics that are more general can be effective.
This product launch example can be used as is for internal communication, or it can easily be customized to serve as a quick-start guide for a user or customer, ensuring they have the basic knowledge required to make the most of their new purchase.

Discussing a topic generally is also an excellent way to help users or buyers understand how the product works. Even though in this example the product itself is not the focus, the simple visualization of how solar power works and what components are involved can help a new buyer understand how to use the product.

4. Illustrate history of company or product
Engage potential customers by describing how the product was developed or why your company was formed in the first place. Most modern consumers are swayed by compelling brand narratives.
That means not only ensuring that your products are useful and effective but that you make an emotional connection to the story of your company and what it offers consumers.
Related: 15+ Company Infographic Templates, Examples & Tips
A company history like this example could work for both long-lived companies and startups, as it’s easy to customize with Venngage’s infographic software.

In some cases, your story will focus on the history of your company, but examining the space in which your product or company exists is also a good option. For example, the infographic below would be ideal for a company launching an instant messaging app, as it crafts a detailed journey in consumers’ minds.

5. Spotlight the problem
Connecting with consumers about the issues your product or company addresses is a great way not only to build a relationship but to take advantage of the data visualization aspect of many types of infographics.

This infographic doesn’t reference a specific product but rather shares information about the broader issue, including how companies and workers perceive corporate wellness programs.
The infographic above could be easily adapted for any industry, and by using Venngage’s My Brand Kit feature, you ensure your logo, fonts and colors are being used properly.

Similarly, this infographic aims to raise awareness of the risks of fireworks injuries, which often spike around July 4th. The brand in this case is a nonprofit, but this advocacy approach is applicable to any industry.
Related: 6 Types of Nonprofit Infographics to Boost Your Campaigns
6. Share pro tips
What better way to make sure your customers become expert-level users of your product or service than by sharing pro tips with them? Pro tip infographics for products should go beyond what would show up in a basic user manual.

While the above example deals with the product development process itself, it’s an excellent format for sharing advice that helps users think differently about your product, and it can help you reinforce best practices.

As this Instagram carousel template illustrates, it’s not always necessary to offer tips about the actual product itself. As in other product infographics that don’t directly reference your specific product or service, a pro tip infographic can also make your brand stand out as a thought leader or trusted source of advice.
7. Dig into numbers
A close cousin to product infographics that delve into the original problem being solved by the product are ones that take deep dives into data surrounding trends, crises or broader societal issues. As with other examples, these need not always be directly tied to the product or company.

This statistical infographic, for example, breaks down survey data related to remote work, but no specific product or service is mentioned. Note that many types of data and visualizations are included, as are important takeaways.

A numbers-based product infographic can also be tightly focused and brief, as in this blood donation infographic. This layout is ideal when you don’t have survey data that allows for expansive data storytelling.
Why should you use product infographics?
Product infographics are a great way for businesses and marketers to share complex information in a way that’s both visually appealing and easy to understand. Here’s why they work so well:
- Simplify Complex Information: Infographics break down complicated product details into simple visuals, making it easier for your audience to quickly grasp the key features and benefits.
- Boost Engagement: People love visuals! Infographics grab attention and are more likely to be shared, helping your product stand out, especially on social media.
- Improve Information Retention: Studies show people remember visuals better than text. By presenting your product details in a visual format, you’re making it easier for your audience to remember what matters.
- Enhance SEO and Website Traffic: Infographics can attract backlinks and keep visitors engaged longer, which can help improve your site’s SEO and bring in more organic traffic.
- Work Across Different Platforms: Infographics are versatile and can be used anywhere—from your website and social media to emails and presentations—making them a valuable tool for your marketing efforts.
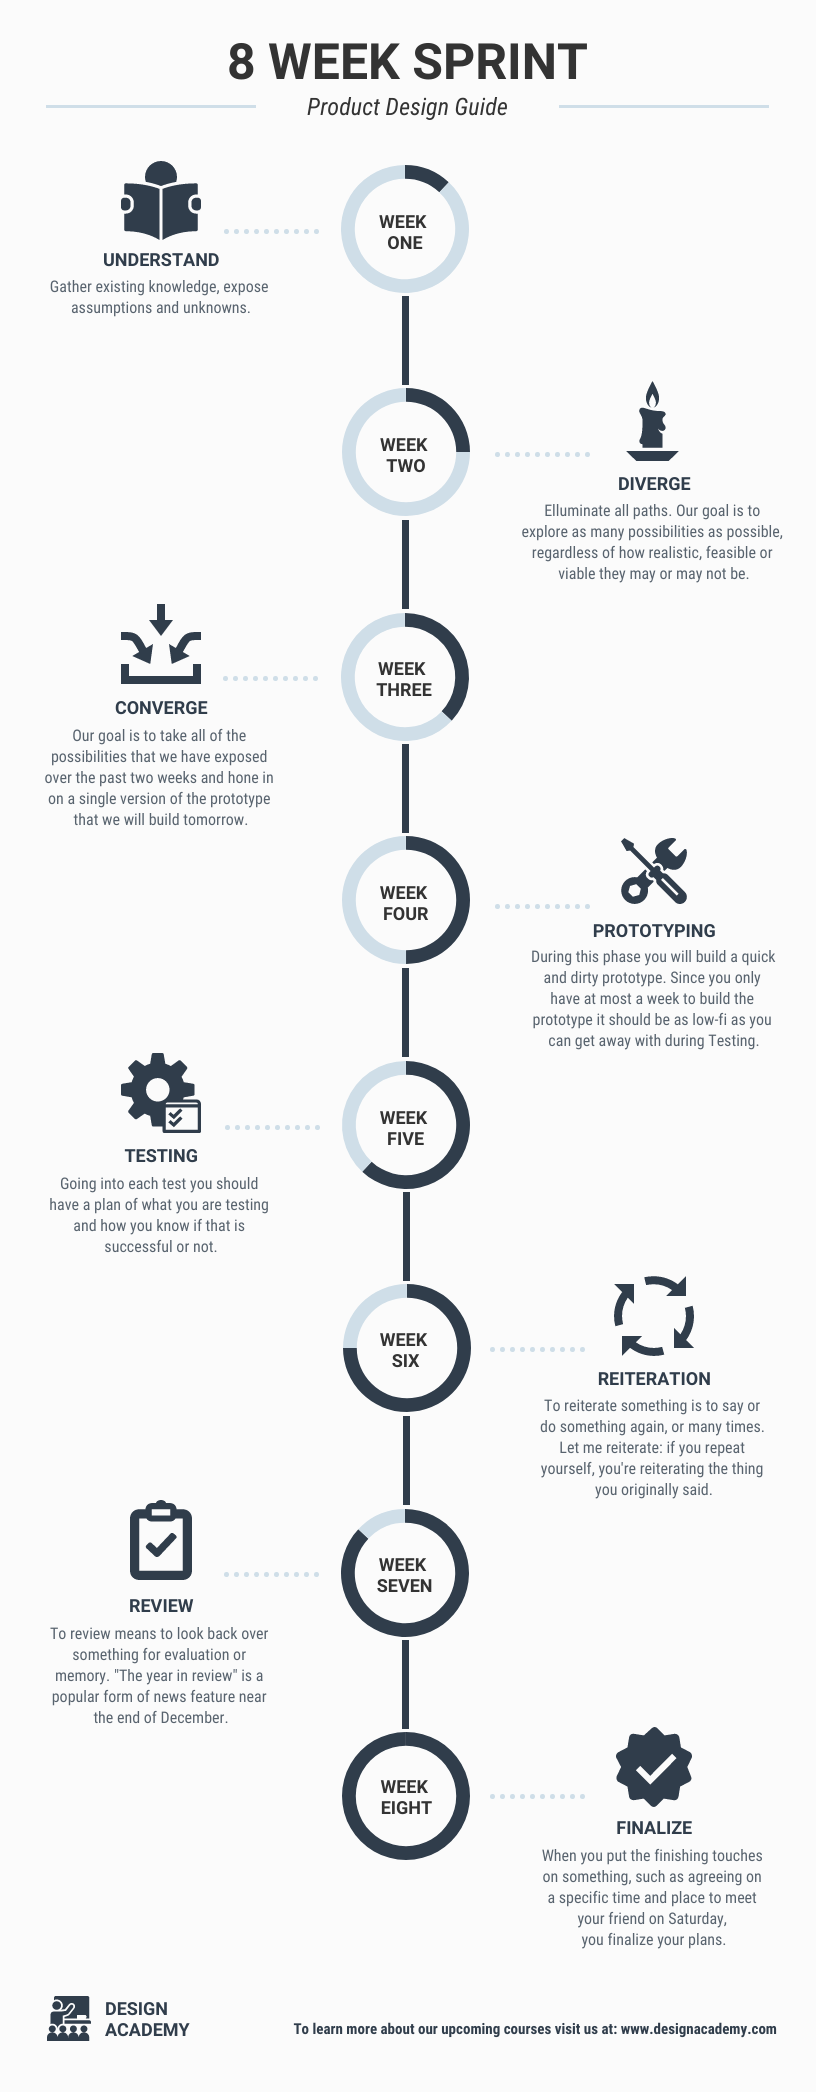
Product development infographic
So far, we’ve detailed ways to use infographics externally to engage customers and readers. But product infographics are also ideal for internal use, particularly when it comes to product development. Keep teams on task and make sure nothing falls through the cracks with a product development infographic.
Product development infographics are a perfect match for a timeline format, like this one that not only uses the familiar layout but also takes advantage of data visualization via pie charts in the center.
Timeline-based product infographics can also help projects stay on track even when they involve multiple departments. This product roadmap infographic that uses a Gantt chart style is an excellent method for cross-departmental teams.

Related:
- How to Use a Gantt Chart for Project Management [With Examples]
- 30+ Product Roadmap Templates, Examples and Tips
Not sure how to make a product roadmap? Follow these simple steps to create a Gantt chart that can help you keep projects on task and on time. Check out our Gantt chart examples too for more inspiration.

Timeline-based product development infographics can also take a more creative approach by counting down instead of counting up. In other words, want to launch a new product on a certain date? Use this infographic to schedule all the milestones along the way.

Lengthy projects and product development processes can run out of steam, which frustrates teams and threatens the bottom line. This product roadmap can help all involved understand when various tasks need to be done based on a quarterly calendar.

In some cases, it’s necessary to think much farther into the future than just the next year, as this example illustrates. Product development infographics can help people across the organization understand major milestones toward a huge company goal.

Product development infographics are also useful for describing the product development process itself. Whether it’s for internal use, such as onboarding a new employee, or something you share with a potential customer, infographics are a helpful tool in visualizing product development, or any other process you might be engaged in.

This product development process infographic is horizontal, which is ideal for compact storytelling, and it’s easily printable thanks to its size.

Product development process infographics are also friendly in a long, vertical format, and it’s typically easier to create these since you don’t have to be as sparing with words.
Product features infographic
We touched on this already, but an ideal use for infographics in pitching or promoting your product is explaining features. Product features infographics have become ubiquitous in many online sellers like Amazon.
The infographic below explains the features of an HP printer. The use of icons and other visuals makes it easier for people to scan all the information at a glance.

Infographics can be used to describe the features of a single product, like the one below:

Or they can be used to compare features of one good or service with its competitors, like this product infographic that compares different brands of website builders:

When creating a product features infographic, it’s important to keep the platform in mind; how will people read this? If it’s accompanying an online store listing, such as Amazon or another service, be sure to follow sizing recommendations.
Product life cycle infographic

Most companies are working on new products all the time, which is why a product development infographic that’s arranged in a circular format like the one above is ideal. Few products last forever, and companies need to develop product life cycles that can be repeated again and again.
Product life cycle infographics can help entrepreneurs, innovators and makers of all kinds visualize what it takes to get a product or service from their minds to market.
Value chain infographics
A product infographic could be described as a value chain infographic if it details the processes required to create a product that generates sales. A value chain encompasses all the activities by which the company makes its money.
So for companies that sell products, value chain infographics could come in the form of product roadmaps, assuming they describe or visualize the departments, inputs and outputs, resources and all other processes involved in product development.

Value chain infographics can also help identify areas of overlap or conflict that could negatively affect product development.
Tips for Creating Effective Product Infographics
- Use High-Resolution Images: When promoting a physical product, ensure you have high-resolution images taken from all angles. This will give you maximum design flexibility and allow you to be as creative as possible.
- Diversify Your Infographic Types: Don’t rely on just one type of infographic. There are many different styles of product infographics, and some may not suit your needs. Mixing different types as part of your overall content strategy can be more effective.
- Keep It Simple: Focus each product infographic on a single purpose and minimize the amount of text. This is especially important if you’re using a variety of infographic types to convey different messages.
- Maintain Brand Consistency: Use tools like Venngage to ensure your brand identity—logos, colors, and other elements—is consistently integrated into every product infographic you create.
- Create Multiple Versions: Consider designing multiple versions of each product infographic in various sizes to fit different platforms. For online product listings, such as on Amazon, be sure to understand and adhere to size restrictions.
- Know Your Audience: Tailor your infographics to your audience. While some viewers may be ready to purchase, many will not be. Be subtle with logos and commercial elements, especially in infographics where the product itself isn’t the primary focus.
In Summary: Product infographics effectively engage audiences, boost credibility, and convert potential buyers into loyal users.
Product infographics can keep your teams and projects on time and on budget, they can help you be a thought leader in your space, and they can harness the power of visual communication to engage your audience.
Whether you’re using a product infographic to help a new user get the most out of a physical product or you’re driving audience engagement by sharing user survey data, product infographics are a natural fit in any marketing strategy.
Start creating your own product infographic for free with Venngage’s drag-and-drop editor and hundreds of easy-to-edit templates.


