


A Gantt chart is a great tool for ensuring your projects are running smoothly. Businesses that use Gantt charts for project management are better able to visualize how tasks are related to each other.
This guide will show you how to use and create a Gantt chart for your projects.
Haven’t created a Gantt chart before? Venngage’s professionally designed Gantt chart templates can help you create effective project management diagrams in minutes.
What is a Gantt chart in project management?
A Gantt chart is one of the many diagrams that can be used for project management. A Gantt chart can display a list of individual tasks and subtasks along a timeline.
Gantt charts help project managers discover scheduling problems early on since that is the foundation of project management.
Gantt charts can not only display task dependencies (how one task is connected to others) but also task duration and team responsibilities. This enables project managers to better communicate with team members and keep track of project statuses.
Here’s a Gantt chart example that illustrates the different phases of a local delivery service app. In this example, you can see how different departments can work together to develop and promote a new product or service.

Gantt chart example: what it looks like
If you’re new to Gantt charts, it helps to see a simple example first. Below is a basic project plan for organizing an event.
| Task | Owner | Start | End | Notes |
|---|---|---|---|---|
| Pick event date & budget | PM | Week 1 | Week 1 | Milestone: “Date confirmed” |
| Book venue | Ops | Week 1 | Week 2 | |
| Create invite list | Marketing | Week 1 | Week 1 | |
| Send invitations | Marketing | Week 2 | Week 2 | |
| Order catering | Ops | Week 2 | Week 3 | |
| Final headcount | PM | Week 3 | Week 3 | Milestone: “Headcount locked” |
| Event day | All | Week 4 | Week 4 | Milestone: “Event live” |
What makes this a Gantt chart?
On its own, this looks like a simple table. But once you visualize it as a Gantt chart:
- Each task becomes a horizontal bar across the timeline
- The Start and End columns decide where the bar begins and ends
- Tasks that overlap (like booking the venue and creating the invite list) appear side by side
- Milestones stand out as key checkpoints instead of long tasks
- You can instantly see the flow from Week 1 → Week 4
In other words, a Gantt chart takes this exact information and turns it into a visual timeline that’s much easier to scan.
The 7 important elements of a Gantt chart (anatomy)
A Gantt chart looks simple at first glance, but every part has a job to do. Once you know what you’re looking at, it’s much easier to read (and create) one.
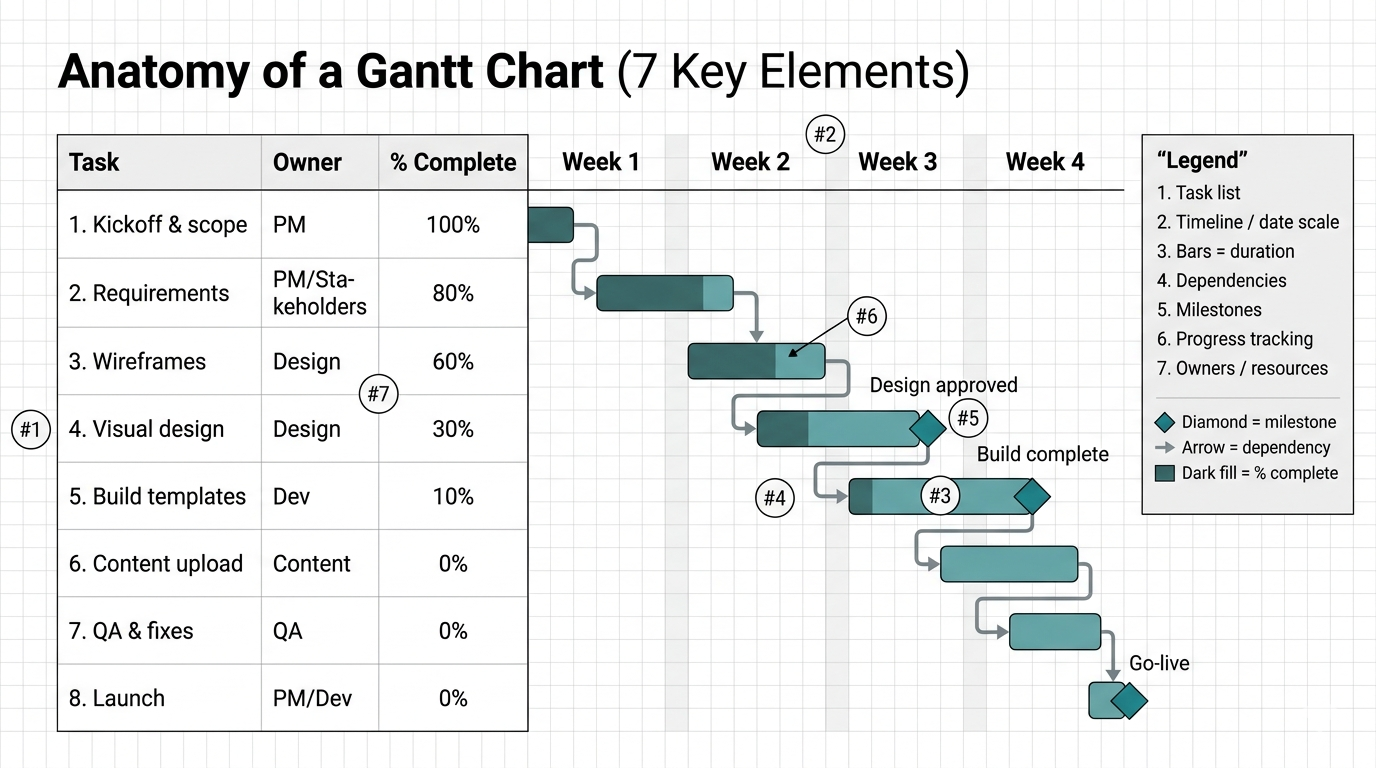
1. Task list (WBS)
This is the full list of project tasks, usually shown on the left side of the chart. Think of it as your work breakdown structure: every major phase, subtask, and deliverable lives here so nothing gets missed.
2. Timeline / date scale
The timeline runs across the top of the chart and shows when work happens. Depending on the project, this can be broken down by days, weeks, or months to give everyone a clear sense of schedule.
3. Start & end dates + duration (bars)
Each horizontal bar represents a task. The position of the bar shows the start and end date, while the length shows how long the task is expected to take. This is what makes a Gantt chart easy to scan.
4. Dependencies
Dependencies show which tasks rely on others before they can begin. For example, if design needs to be finished before development starts, the chart makes that relationship visible so delays don’t catch the team off guard.
5. Milestones
Milestones mark key checkpoints in the project, like approvals, launches, or major handoffs. They usually appear as small symbols rather than full bars because they represent important moments, not ongoing work.
6. Progress tracking
Many Gantt charts include progress indicators inside the task bars, often shown as a filled percentage. This helps teams quickly see what’s completed, what’s in motion and what might be falling behind.
7. Owners / resources
This part shows who is responsible for each task or what resource is assigned to it. Adding owners makes accountability much clearer, especially when multiple people or departments are involved.
Put all these together, and your Gantt chart turns into a clear, visual plan and not just a timeline.
How a Gantt chart works (how to read one)
At first glance, a Gantt chart can look a bit busy. But once you know what to focus on, it’s actually very straightforward.
Here’s how to read it:
1. Read each row as a task
Each row represents a single task in your project. The task name is usually on the left, and everything to the right shows when and how that task happens.
Think of it like reading a checklist, but with timing built in.
2. Look at the bars to understand timing
The horizontal bars are the most important part.
- Where the bar starts = when the task begins
- Where it ends = when the task finishes
- The length of the bar = how long the task takes
Long bar? Bigger task. Short bar? Quick win.
3. Watch for overlaps
When two bars sit on the same timeline and overlap, it means those tasks happen at the same time.
This is helpful for spotting:
- What your team is working on simultaneously
- Where things might get too busy
- Opportunities to speed things up
4. Follow the arrows (dependencies)
Arrows connect tasks that depend on each other.
For example:
- Task B might start only after Task A is done
- A delay in Task A will push everything connected to it
If you want to understand risk in a project, follow the arrows; they’ll tell the real story.
Benefits of using a Gantt chart for project management
Out of the many productivity tools out there, Gantt charts are the most common tool for progress tracking among project managers.
Here are some of the benefits of using Gantt charts for project management:
- Shows your project schedule at a glance. A Gantt chart is handy for mapping out your project tasks and when they should happen. It simplifies the process for project managers to spot if things are going smoothly or if there’s a task that needs a nudge or some extra time.
- Helps you make timely changes. When you see your project schedule displayed as a Gantt chart, it becomes clear where there are holes in the schedule and where tasks may be overlapping. You can then make the necessary adjustments to your schedule to avoid future problems.
- Shows you where tasks start and end. With a Gantt chart, you’ll know exactly when each task starts and ends, making it easy for you to manage your team members’ workload.
- Helps you track progress. As a project manager, you need to be able to track the progress of each task. With Venngage templates, you can easily create your own Gantt chart so you have a project timeline that can be shared and updated by your team members.
- Allows you to identify task dependencies. A Gantt chart in project management makes it easy to visualize where each task fits in with all the others and how one result leads to another in a set of tasks.
How to use a Gantt chart in project management (step-by-step)
Imagine a Gantt chart as a visual roadmap for your project. It breaks down everything into manageable tasks, shows how they connect, and tracks the timeline for each.
So, how can you use a Gantt chart for your next project? Here’s a breakdown:
List your tasks
Begin by brainstorming all the tasks involved in your project, regardless of size. Remember, even small details matter. Consider breaking down larger tasks into smaller, more manageable steps. This will create a more realistic and easier-to-follow plan. Like how it’s done in the example below:

Schedule them on the timeline
Estimate the time required for each task and assign start and end dates on the chart. Be realistic with your estimations, but remember to include buffer time for unexpected situations.
Need a clear and adaptable project timeline? Consider using this Gantt chart template.

Show dependencies
If some tasks require completion of others before they can begin, use arrows to link them. This helps visualize the project flow and identify potential bottlenecks. For instance, writing a report requires collected data, so link the “data collection” task to the “report writing” task.
Alternatively, you can also follow how it’s done in this example. The Gantt chart showcases tasks sequenced and subtasks clearly assigned to different team members. A timeline for when each subtask should be completed is also listed clearly to make sure everyone is in the loop.

Track progress
As you work through your tasks, update the chart by shading the bars to reflect completion progress. This provides a clear understanding of your current position and allows for adjustments if needed. Regularly monitor progress and be prepared to adapt your schedule if tasks take longer than anticipated or challenges arise.
Staying on track with your project timeline is super important, especially if a lot of people are involved – like in a movie production. If you’re a producer juggling a massive team for your next project, check out this template. It might be just what you need to keep things smooth sailing.

Assign resources
Consider using the chart to indicate who is responsible for each task. This ensures everyone is aware of their roles and responsibilities.
Tired of resource allocation headaches? Use this Gantt chart template to assign tasks to departments and team members.

Utilize colors and labels
Don’t be afraid to add visual elements! Use different colors to categorize tasks or highlight milestones. Add labels for additional information, such as task owners or completion percentages.
See how this Gantt chart uses color-coding to clearly show which departments own each task:

Just what you need? Looks like it’s time to ditch the overwhelming to-do list with the help of professionally designed Gantt chart templates. You might be surprised at how much smoother your projects can run.
How to track progress in a Gantt chart (status, updates & critical path)
There are many benefits in using a Gantt chart to free online project management software that helps you manage all the tasks involved in your projects. Here’s how you can use Gantt charts to your advantage so you stay on track:
- Calculate how much time tasks may take. Before diving into your Gantt chart, get a sense of task durations. Break down complex tasks into subtasks early on for better planning.
- Make sure that your Gantt chart is up to date. Regularly updating a Gantt chart is crucial in project management. A dynamic project schedule prevents potential issues compared to maintaining a static one.
- Include project milestones in your Gantt chart. As the project manager, it’s important to stay on top of your project’s timeline and note key project milestones. Even if some milestones are less demanding than other tasks, dedicate a separate Gantt chart line to those that require more attention.
- Create a timeline with critical paths first. A critical path is a series of tasks crucial to the project’s timeline. When creating the Gantt chart, prioritize including project milestones in the critical path. Tasks with less time or resources needed can run alongside the critical path.
- Give your stakeholders access. It’s crucial to keep everyone, including your team and other project parties in the loop. Involving others in creating the Gantt chart not only ensures accuracy but also prevents costly scheduling mistakes for the project.
3 methods for creating a Gantt chart for project management
There are plenty of free tools out there that project managers can use to create Gantt charts. This guide is going to talk about some of them along with how you can use Gantt charts for project management.
Create a handwritten Gantt chart in your notebook
When creating your handwritten Gantt chart for project management purposes, all you really need is a notebook and something to write with.
The best part about doing it this way is that there are no distractions or problems caused by using technology. However, maintaining a handwritten Gantt chart can be challenging because you’ll want to make updates between tasks, which can be hard to do in a notebook.
Manually create a Gantt chart with Excel or Google Sheets
Creating a Gantt chart on Excel or Google Sheets may take some time, but it’s one way to track the progress of your project. As long as you keep the document open on your computer or device, there’s no chance of anyone losing access to their important data or seeing something they shouldn’t.
While it is possible to use an Excel Gantt chart template, it can be quite difficult to customize a template in a way that will work best for your team. Another downside to creating a Gantt chart on Excel or Google Sheets is that you can’t reuse the same document for more than one project.
Easily create your own Gantt chart with Venngage
If you’re looking for project plan templates that offer flexibility and ease of use, you can quickly create one with a Gantt chart software like Venngage. All you have to create a free account and you’ll be able to have access to several project management infographics like this Gantt chart to help you get started.

With Venngage, you can easily customize this weekly project Gantt chart in just a few simple steps. All you have to do is:
- Select the pre-designed template.
- Customize the template with your own content; and
- Download or share it instantly.
With a Gantt chart software like Venngage, project managers can keep track of projects with ease so they have time to work on other more important things like project planning or task management.
Project management Gantt chart FAQs
Where does the term ‘Gantt chart’ come from?
The term ‘Gantt chart’ comes from Henry Gantt, also known as the father of Gantt charts. Back in 1918, when he was working on different project management tools during World War I, he used this term to refer to a project schedule that uses bars to show specific tasks over time.
How do you analyze a project management Gantt chart?
When looking at a project management Gantt chart, the first thing you can do is to understand the timeline. It’s important that you know what time each bar represents, what milestone has been completed, and how this relates to the overall timeline of the project.
If you’re a project manager working on a Gantt chart, take a step back from time to time and look at it from an outsider’s perspective. Is it easy to read? Can you understand what’s happening at a glance? Does it help you to see the progress of the project or does it make things harder for you to understand? By answering these questions, you get a better sense of whether your Gantt chart will be easy for your colleagues to understand.
What are the elements of a Gantt chart?
A Gantt chart includes bars that represent different tasks, specific timelines, milestones, and resources. Here are the most important elements:
- the timeline
- the milestones
- the time it will take to complete each task
All of these elements are important when creating Gantt charts. When trying to create your own Gantt charts for projects, it’s important to keep these things in mind. That way, you and your team can work towards completing tasks while staying on time and on a budget for a successful project.
In conclusion: Venngage makes project scheduling easy with Gantt charts
Now that you have the tools and the knowledge needed to create your own Gantt chart, it’s time to start planning and managing your project with ease. By using online Gantt chart tools like Venngage, you can create your own project timeline with Gantt chart templates. All you need is to pick and customize a template in minutes, which you can then share with your team.
If you feel that Gantt chart project management is not working for you or your team, Venngage offers other project timeline templates that you can use to help you with project scheduling. With Venngage templates, you can work smarter and more efficiently.
Start by signing up for a free account and see how you can use project scheduling templates like Gantt charts to make your work easier.


